




Abstract
The recent Every Student Succeeds Act (ESSA) requires states to identify and turn around their lowest performing schools, but it breaks somewhat from prior policies by granting states significant autonomy over how they identify and turn around these schools. This mixed-methods study, which draws on administrative, qualitative, and survey data, examines the effectiveness of Michigan’s approach to school turnaround under ESSA. We find that students in turnaround schools experienced significant achievement gains in math and to a lesser extent in English language arts (ELA), with effects concentrated among the lowest achieving students. Analyses of qualitative and survey data suggest that these outcomes were influenced by state-level supports, strategic planning, the threat of accountability for continued low performance, and improved leadership quality in turnaround schools.
Keywords
There is reason to believe that turnaround under ESSA may differ from those enacted under earlier federal policies. Unlike SIG and RTTT, which prescribed specific turnaround models, ESSA allows states broad autonomy in turning around their lowest performing schools. State ESSA plans have outlined varying approaches to school turnaround in terms of district and state roles, identifying schools for intervention, and improving teacher quality (Close et al., 2019; Dunn & Ambroso, 2019; Portz & Beauchamp, 2020). One characteristic all state turnaround strategies must share is a comprehensive planning process; ESSA requires that districts develop an improvement plan in low-performing schools that is informed by school performance data and a school-level needs assessment.
In this article, we draw from statewide administrative data, educator surveys, and interviews with leaders of turnaround districts and charter organizations to investigate the implementation and effects of Michigan’s school turnaround strategy under ESSA, called the Partnership Model. Michigan first implemented the Partnership Model in 37 chronically low-performing schools in the 2017–2018 school year and identified two more rounds of schools that entered turnaround in 2018–2019. Although the state used different mechanisms to select each of the three rounds of Partnership schools, each round reflected the state’s identification of its lowest performing schools at the time of identification. We examine the effects of the Partnership Model across all three sets of selected schools. Specifically, we ask the following:
In what follows, we begin by briefly reviewing the literature on school and district turnaround in the post-NCLB era and then describe the Partnership Model. Next, we describe our quantitative and qualitative data and methods. We then summarize the results and conclude with a discussion and policy implications for school turnaround under ESSA.
Literature Review
ESSA marks a departure from prior rounds of federal turnaround reform, with four features in particular setting it apart. The first three follow the blueprint laid out by Elementary and Secondary Education Act (ESEA) waivers, which gave states expanded flexibility to approach turnaround in the period after the RTTT and SIG interventions and before the adoption of ESSA. First, ESSA does not mandate specific turnaround models. Second, it devolves the responsibility of turnaround design from the federal government to state and local edu-cation agencies, requiring states to identify Comprehensive Support and Improvement (CSI) schools and then calling for local education agencies to work with stakeholders to implement an improvement plan. This policy design implicitly recognizes the importance of the district in leading and promoting school improvement, and several states have responded by elevating the district role (Dunn & Ambroso, 2019; Fullan, 2016; Hopkins et al., 2014; Karcher & Knight, 2021; Meyers, 2020). Importantly, this approach to turnaround differs from state takeovers of districts, which have shown some positive but on average null effects across the country (Schueler & Bleiberg, 2022; Schueler et al., 2017). Instead, turnaround under ESSA entrusts more autonomy to district leaders rather than assigning a third party to oversee the district more closely. Third, ESSA does not allocate substantial additional funding for school turnaround. Finally, ESSA requires states to identify low-performing schools using a multidimensional measure of school performance rather than through proficiency rates alone. By contrast, prior waves of federal accountability policy have either explicitly focused on proficiency targets (i.e., NCLB) or states have implemented systems centered around proficiency rates (i.e., RTTT, SIG, and ESEA waiver Priority schools). This expanded definition of school performance may change the ways states and districts approach turnaround because it changes the nature of the outcomes they are trying to improve.
Effects of Prior Reforms
The shift in school turnaround and accountability under ESSA comes on the heels of a string of reforms that produced positive average effects, but with substantial heterogeneity across contexts (Redding & Nguyen, 2020; Schueler et al., 2021). Here, we discuss prior reforms beginning with NCLB and culminating with ESEA waivers. There is some evidence that NCLB interventions improved student achievement and closed achievement gaps (Dee & Jacob, 2011), although effects were uneven across grade levels, subject areas, and state contexts (Dee & Jacob, 2011; Ladd, 2017; Lee & Reeves, 2012; Strunk et al., 2014; Strunk & McEachin, 2014). However, NCLB’s emphasis on proficiency rates also created perverse incentives for schools to focus on the so-called “bubble” students to the detriment of students throughout the achievement distribution or to push out students expected to score below proficient. In particular, improvements in student achievement and decreased achievement gaps were concentrated among students near the cusp of the test proficiency threshold—suggesting districts may have triaged supports to the students most likely to increase proficiency rates (Balfanz et al., 2007; Booher-Jennings, 2005; Cullen & Reback, 2006; Darling-Hammond, 2006; Ho, 2008; Jacob, 2005; Jennings & Bearak, 2014; Krieg, 2008; Reback, 2008; Strunk et al., 2014).
NCLB interventions gave way to RTTT and SIG whole-school reform interventions, which introduced school and district turnaround to the federal policy parlance around low-performing schools. Unlike prior iterations of whole-school reform such as those taking place under NCLB (and previously the Comprehensive School Reform program), turnaround aimed to impel rapid and dramatic changes in low-performing schools (Aladjem et al., 2010; Herman et al., 2008; Peurach & Neumerski, 2015). In addition, federal turnaround policy prescribed specific strategies for states to follow—providing considerably less discretion to state and local education leaders than prior federal policy. Turnaround schools in Massachusetts, California, Ohio, and Tennessee made student achievement gains under RTTT and SIG (Carlson & Lavertu, 2018; LiCalsi et al., 2015; LiCalsi & Píriz, 2016; Papay & Hannon, 2018; Sun et al., 2017; Zimmer et al., 2017). Some reforms also produced positive effects on proximate outcomes such as increased teacher retention and quality, and reduced student absenteeism (Papay & Hannon, 2018; Pham et al., 2020; Sun et al., 2017). Across multiple states, the positive effects of SIG were largely sustained after the reforms concluded (Sun et al., 2020).
However, positive average treatment effects mask heterogeneity both across and within interventions. Turnaround in North Carolina, Tennessee, and Texas produced mixed effects (Dickey-Griffith, 2013; Heissel & Ladd, 2018; Henry & Guthrie, 2019; Zimmer et al., 2017), and some of the interventions yielding positive overall effects also produced null or negative effects in particular contexts or cohorts (Carlson & Lavertu, 2018; Strunk, Marsh, Hashim, et al., 2016; Zimmer et al., 2017). The heterogeneity of effects highlights variation in both the features and implementation of state turnaround interventions. Even under SIG, which prescribed specific turnaround models and practices, there was variation in the practices states chose to implement (Dragoset et al., 2015).
As RTTT and SIG grants concluded, states replaced their tightly mandated turnaround interventions with more flexible policies under ESEA waivers, which required states to identify and support their low-performing schools but—like ESSA—did not mandate how states should do so. These waiver-based reforms yielded few positive effects, although the reform models themselves and their implementation again varied widely across states. Of the states with evaluations of waiver reforms, one—Kentucky—produced positive effects on student achievement, which the authors attributed in part to clearly articulated state guidance for the comprehensive school improvement planning process (Bonilla & Dee, 2020). Waiver-based reforms in New York, Michigan, Rhode Island, and Louisiana produced either null or negative effects on student achievement (Atchison, 2020; Dee & Dizon-Ross, 2019; Dougherty & Weiner, 2017; Hemelt & Jacob, 2017, 2018). A similar state-initiated reform in North Carolina that focused on tailoring turnaround services to school needs also led to negative effects on student achievement, early grade outcomes, and teacher retention (Henry & Harbatkin, 2020; Henry et al., 2022). By contrast, an Ohio reform that involved supporting district and school leaders in developing comprehensive plans produced positive effects on school-level student achievement (Player & Katz, 2016). In Washington state, strategies delineated in school improvement plans under SIG and ESEA waivers predicted improvements in student achievement and absenteeism (Sun et al., 2019). These findings highlight the importance of the comprehensive planning process in more loosely mandated turnaround reforms like ESEA waivers and the new wave of reforms under ESSA.
As in other states, Michigan’s reforms under these earlier federal policies produced mixed effects. Students in Priority schools, which comprised the bottom 5% of schools under the state’s ESEA waiver reform, fared worse than their counterparts in other low-performing schools in math and reading in both the first and second years of the intervention (Hemelt & Jacob, 2017). In Focus schools (schools with the widest achievement gaps between high- and low-achieving students), a short-run decrease in the math achievement gap was driven by stagnant performance among high-achieving students rather than growth among lower achievers. There were no effects on the reading achievement gap or math or reading performance (Hemelt & Jacob, 2018).
School Turnaround Under ESSA
It is unclear how evidence stemming from prior reforms will generalize to ESSA turnaround interventions. Although there were some positive effects of prior turnaround efforts, several studies suggest schools that were subject to more disruptive reform models under RTTT and SIG fared better than schools under less disruptive models (Carlson & Lavertu, 2018; Dee, 2012; Strunk et al., 2014; Sun et al., 2017). It is thus far unclear whether and to what extent a flexible and tailored turnaround model in combination with a more nuanced view of school performance will translate into improved student outcomes. As no peer-reviewed studies have yet examined school turnaround policies under ESSA, little is known about whether these new features are conducive to improved student outcomes.
However, prior literature points to four mechanisms through which less disruptive ESSA reforms like the Partnership Model could impact student achievement: the comprehensive planning process, external supports, the threat of accountability, and improvements to human capital. First, the quality of comprehensive plans can vary, and their content plays an important role in reform implementation (Anfara et al., 2006; Mintrop & MacLellan, 2002; Redding & Searby, 2020; Strunk, Marsh, Bush-Mecenas, & Duque, 2016). This is important because a comprehensive planning process that generates clearly articulated plans has the potential to induce meaningful improvements in low-performing schools and districts—while a pro forma approach may not (Bonilla & Dee, 2020; Huber & Conway, 2015; Player & Katz, 2016; Strunk, Marsh, Hashim, et al., 2016; Sun et al., 2019).
Second, the scope and quality of external supports and resources made available to turnaround schools and districts matter. Schools may be low-performing because they lack the resources needed to build the systems that undergird improvement (Karcher & Knight, 2021). Although early attempts at school reform focused largely on accountability, RTTT and SIG paired accountability with an influx of federal funding for states to support low-performing schools. Positive effects under RTTT and SIG were unique in both their prevalence and magnitude, suggesting that these new resources may have played an important role (see Carlson & Lavertu, 2018; LiCalsi et al., 2015; LiCalsi & Píriz, 2016; Papay & Hannon, 2018). Third, there is evidence from the NCLB era that the possibility of high-stakes consequences for failing to make reasonable progress can induce improvement (Carnoy & Loeb, 2002; Chiang, 2009; Dee & Jacob, 2011; Hanushek & Raymond, 2005; Jacob, 2005). Under NCLB in particular, the threat of sanctions appeared to increase student achievement in some contexts (Reback et al., 2014; Springer, 2008).
Finally, an abundance of research highlights the importance of human capital to school effectiveness and improvement. A stable and highly effective teacher and principal workforce is critical to successful turnaround (Harbatkin, 2022; Henry et al., 2020; Pham et al., 2020; Pham, 2022). When teachers and principals do turn over, schools need a robust local educator labor market from which to draw replacements (Malen & Rice, 2016; Strunk, Marsh, Hashim, et al., 2016). Principals in particular are responsible for building the framework for school improvement, for example, by setting school climate and culture, coalescing staff around a shared mission, and acting as instructional leaders (Burkhauser, 2017; Duke, 2004; Duke & Salmonowicz, 2010; Hitt et al., 2018; Leithwood & Jantzi, 1990; Weiner, 2016; Woulfin & Weiner, 2019).
Although prior research points to these mechanisms as important for successful school improvement under earlier reforms, there is thus far no evidence on how they may contribute to turnaround under ESSA. This article adds to the turnaround literature in three ways. First, we examine implementation in addition to impact to unpack not just whether Partnership turnaround affected school outcomes but also how it affected them. There are, to date, few studies that combine both impact and implementation analyses (see Henry & Harbatkin, 2020; Papay et al., 2021; Strunk, Marsh, Hashim, et al., 2016, for notable exceptions). Second, we provide early evidence on the implementation and effects of a generalizable school turnaround reform under ESSA. Although its implementation began a year before states were required to begin intervening in low-performing schools under ESSA, the model is the state’s intervention under ESSA, meets ESSA requirements for identifying and supporting low-performing schools, and is similar to ESSA turnaround models throughout the country in its focus on customizing supports to school and district-specific needs. Thus, results are likely generalizable to ESSA turnaround reforms across the country. Finally, we examine the effects of ESSA turnaround on low-achieving students, who tended not to improve under prior accountability interventions that classified schools using proficiency rates. Although previous research has estimated the effects of accountability interventions on the lowest achieving students, this study builds on prior work by examining the effects of a turnaround reform that defines progress using a multidimensional measure of school effectiveness rather than a singular focus on proficiency rates.
Michigan’s Partnership Model of School and District Turnaround
Michigan’s Partnership Model of School and District Turnaround began in the spring of 2017. Under Michigan law in effect at the time, the state could force schools that consistently performed in the bottom 5% of schools statewide to close. In January 2017, the state identified schools across nine districts that were in the bottom 5% for three consecutive years and announced that they may face closure. 1 This move provoked public outcry, with several districts filing lawsuits challenging the state’s authority to close their schools. At the time, officials in the Michigan Department of Education (MDE) were working on Michigan’s ESSA plan that was to be implemented that fall. In light of the political and legal challenges around closing persistently low-performing schools, the governor and state superintendent of public instruction reached an agreement that moved up the timeline for implementing MDE’s plan to support low-performing schools and districts, and the schools slated for possible closure were instead provided with supports and accountability under the new Partnership Model. As of 2020, a total of 119 schools across 36 districts have become Partnership schools through three rounds of identification—each employing a slightly different method of selecting schools for Partnership—that took place in spring 2017, fall 2017, and spring 2018. 2
Figure 1 shows the theory of change guiding the Partnership Model. The primary goal of the Partnership Model is to improve student outcomes in low-performing schools. At the same time, the Partnership Model conceives of low performance at the school level as symptomatic of issues at the district level and so has a secondary goal of improving capacity in the districts that operate low-performing schools. As such, the Partnership Model aims to improve student outcomes in identified schools by supporting the local educational agencies (LEAs) that operate them. This approach to turnaround follows the intended theory of action under ESSA, which relegates the responsibility of designing turnaround strategy from the federal government to states and districts (Dunn & Ambroso, 2019).
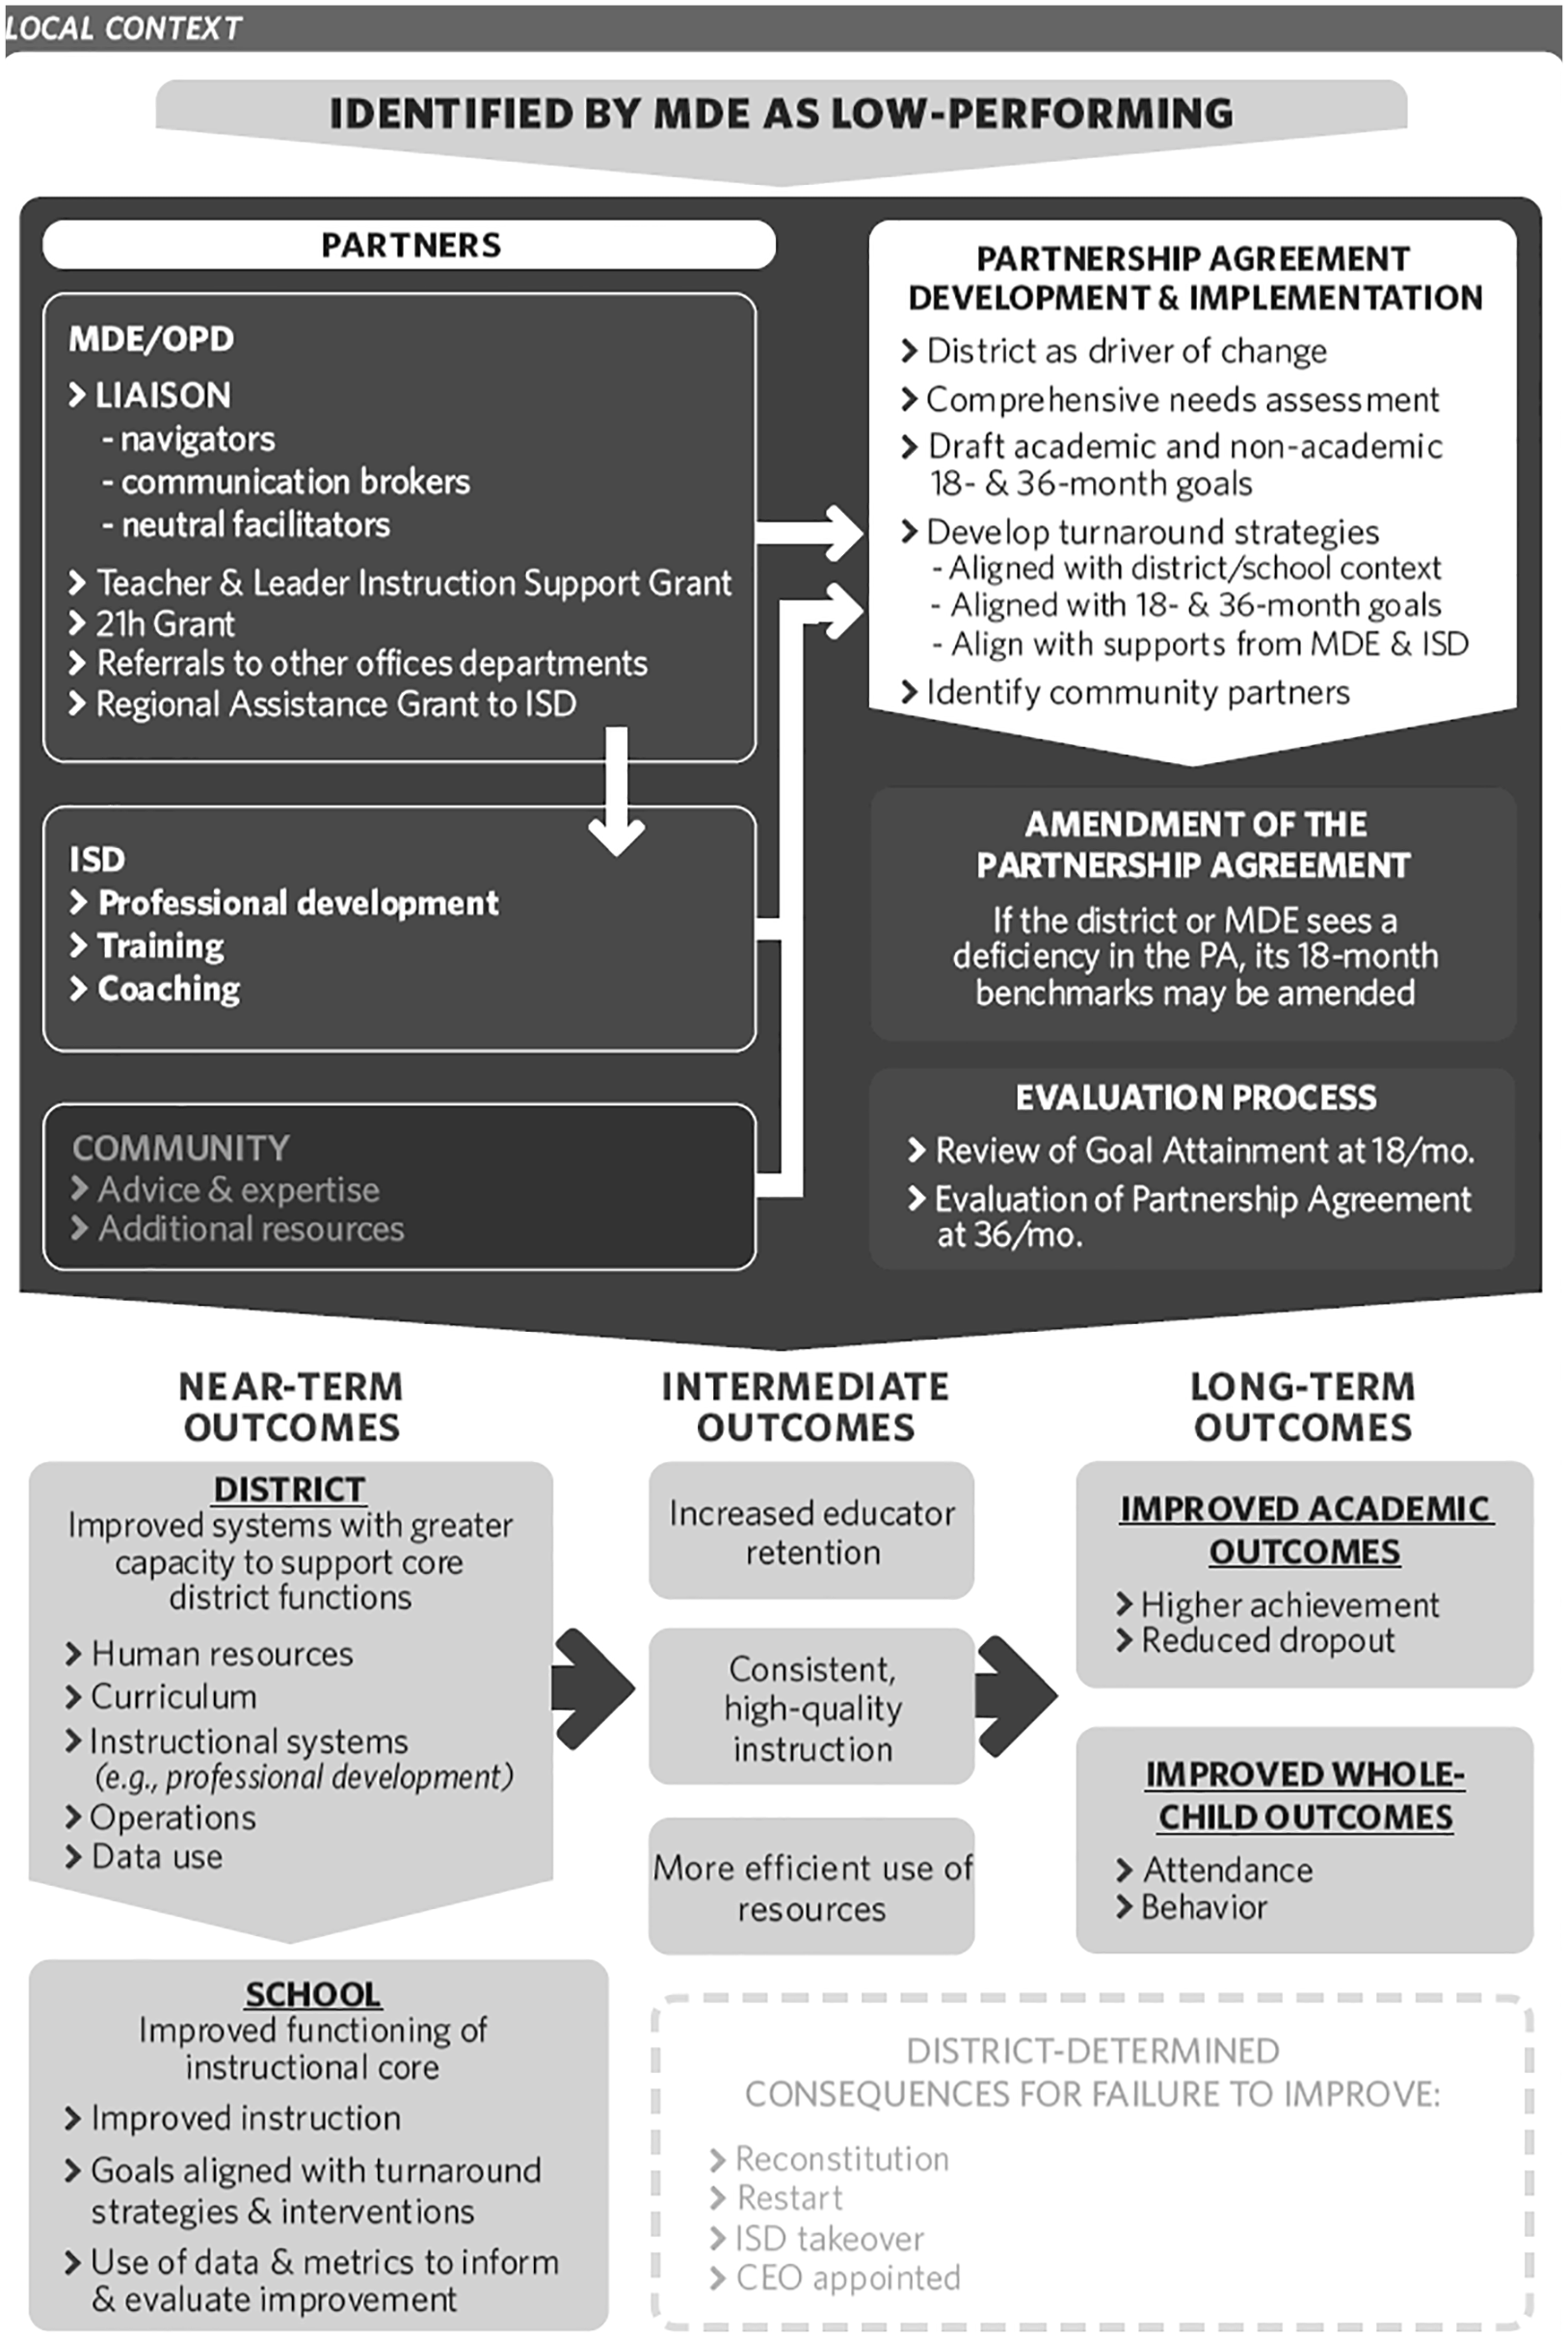
Partnership Model’s Capitalize Theory of Change.
After a school is identified as low-performing, it is designated as a Partnership school and the LEA that operates it is designated as a Partnership district to enact and oversee the turnaround of its Partnership school(s). Both traditional public schools (TPSs) and charter schools (called public school academies in Michigan) can be identified for turnaround. In the case of TPS Partnership schools, their parent district is charged with leading their turnaround. In the case of charters, different entities may serve as the Partnership district, often their central office or educational service provider—sometimes referred to as an educational management organization or management company.
After a district is identified for Partnership, a series of supports become available to guide turnaround work in identified schools. State-level supports include a Partnership Agreement liaison (PAL) from MDE to provide individualized supports to district leadership along with access to grants available only to Partnership districts. At the regional level, districts receive greater support from their intermediate school district (ISD), entities that generally coincide with counties and are intended to provide local districts with services that MDE does not. District–ISD relationships vary considerably, but districts may contract with ISDs around special education services, professional development, data services, and a range of other supports. Through the Partnership Model, MDE directs additional funding to ISDs that serve Partnership districts to provide extra supports for identified Partnership schools. In most cases, this funding was used to provide Partnership districts with additional professional development and various forms of coaching related to the needs identified by the district. At the local level, Partnership districts are encouraged to reach out to community organizations, such as civic groups, the local business community, and community health agencies, for additional supports. The original theory of change conceived of local partners as key players in Partnership districts’ turnaround efforts, but their role was de-emphasized during implementation.
Drawing on these supports, Partnership districts develop a Partnership Agreement that serves as a contract with MDE to improve student outcomes in each of its Partnership schools over a 36-month period. As with other ESSA-based turnaround models, this process begins with the district conducting a comprehensive needs assessment to identify its own, and its Partnership schools’, strengths and weaknesses. That needs assessment is used to identify, for each Partnership school, academic and nonacademic improvement goals to be met over 18- and 36-month time periods; strategies aligned with those improvement goals; supports the district will receive from state, regional, and local partners; and accountability measures to be implemented if improvement goals are not met. After the Agreement is drafted, it must be formally approved by the district, its ISD, MDE, and community partners. Once approved, the Agreement is implemented beginning in the following school year. To monitor progress toward the goals outlined in their Partnership Agreements, MDE conducts an interim evaluation 18 months into implementation, during which MDE gauges each Partnership school’s progress toward its improvement goals and then uses its assessment to rate schools’ progress. Partnership districts that are found to be “off-track” are required to implement additional improvement strategies and undergo another evaluation at 24 months of implementation. Partnership districts’ final evaluations are conducted at 36 months, at which point schools that meet their goals are released from Partnership status and the accountability measures spelled out in the Agreement are administered in schools that fail to meet their goals.
As the bottom of Figure 1 shows, a secondary aim of the Partnership Model is to foster improvement in district-level systems, which in turn supports sustained improvement at the school level, particularly in identified Partnership schools. This should then lead to intermediate outcomes, such as increased educator retention and higher quality instruction, and eventually to improved academic and whole-child outcomes for students. Ideally, this improvement will then continue beyond the time period covered by the Partnership Agreement.
Sample, Data, and Methods
To evaluate the Partnership Model, we use a mixed-methods triangulation design (Creswell & Plano Clark, 2017) that includes multiple types of data and methods of analysis. A triangulation design is well-suited to an evaluation of an intervention as complex as the Partnership Model because it allows us to assess results through multiple sources of data and methodological strategies. By integrating analyses of varied sources of qualitative and quantitative data, we are able to paint a rich picture of how this reform is being implemented across districts and schools, and the effectiveness of the reform along its intended outcomes. We employ this triangulation design by first using a series of event study models to answer Research Questions 1 and 2, estimating the effect of the Partnership Model on student outcomes overall and for subgroups of students by prior achievement. Next, to answer Research Question 3, we draw on qualitative and survey data to examine how implementation of the Model at the school and district levels shaped these effects.
Administrative Data
Sample
The event study draws from statewide administrative data on students and teachers from 2013–2014 through 2018–2019 provided by MDE and the Center for Educational Performance and Information (CEPI). This includes approximately 9 million student-year observations representing 2,244,145 students. To examine the impact of Partnership on student outcomes, we limit the student sample to just those who were enrolled in a Partnership school during these years and identify students in Partnership schools as the treated group and students enrolled in near-selected schools for each cohort as the comparison group. This analytic sample contains 971,656 student-year observations representing 306,307 unique students. Our main models further restrict this sample by identifying students as being either in the treatment or in the comparison group based only on the school they attended in the year of Partnership identification (see Table 1 for counts of students and schools by treatment condition in the identification year). By classifying students as treatment or comparison based on their school assignment at the time of Partnership identification, we are estimating an “intent-to-treat” (ITT) effect of Partnership based on school assignment prior to the intervention. This time-invariant treatment assignment provides the most conservative effect estimates by avoiding selection bias from families choosing to transfer students in or out of Partnership schools in response to the intervention. 3
Number of Unique Schools and Students by Cohort in Their Identification Year

Note. ITT = intent-to-treat.
Thus far, there have been three rounds of Partnership identification, and the analytic sample therefore contains three rounds of treated schools. We provide detail on how each round of Partnership schools was selected in Supplemental Appendix B (in the online version of the journal). Because the state identified Rounds 2 and 3 in the same school year and treated them on the same implementation and evaluation schedules, we combine them into a single treatment group we call Cohort 2. We therefore separately examine each cohort of schools—Cohort 1 (comprising 37 Round 1 schools) and Cohort 2 (comprising 39 Round 2 and 43 Round 3 schools for a total of 82 schools). Because Round 2 and 3 schools were identified using different metrics and 6 months apart, we also conduct supplemental analyses to unpack differences in effects between these two rounds.
For each cohort, we construct a comparison group of near-selected low-performing schools that were never identified for Partnership. The Cohort 1 comparison group comprises the 80 Priority schools from the 2015–2016 school year that were not selected as Partnership schools in Round 1, 2, or 3. The Cohort 2 comparison group includes the 156 schools in the bottom 10% on Michigan’s ESSA index system in 2017–2018 that were not identified for treatment in any round of Partnership. 4
Treated schools in both Cohort 1 and Cohort 2 are, on average, lower performing than the schools in their respective comparison groups, which is not surprising given that schools were selected for Partnership on the basis of low performance. Supplemental Appendix Table A-2 (in the online version of the journal) shows that treated and comparison schools have similar shares of students who are economically disadvantaged and that treated schools have larger shares of students who are Black, slightly larger shares of students who receive special education services, and lower shares of students who are White, Hispanic or Latinx, and English Learners. The final two columns of Supplemental Table A-2 (in the online version of the journal) make clear that comparison schools are more observably similar to treated schools than other schools throughout the state. As we describe later, the causal interpretation of the estimates in our event study does not rely on baseline equivalence but rather on parallel pretreatment trajectories on the outcome and evidence that there was no anticipatory response to treatment assignment. Collectively, data used for analyses of Cohort 1 include 414,456 student-year observations (149,135 unique students). Cohort 2 data include 689,407 student-year observations (230,240 unique students). 5
Although the decision to assign treatment status based on students’ location in the identification year most cleanly addresses selection issues that are endogenous to Partnership identification, the estimates from these models may be attenuated for two reasons. First, students in a Partnership school during the identification year could, during implementation, move to either a comparison school in our sample or a non-comparison school that we do not include in our sample. Similarly, students in comparison schools during the identification year may transfer to Partnership schools (or to non-comparison, nontreated schools) after identification. To that end, not all students classified as treated would have received the full dose—or in some cases, any dose—of treatment, and some students classified as comparison would have received some dose of treatment. Second, some schools in the comparison group may receive some element of the treatment, being that Partnership is implemented through districts with a particular focus on targeted schools within them. To the extent that Partnership contributes to improved district-level systems and functioning, comparison schools in Partnership districts may improve alongside treated schools.
We estimate models on three additional populations to examine the extent to which each of these potential sources of attenuation bias may contribute to our preferred estimates. First, we employ Sun et al.’s (2017) “all starters” approach by assigning students to treatment or comparison based on the school they attended during the first implementation year rather than the identification year. For Cohort 1, this approach creates a sample based on school assignment in the 2017–2018 school year and follows the same cohort of students into the next year. For Cohort 2, where we have only 1 year of outcome data, this approach produces a treatment-on-the-treated (TOT) estimate because it estimates the effect of treatment based on a single year of implementation. 6 To the extent that our preferred estimates are attenuated by student mobility, the all starters models will find larger effects.
Second, we return to the original student assignment approach (i.e., treatment assignment based on school in the identification year) but drop non-Partnership schools in Partnership districts from our comparison group. This approach drops 16,515 and 22,943 students in 29 and 42 schools from the Cohort 1 and 2 comparison groups, respectively. To the extent that the Partnership Model improved district-level systems that led to increases in student achievement for students in low-performing, non-Partnership schools in Partnership districts, these secondary effects would cause estimated effects of the intervention to be larger than in our preferred models. Thus, both specification tests should confirm that our preferred approach returns the most conservative estimate of Partnership Model impact.
Finally, we estimate models in which we move students in non-Partnership schools in Partnership districts (i.e., the students we dropped out in the prior specification) from the comparison group to the treated group to more directly estimate the effects of Partnership on untreated low-performing schools in Partnership districts. This approach allows us to estimate the effect of Partnership on students in all low-performing schools in Partnership districts, including schools identified for Partnership and students in near-selected schools.
Outcome Measures
The primary outcome of interest is student performance on state standardized tests in mathematics and English language arts (ELA) given to all fourth- through eighth- grade students each year. In addition, we examine SAT achievement, high school graduation, and high school dropout. We provide additional details for these measures in Supplemental Appendix C (in the online version of the journal).
Lagged Achievement
We classify students as low- or high-achievers within their school based on their performance on the Michigan Student Test of Educational Progress (M-STEP), the suite of assessments administered to Michigan students in Grades 3 to 8, in the identification year for their cohort. Specifically, we classify low-achievers as those in the bottom quartile of their school in the identification year and high-achievers as the top three quartiles. Although other research has focused on bubble students and examined heterogeneity in lagged performance based on distance from the proficiency threshold (e.g., Booher-Jennings, 2005; Strunk et al., 2014), we choose to examine the difference between low- and high-achievers within their own schools for two reasons. First, the vast majority of students in Partnership schools score below proficient, making the “bubble” students–type analyses less relevant in this instance. 7 Second, we want to understand how treated schools and districts may or may not provide greater services to, or focus on, the lowest performing students within their own schools and districts. Unlike NCLB, which targeted schools based on proficiency rates alone, the more expansive view of achievement under ESSA and Partnership may lead to less focus on moving students over proficiency thresholds.
Estimation Strategy
We estimate event study models separately for the two cohorts of treated and comparison schools. The model for student outcomes (i.e., Grade 4–8 test scores) in Cohort 1 takes the form
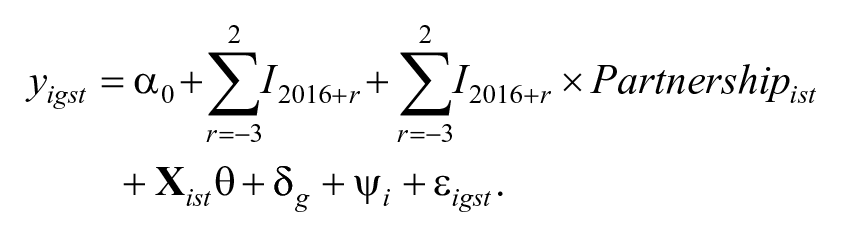
estimating outcome y (i.e., test score level or test score gains) for student i in grade g in school s in year t. I2016+r represents a series of year indicators from 2013–2014 through 2018–2019, with 2016–2017 (the year of Partnership identification for Cohort 1) as the omitted reference year. We interact these year indicators with a binary indicator of treatment status, Partnershipist, that takes a value of 1 for students who were assigned to Partnership schools at the time of identification. The coefficients on these interactions provide the estimated difference in outcomes between students in Partnership and comparison schools relative to the omitted 2016–2017 school year. The interactions for 2017–2018 and 2018–2019 provide the estimated effects of the Partnership reform for Cohort 1 in the first 2 years of implementation.
To estimate heterogeneous effects by lagged achievement, we estimate separate models for low- and high-achievers based on their test scores in a particular subject in the identification year. Estimates of school-level outcomes (i.e., SAT scores, graduation rate, dropout rate) largely follow the model above, but exclude student covariates and substitute school fixed effects for student fixed effects. The school-level models use treatment assignment based on the school’s status (treatment or comparison) in the relevant identification year. In other words, a school identified for Partnership in year t would be assigned to the treatment group and that assignment retained throughout the panel, and the graduation rate or other school-level outcome observed for that school in year t + 1 is based on all students in that school in that year regardless of the school those students attended in year t.
There are two key identifying assumptions in our event study design. The first is that in the absence of Partnership identification, outcomes in Partnership schools would have followed the same pattern as those observed in our comparison schools, conditional on covariates. We evaluate this assumption by interpreting the coefficients and corresponding p-values for
Partnership Effects on Student Outcomes
Note. Student-level models (i.e., Columns 1–4) include student fixed effects and time-invariant treatment assignment based on school assignment in the identification year; robust standard errors clustered at the time-invariant school level in parentheses. School-level models (i.e., Columns 5–8) include school fixed effects and time-variant treatment assignment; robust standard errors clustered at the time-variant school level in parentheses. SAT ELA = the evidence-based reading and writing section of this assessment; M-STEP = Michigan Student Test of Educational Progress; ELA = English language arts; FE = fixed effects.
p < .10. *p < .05. **p < .01. ***p < .001.
We conduct several additional analyses to examine the robustness of our results. First, estimates from the two-way fixed-effects approach can be sensitive to violations of strict exogeneity of covariates (Baker et al., 2022; Wooldridge, 2021). We therefore re-estimate our models using covariates measured at baseline, interacted with a linear year trend, rather than time-varying covariates. Second, while our estimates will not be biased by staggered intervention timing, our main analyses do combine two identification rounds (Rounds 2 and 3) into a single implementation cohort (Cohort 2) because they are implemented on the same timeline. Due to differences in how these schools were identified, there may be concerns that a common treatment effect could obscure meaningful differences in outcomes. We therefore re-estimate our Cohort 2 models allowing for flexible effects in Rounds 2 and 3.
Three additional analyses are focused on the district-level nature of the intervention. Specifically, while treatment is assigned at the school level, it is implemented through the district and could therefore be considered as a district-level treatment. First, we estimate three different models to assess the extent to which the district-level nature of the treatment may be affecting (a) outcomes in low-performing non-Partnership schools in Partnership districts, (b) estimates for treated schools, and (c) inference on the coefficient estimates in our main models. To estimate the effects of the Partnership Model on low-performing non-Partnership schools in Partnership districts, we run a parallel set of event studies in which we move all students in non-Partnership schools in Partnership districts from the comparison to treated group. Specifically, we count a student as being treated if they are in a near-selected school in a Partnership district, regardless of that school’s Partnership status. In the post-treatment years, we then estimate two separate treatments—one for Partnership schools as in our main models and another for near-selected schools in Partnership districts. These models provide the estimated effects of being assigned to a Partnership school and being assigned to another low-performing school in a Partnership district. If Partnership improved district processes and systems or allocated resources across Partnership and other low-performing schools, these estimates would be positive. Second, we estimate a set of models that drop non-Partnership schools in Partnership districts from the comparison group. To the extent that Partnership affects outcomes in these schools, excluding them from the comparison creates a cleaner counterfactual. Finally, to assess the robustness of our inferences, we re-estimate our main models with standard errors clustered at the district level.
Survey Data and Analysis
To understand the elements of Partnership that made it more or less effective, we draw on surveys of teachers in Partnership districts and interviews with Partnership district leaders. Analyses of survey data provide a window into how Partnership impacted classrooms as teachers worked to implement their district’s Partnership Agreement. We surveyed all teachers in Partnership districts (in Partnership and non-Partnership schools) in fall 2018 and fall 2019. The survey garnered response rates of 38% (N = 2,718) in 2018 and 49% (N = 3,324) in 2019. Panel A of Supplemental Appendix Table A-3 (in the online version of the journal) shows response rates by cohort, year, and treatment status. As expected, response rates were higher for educators in Partnership schools. Panel B compares the characteristics of teachers who did and did not participate in this survey, by Partnership status. In Partnership schools, Black and male teachers responded at a slightly lower rate and White teachers responded at a slightly higher rate. In non-Partnership schools, male teachers responded at a lower rate and elementary-certified teachers responded at a slightly higher rate. These differences are descriptively small and fall below the threshold for baseline equivalence of 0.25 standard deviation units recommended by the What Works Clearinghouse (2022). However, we repeat our analyses using inverse probability weights generated using teacher demographics, certification, and school fixed effects.
Survey items focused on a range of constructs related to Partnership implementation and teachers’ perceptions of conditions within their school. In this study, we focus on constructs related to the mechanisms of improvement outlined in the Partnership Model’s theory of change. To generate constructs to measure implementation, we conducted factor analyses within sets of items from the larger instrument that had been asked in both years of survey administration. We conducted separate factor analyses on all items within a single construct by first determining the number of factors using parallel analysis (Horn, 1965) and then creating principal components factors. Where the parallel analysis pointed to multiple factors within a set of items, we applied a varimax rotation to identify orthogonal factors, removing items that did not fit statistically with other items in the factor. This yielded three factors: (a) Staffing, teachers’ perceptions of teacher and staff retention and teacher attendance; (b) School accountability, teachers’ perceptions that consequences will follow if their school fails to meet its improvement goals; and (c) Perception of school leadership, the extent to which teachers found their school leader to be effective at communicating school mission, strategies, and goals; working with staff to meet curriculum standards; engaging family and community members; and establishing discipline policies. Scale reliability coefficients range from .822 (school accountability) to .957 (school leadership). Supplemental Appendix Table A-4 (in the online version of the journal) provides descriptive statistics for the items used to create these factors, along with the text of items and their response scales. Factor loadings are presented in Supplemental Appendix Table A-5 (in the online version of the journal). We conduct t-tests on these factor scores to compare the perceptions of teachers in Partnership schools with teachers in non-Partnership schools within Partnership districts. We focus on the differences between these sets of schools to help us understand what Partnership districts may be doing differently in their Partnership schools relative to their other schools that are not specifically identified for turnaround.
Qualitative Data
A key characteristic of the Partnership Model is that it provided districts with significant flexibility around the improvement goals set for Partnership schools and the strategies for achieving those goals. In addition, the Partnership Model provided a range of supports from which districts could draw to improve their identified schools. This flexibility allowed variation in how Partnership was implemented in practice across districts that could not be captured with administrative data or surveys. To understand how districts approached the development and implementation of their Partnership Agreements, we recruited leaders in all Partnership districts/charters who were primarily responsible for the creation or implementation of their Partnership Agreement. We interviewed Partnership district leaders in 2018–2019 (n = 22/36 Partnership districts, or 61%) and in 2019–2020 (n = 22/29 Partnership districts, or 76%). In 2018–2019, we conducted these interviews when Cohort 1 schools were generally near their 18-month interim evaluation and in 2019–2020 when Cohort 2 schools were at the midpoint of implementing their Partnership Agreements.
In these 60-minute semi-structured interviews, we sought to understand how leaders perceived the Partnership Agreement and its design and implementation as well as overall perceptions of the successes, challenges, and intent of the Partnership Model. We began with open-ended questions asking them to describe what they put in their Partnership Agreement, what they did to implement the Agreement, and why. We also asked about the successes and challenges they experienced with design and implementation. Depending on the depth of responses, we asked probing questions aligned to the literature on turnaround and policy implementation such as whether or not turnover, relationships between stakeholders, and district capacity influenced implementation. Starting with open-ended questions allowed themes to first emerge primarily from the participants’ experience rather than from the interviewers signaling the importance of specific factors. Following up with nonleading, probing questions allowed us to check to make sure the participant did not accidentally omit or overlook a theme that might have been important. To help maintain confidentiality, we assigned hockey team name pseudonyms to interview districts, and we describe interviewee roles with general categories, such as “superintendent” or “leader.”
Team members coded the interviews using a deductive coding scheme in Dedoose software to condense data in alignment with the theory of change and key themes related to implementation, including codes such as “role of [district leader],” “district capacity,” “human capital initiatives,” and “role of MDE.” The coding scheme was developed by three members of the qualitative team, with Year 2’s coding scheme building from the original Year 1 coding scheme. For Year 1, coders independently coded three interviews to check for reliability, and in Year 2, coders re-established reliability by coding one shared interview and finding agreement. Coders also met regularly to share findings and ensure reliability in coding. In Year 1, after an initial round of coding, we organized key quotes and observations in a matrix to compare findings within and across interviews. Matrices facilitate comparisons and allow trends to emerge within and across cases as researchers group findings together (Bush-Mecenas, & Marsh, 2018). Columns of the matrix included response to the reform, perceived benefits, perceived challenges, and conditions impacting coherence, and each row contained one interview’s data. The matrices allowed us to categorize and better understand the variety of responses within and across Partnership districts. In Year 2, we used a similar process to identify key themes related to implementation as districts continued to refine their practices and plans to meet Partnership goals. We organized quotes by theme across interviews to better understand the scope and variation within the data. Finally, when possible, we counted mentions of key themes that emerged from district leader responses to the structured elements of our interviews. When appropriate, we present these counts to show similarities and differences across Partnership districts. Examples include mentions of specific ways districts utilized partners, positive impressions of working with the state education agency and ISDs around teacher recruitment and retention, and/or using funding associated with the reform.
In the following section, we first discuss the results of our event study analyses that estimate changes in student outcomes attributable to the Partnership Model. We then turn to our qualitative and survey data to examine how Partnership implementation shaped these outcomes. By triangulating across these findings, we are able to explore how the ways in which Partnership schools and districts approached their reforms have shaped the reform’s effectiveness.
Results
The Partnership Model’s Estimated Effects on Student Outcomes
We show that the Partnership Model improved student outcomes in Partnership schools overall, although these effects varied by cohort, subject, and year. We also find evidence that Partnership had positive effects on other low-performing schools in Partnership districts, as suggested by the Partnership Model’s theory of change. In both cohorts, these effects are larger when excluding students in non-Partnership schools in Partnership districts from the comparison group, pointing to possible positive effects of the district-level intervention components. We also find smaller but positive effects for students in near-selected schools in Partnership districts, providing additional evidence for district-level effects across low-performing schools in Partnership districts. In addition, Partnership effects are larger for low-achieving students.
Full Sample
Cohort 1
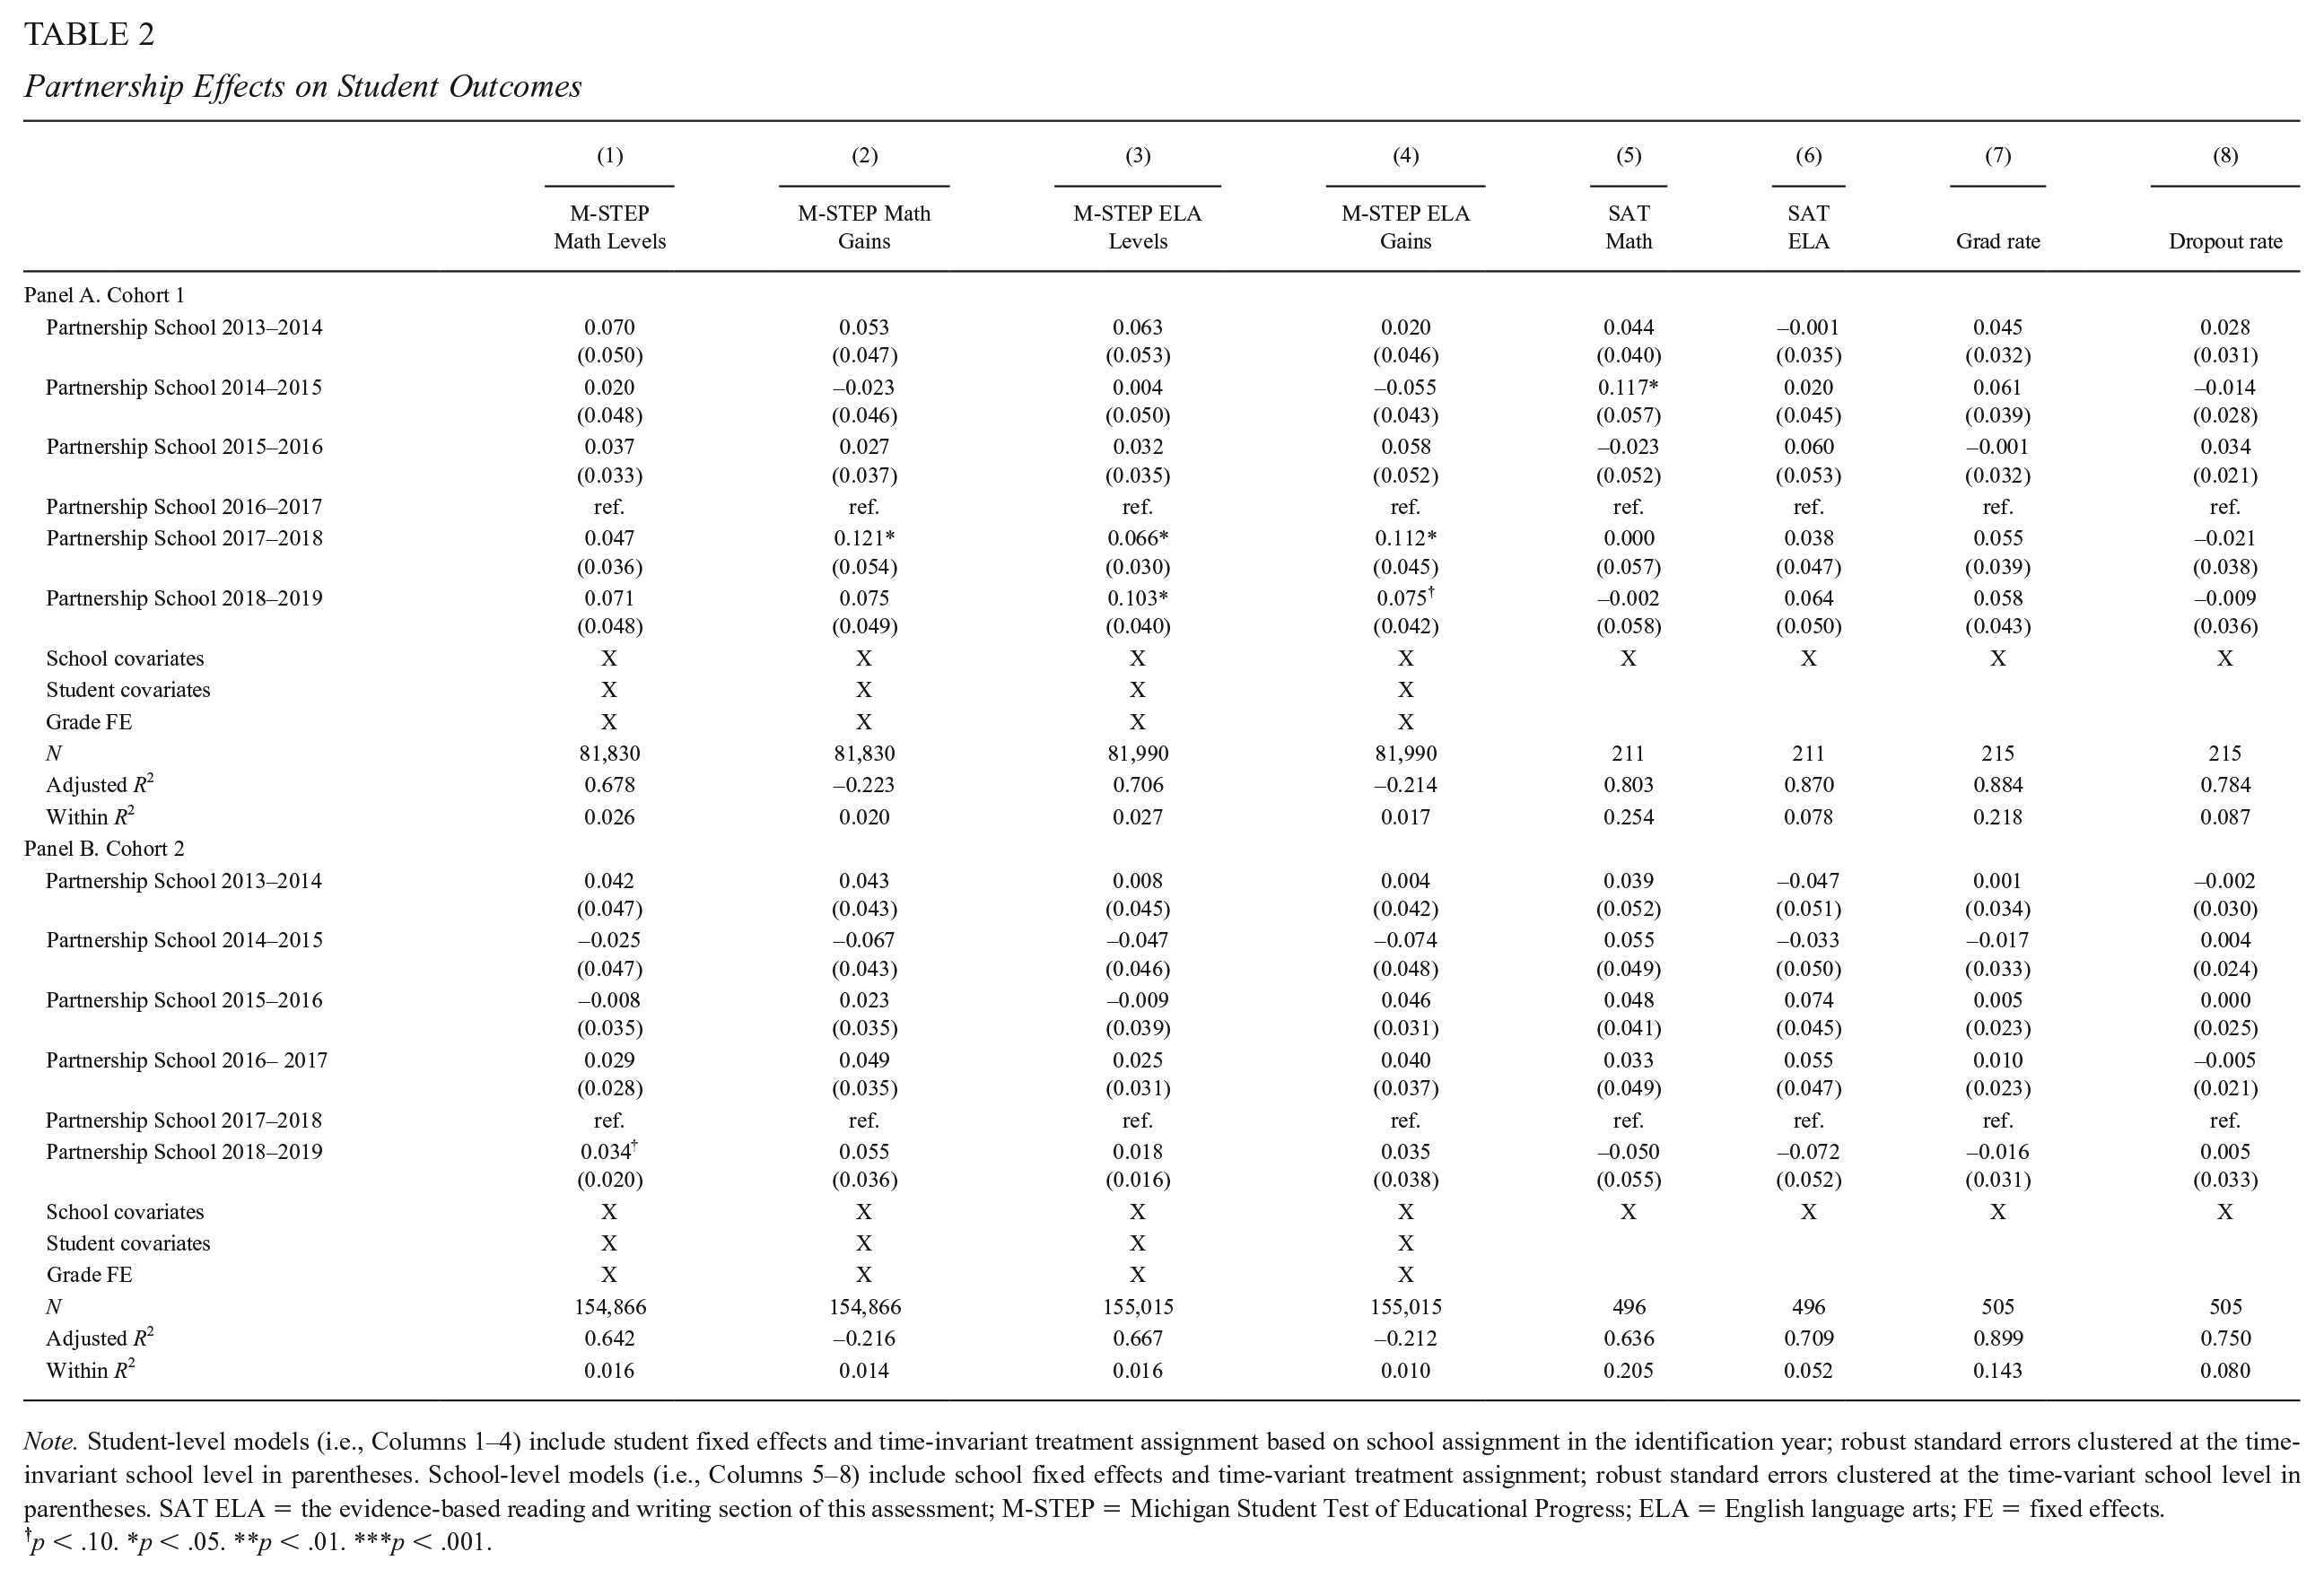
Table 2 provides the effect estimates from our main event study models. For Cohort 1, we find evidence that Partnership led to increased student achievement in both math and ELA in the first year of implementation, with the ELA effects continuing into the second year. We provide results from the Cohort 1 event study models in Panel A of Table 2 and the top row of Figure 2. Columns 1 to 8 of Table 2 show results for each outcome, and the rows provide coefficients for the Partnership × Year interaction term in our event study model, which estimates the difference between our treatment and comparison groups, relative to the year of Partnership identification, in each year. We interpret the coefficients for the years after Partnership identification as the causal effect of Partnership on the relevant outcome and use the coefficients for the years leading up to Partnership identification to test the assumption of parallel trends between these groups prior to their selection for Partnership. For Cohort 1, we observe outcomes for 2 years of treatment: the 2017–2018 and 2018–2019 school years.
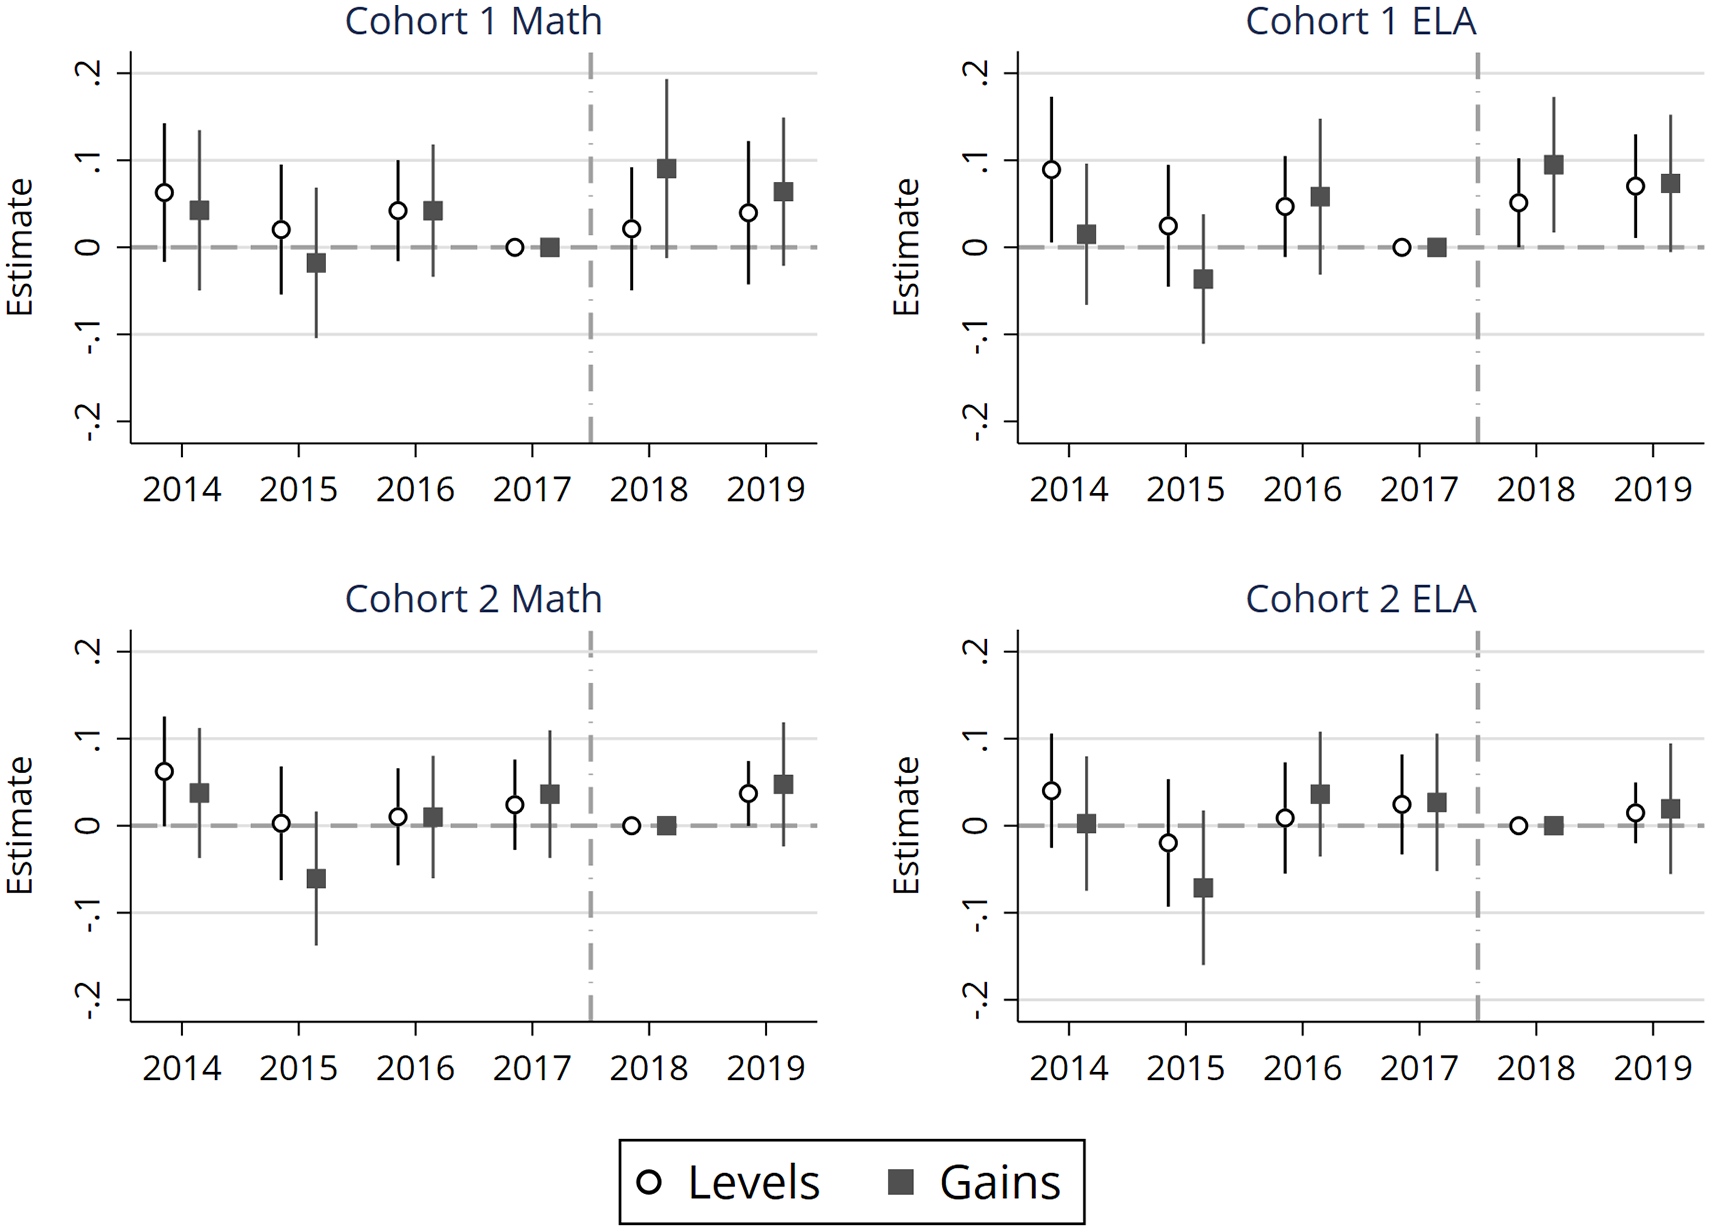
Event study estimates by subject and cohort.
Columns 1–2 and 3–4 provide the levels and gains models for Grade 4 to 8 math and ELA, respectively, which should bound the true effect of Partnership in the years after identification (Imberman, 2010). Here, significant estimates in either the gains or levels specification is suggestive of a significant effect, while significant estimates for both specifications provide stronger evidence. 11 Coefficients for the years leading up to Partnership identification, which are also illustrated in Figure 2, are generally small and none are statistically significant, which supports the assumption of conditional parallel trends. Columns 1 and 2 suggest math improvements in Grades 4 to 8 of 0.047 to 0.121 standard deviations in 2017–2018, although the estimate on the lower bound is not statistically significant. In 2018–2019, we see descriptively positive but insignificant estimates of 0.071 to 0.075 standard deviations. Columns 3 and 4 show that fourth- through eighth-grade students in Partnership schools experienced significant and sustained achievement gains in ELA in the first 2 years of Partnership. In the first year of implementation (2017–2018), the ELA achievement of students in Partnership schools improved by between 0.066 and 0.112 standard deviations. Improvements continued into 2018–2019, when students assigned to Partnership performed by between 0.075 and 0.103 standard deviations higher relative to comparison students. We do not find evidence in our school-level models of significant improvements in SAT scores (Columns 5 and 6), graduation (Column 7), or dropout (Column 8).
Cohort 2
We find little evidence in our main models, shown in Panel B of Table 2 and the second row of Figure 2, that Partnership impacted the Cohort 2 student and school outcomes under study. Only 1 year of post-Partnership outcomes are available for Cohort 2 as this group of schools was identified for treatment in the 2017–2018 school year and began implementing their respective Partnership Agreement in the 2018–2019 school year. Here, too, estimates for the years prior to Partnership identification are, overall, small and none are significant.
Columns 1 to 4 show that the coefficient estimates for Grade 4 to 8 math and reading are positive, but none are significant at conventional levels. Estimates for school-level SAT scores, graduation rate, and dropout rate, shown in Columns 5 to 8, are highly imprecise. Together, these results suggest that the Partnership Model was more effective in improving Grade 4 to 8 student achievement in Cohort 1 than Cohort 2, and had no effect on SAT achievement, on-time high school graduation, and dropout. Supplemental analyses provide some evidence of small positive effects in Grade 4 to 8 math and ELA in Round 2 but not Round 3 schools (Supplemental Appendix Table A-6 in the online version of the journal). 12
Robustness tests
We test the robustness of these findings in several ways. For both cohorts, our estimates are qualitatively similar, though less precise, when we move the reference year back to the year prior to identification (see Supplemental Appendix Table A-7 in the online version of the journal). Results are also similar using the “all starters” approach—though somewhat larger and generally more precise. These results (Supplemental Appendix Table A-8 in the online version of the journal) provide some evidence that Partnership did not induce transfers out by the highest performing students. We find similar effects using baseline rather than time-varying covariates (Supplemental Appendix Table A-9 in the online version of the journal) and can make similar inferences when we cluster standard errors at the district rather than school level (Supplemental Appendix Table A-10 in the online version of the journal).
The Effect of Partnership on Other Low-Performing Schools in Partnership Districts
Using the full sample of Partnership and comparison schools may lead to downward-biased estimates if the intervention leads to improvements in Partnership districts’ operations that enable them to more effectively support all of their schools and not just those identified for Partnership. We therefore present a set of estimates in which the treatment group includes all students in Partnership schools and the comparison group includes only students in schools within districts never identified for Partnership. Using this sample, estimates for Grade 4 to 8 math and ELA are both larger in magnitude and more precise for both cohorts of Partnership schools.
The left panel of Table 3 presents these results for Cohort 1 Partnership schools. We find that student math achievement increased by 0.087 to 0.174 standard deviations after the first year of Partnership implementation and by 0.123 to 0.124 standard deviations after the second, with each estimate significant at the p < .05 level. Estimates for ELA range from 0.092 to 0.137 standard deviations after the first year of Partnership and 0.10 to 0.133 standard deviations after the second, all significant at the p < .05 level. These estimates are meaningfully larger in magnitude, especially in math, and more significant when compared with our estimates from the full sample.
Partnership Effects on Student Achievement in Grades 4-8, Non-Partnership Schools in Partnership Districts Removed From the Comparison Group
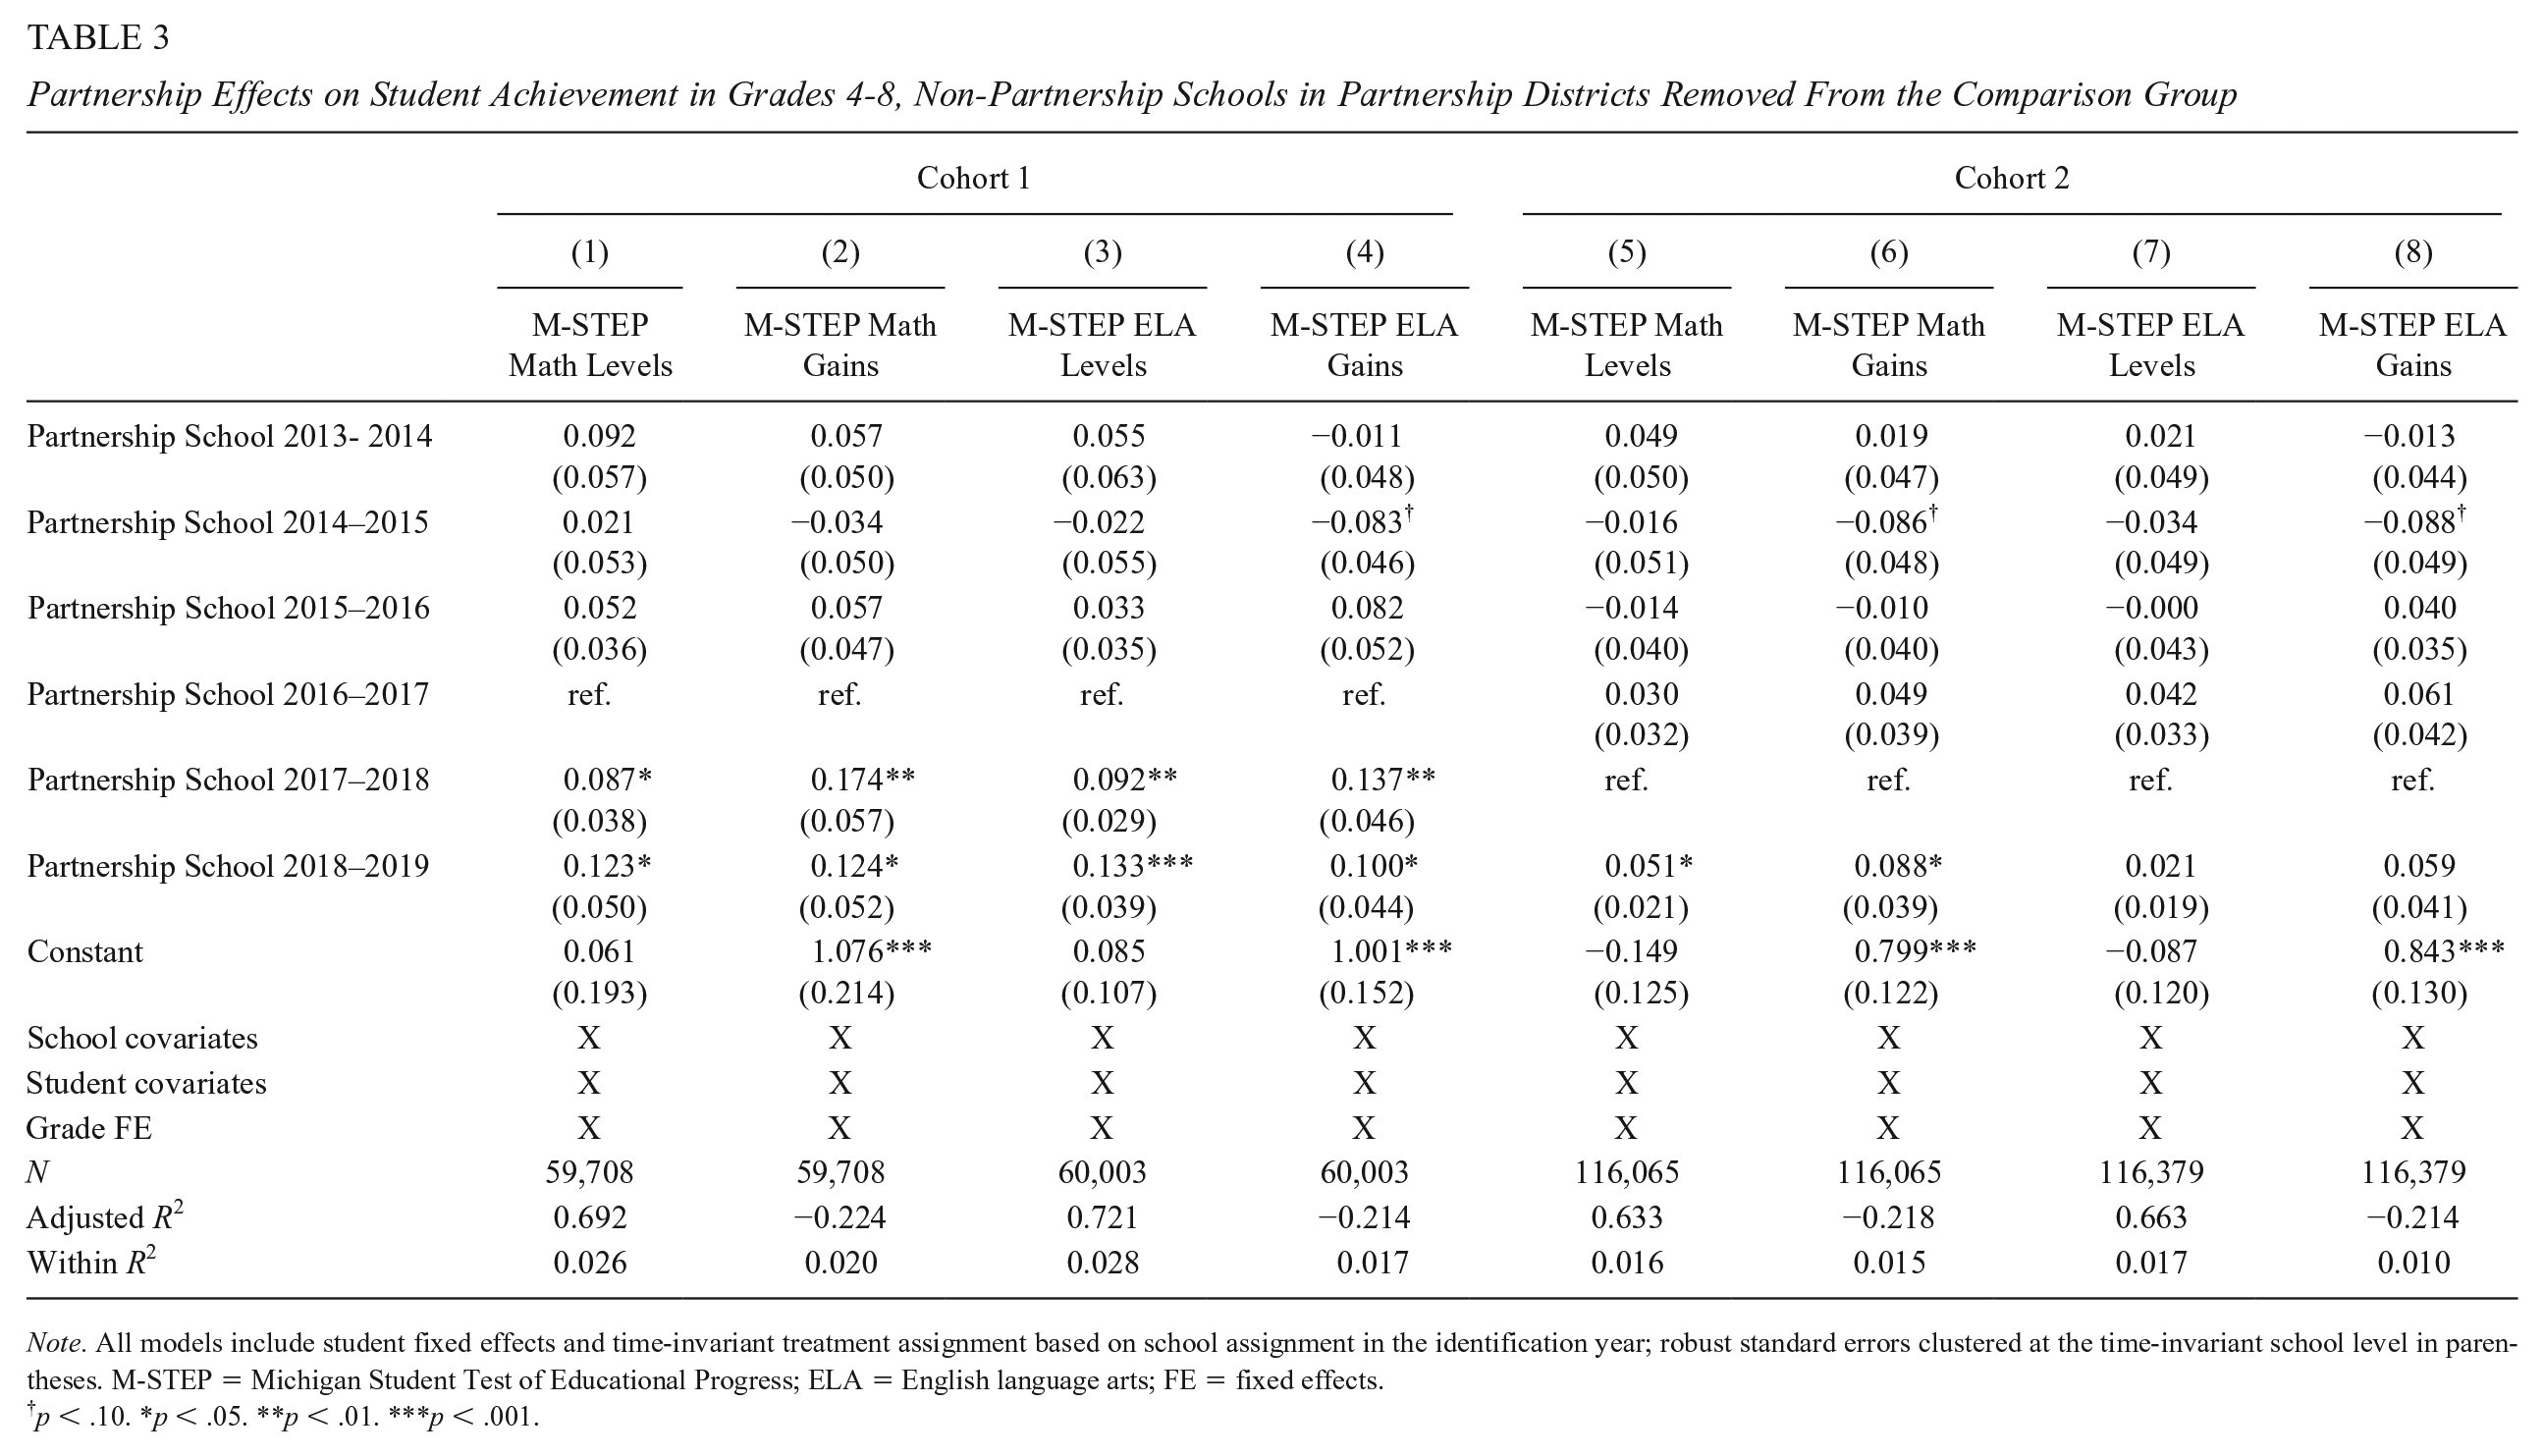
Note. All models include student fixed effects and time-invariant treatment assignment based on school assignment in the identification year; robust standard errors clustered at the time-invariant school level in parentheses. M-STEP = Michigan Student Test of Educational Progress; ELA = English language arts; FE = fixed effects.
p < .10. *p < .05. **p < .01. ***p < .001.
Results for Cohort 2 Partnership schools are shown in the right panel of Table 3. Here, too, estimates for M-STEP ELA and math are larger than the corresponding estimates when using the full sample. In math, student achievement improved by 0.051 to 0.088 standard deviations, both significant at conventional levels. ELA estimates are likewise larger in magnitude using this sample, at 0.021 to 0.059 standard deviations, but imprecise. For the other outcomes of SAT math and ELA achievement, graduation rate, and dropout (not shown here), estimates are similar to the main specification and not significant. These results show that the Partnership model has stronger effects when students in identified Partnership schools are compared with students in schools that were neither directly nor indirectly impacted by Partnership. Consistent with the Partnership Model’s theory of change, Partnership may have district-level effects that benefit students in other low-performing schools, thus attenuating estimates in our main models.
Next, we answer this question more directly by estimating the effects of being in a low-performing school in a Partnership district in addition to the effects of being in a Partnership school. In both cohorts, we find effects in Grade 4 to 8 math in near-selected Partnership district schools that are statistically significant and similar in magnitude to the effects on Partnership schools (Supplemental Appendix Table A-11 in the online version of the journal). Although we find positive and significant effects in ELA for Cohort 1 Partnership schools, we do not detect ELA effects for near-selected Partnership district schools in either cohort. Thus, consistent with the Partnership Model’s theory of change, enhanced district-level systems may have driven improvements not just in Partnership schools but also in other low-performing schools in Partnership districts. It is also possible that Partnership districts allocated resources and/or directed efforts to Partnership schools as well as other low-performing schools. We explore these possibilities in the section below where we discuss how Partnership district leaders approached the strategic planning element of the Partnership Model.
Partnership Effects by Prior Achievement
Table 4 provides estimates for Grade 4 to 8 math and ELA achievement by prior achievement, with Cohort 1 in Panel A and Cohort 2 in Panel B. Columns 1 to 2 of Panel A show that Cohort 1 students in the bottom quartile of achievement improved math scores by 0.092 to 0.183 standard deviations in the first year, with both estimates being significant, and 0.096 to 0.126 standard deviations in the second year, although only the upper bound is significant. Estimates for students in the top three quartiles (Columns 3 and 4) are descriptively positive but insignificant. Estimates for bottom quartile students in ELA are 0.102 to 0.195 standard deviations in Year 1 and 0.079 to 0.093 standard deviations in the second year (Columns 5 and 6). However, the Partnership × 2015–2016 term for this sample (also in Columns 5 and 6) is also positive and significant, indicating that the positive estimates for low-achieving students in ELA may in part stem from mean regression following an identification year dip for these students—although the estimates are descriptively larger in the first year of implementation and sustain into the second year. In ELA, we also find some evidence that comparatively high-achieving students experienced achievement gains following Partnership identification—although these estimates are less consistent. As shown in Columns 7 and 8, estimates range from 0.051 to 0.087 standard deviations in Year 1 and 0.07 to 0.102 standard deviations in Year 2, with the upper bounds of those estimates significant at the p < .10 and p < .05 levels, respectively.
Grade 4 to 8 Math and ELA Achievement by Lagged Performance

Note. Prior achievement measured in identification year. All models include school, student, and grade fixed effects. Bottom quartile (Columns 1–2 and 5–6) are those in the bottom quartile of their school in the identification year. Top 3 (Columns 3–4 and 7–8) quartiles are those above the 25th percentile of their school in the identification year. Note the sample is smaller than the main sample because to be in this sample, students need to have an M-STEP score in the identification year. M-STEP = Michigan Student Test of Educational Progress; ELA = English language arts; FE = fixed effects.
p < .10. *p < .05. **p < .01. ***p < .001.
Panel B provides these estimates for Cohort 2. The significant positive estimates on the Partnership × 2016–2017 indicator (i.e., the year prior to identification) point to an identification year dip for the lowest achievers in math. We thus interpret these findings with caution. Following that dip, we find that estimates for low-achieving students in math, shown in Columns 1 and 2, rebounded to preidentification levels (Column 1) and were descriptively higher than preidentification gains (Column 2). Columns 5 and 6 of Table 4 show that ELA achievement for low-achieving students increased by 0.054 to 0.073 standard deviations. Collectively, these results suggest that Partnership was particularly beneficial for the lowest achieving students in Partnership schools, with gains in math and ELA evident in both cohorts, and that the overall effects of Partnership are driven by improvement in this group.
How Did Partnership Implementation Contribute to Outcomes?
In this section, we draw on our interview and survey data to explore how Partnership districts’ implementation of the Partnership Model contributed to the policy’s positive effects on ELA and math achievement in Grades 4 to 8. The Partnership Model’s theory of change posits several mechanisms through which the policy facilitates improvement in low-performing schools. Our study of Partnership implementation identifies four such mechanisms that shaped these positive outcomes: strategic planning, external supports, the threat of accountability, and improving human capital.
Strategic Planning
Consistent with the theory of change held by the Partnership Model and similar ESSA-based turnaround reforms, we find that the strategic planning component of Partnership helped leaders align their ongoing and new improvement initiatives. For the most part, Partnership districts used the required strategic planning as an opportunity either to connect their previous reform efforts to their Partnership-driven reforms or to adopt new interventions they deemed necessary for improvement. For those who used the Agreement as a way to focus on intervention strategies already in place, many drew on already-existing strategic plans. However, this does not mean that these districts’ approach toward their Partnership Agreement was purely performative. A number of leaders framed the development of their Agreement as a transition in their ongoing work around school improvement. For instance, the superintendent of Avalanche recalled that their Partnership Agreement tied together three strands of ongoing work in the district:
That was really a culmination of—or a combination of what the ISD had already put in place, what we were already developing in terms of our own capacity, and then what we’ve realized we needed additional capacity and based on the MI Excel Blueprint [an improvement model focused on building school- and district-level systems]. I would say as far as the writing of that [the Partnership Agreement], it really came from those three places.
Speaking to the coherence that came about from aligning ongoing work with newly realized needs, they later said that it “really has given us more of a language for work we needed to get done here.” This example shows how Partnership district leaders used the flexible nature of the Partnership Model to design an improvement plan around their vision of reform.
In executing their strategic plan, some leaders focused primarily on improving their Partnership schools, whereas others sought to make changes that were broader in scope, but that still centered their Partnership schools. Some district leaders shared how they differentiated efforts between Partnership and non-Partnership schools. For example, the leader of Canadiens said,
I mean, the work with the Partnership schools, I would say—on the surface, one would say, “Well, a lot of the schools face the same issues as the Partnership schools.” I would generally agree with that. [. . .] There are similarities in challenges, but there—in this past year, I’ve even seen that the Partnership schools have more pronounced issues. Some of the issues that are common across schools are more complex and deeper problems in our Partnership schools . . .
As a result, the superintendent of Canadiens focused their efforts more intently on their Partnership schools. Describing a broader approach to their reform, Bruins’ superintendent indicated that several of their Partnership Agreement process goals included district-wide initiatives, but that they focused first on implementing these new programs in Partnership schools “more intensely” than other schools. For example, their new writing curriculum was phased in across grade levels over time across the district, but in their Partnership schools “we did it all-all grade levels right away.” These examples show how districts approached Partnership reforms with a concentration on Partnership schools, but without necessarily excluding non-Partnership schools in their efforts, which may contribute to the positive effects we observe in low-performing, non-Partnership schools (see Supplemental Appendix Table A-11 in the online version of the journal).
External Supports: Technical Assistance and Funding
Providing supports to build capacity for improvement is a central theme of the Partnership Model’s theory of change. External supports provided through the Partnership Model in the form of technical assistance and increased financial resources helped Partnership district leaders develop and implement their Partnership Agreement. Technical assistance was most often provided by the Office of Partnership Districts (OPD) at MDE to assist districts with the planning and implementation of their Partnership Agreement. The Partnership district’s ISD also provided technical assistance, with a focus on supporting reforms and initiatives at the school level. Financial support for Partnership districts came in the form of 21H, a grant administered by OPD to provide funding for Partnership districts’ turnaround efforts. Our qualitative data suggest that both technical assistance and monetary supports were important for Partnership districts in the design and implementation of their turnaround efforts.
Technical support from OPD is primarily provided by PALs, who were assigned to work with specific Partnership districts to serve as a link between the districts and MDE, smoothing the way for districts to gain access to needed information and supports. We find that Partnership leaders believed OPD and their PALs to be a helpful thought partner in their reform. For the most part, Partnership district leaders gave positive reports of the liaisons. For instance, the superintendent of Oilers described the support they received from their liaison as helping them to refine their plans around instruction:
. . . our first liaison really helped us dig into, again, what M-STEP is because that’s what our index score is based on [. . .] We’re able to look at those standards and then see with our own curriculum map, “Are we spending a lot of time on things that are measured on that assessment or not?”
In other cases, early on in Partnership implementation, the liaison was not particularly helpful. One district leader told us in the first year of interviews that the liaison “. . . wasn’t proactive. It was more a reactive thing.” Over time OPD made efforts to standardize the role of liaisons in their work with Partnership districts, positioning them as brokers between MDE/OPD and local stakeholders. Partnership district leaders responded positively to this shift, with 21 of the 22 we interviewed in the second year of the study perceiving their liaison as helpful in this new role.
ISDs supported Partnership Agreement implementation by providing services such as professional development, curriculum support, and coaching, among others, to educators in Partnership schools. In interviews, approximately two-thirds of Partnership superintendents spoke favorably of the supports they received from their ISD. For example, the superintendent of Flames noted how their ISD provided direct support for their teachers and leaders:
. . . they’ve been very supportive in providing professional development, even funding and some supplies and everything to our teachers and teaching staff and even to the administrators at the school to assist them throughout the process. They’ve had PDs [professional developments] on learning and for the principal and vice principals. It’s really getting to those core issues that were lacking before. It’s really helping them.
In another instance, the leader of Black Hawks described the support they received around curriculum from their ISD: “From [ISD], the partners who have been allocated for our building have done a phenomenal job at aligning the curriculum, [so that it] also helps us to meet the social and emotional needs of our children.”
Additional financial support for Partnership schools comes from the 21H grant, which is appropriated by the state legislature and administered by OPD to support school turnaround. Monies from 21H can be used for a range of purposes to help Partnership districts implement the initiatives they feel are best aligned with the needs of their Partnership schools. Many Partnership superintendents spoke positively of the 21H funding; in the second year of the study, 19 of 22 superintendents interviewed reflected this view. Moreover, Partnership leaders noted that it was not just the money itself—which for many larger districts was only “a drop in the bucket”—but the flexibility given to them in how they could spend these relatively unrestricted dollars. On this theme, the superintendent of Flyers said, “We’ve been able to execute some of the strategies because of funding that we’ve received through 21H.” They also reported,
. . . it has definitely been a resource that has allowed us to move forward with some strategies that again, we’ve had our sights set on, but didn’t have necessarily a way to make it come to fruition because there just wasn’t funding available behind it in the school’s budget.
Across both years of data collection, superintendents mentioned using 21H funding to provide trainings for their staff, purchase new curricula, and create staff positions to support their turnaround work. For instance, through this funding the superintendent of Hurricanes “created three positions that were a direct correlation to the issues that we identified in our plan. . . a reading interventionist, a math interventionist, and an attendance liaison” and the superintendent of Black Hawks elected to provide trainings as a way of building capacity in the district, saying, “Our hope is that those practices that the training allowed will continue.” These examples show that the latitude given to districts in how this grant funding is spent has allowed them to be strategic by investing in programs and practices aligned with their Partnership Agreement.
Although superintendents overwhelmingly perceived grant funding from MDE to be helpful, a common refrain among Partnership superintendents in both years was that this additional funding was not sufficient to fully implement their vision for turnaround or to meet the needs of their district. The superintendent of Islanders explained that their grant was “. . . nothing when you’re talking about doing programming. That’s a year’s programming. You’re talking about substantial growth for kids who have five to six years of deficit. It doesn’t work that way.” Superintendents often framed these unmet needs in terms of the drastic reforms needed to turn around their Partnership schools, such as the superintendent of Stars, who said that their funding was merely “a drop in the bucket.” Put simply, Partnership district leaders appreciated the opportunities afforded to them by grant support but noted that more was needed if they were to bring about dramatic reform and improvement.
The Threat of Accountability
Although the focus of the Partnership Model is on providing supports to improve student outcomes in low-performing schools and districts, it creates pressure for schools to improve by requiring Partnership Agreements to include next-level accountability (NLA) measures to be implemented if a school’s 36-month improvement goals are not met. We find that the threat of accountability is salient for educators in Partnership schools and that district leaders have used the threat of NLA to build momentum for their reform agenda.
Table 5 compares teachers’ perceptions of school accountability if their school’s improvement goals are not met between teachers who work in Partnership and non-Partnership schools. Comparisons using nonresponse weights are very similar and are provided in Supplemental Appendix Table A-12 (in the online version of the journal). Teachers working in Partnership schools have a much stronger sense of accountability than teachers who work in non-Partnership schools, and this difference is significant at the p < .001 level. Some items that make up this school accountability composite score illuminate teachers’ perceptions around accountability for failing to improve. For instance, teachers in Partnership schools, compared with teachers in non-Partnership schools, see it as much more likely that their school leader or other staff will be removed if their school does not meet its improvement goals (see Supplemental Appendix Figure A1 in the online version of the journal). This suggests that teachers in Partnership schools see the threat of NLA as real, which may motivate them to more fully support their school’s improvement efforts.
Teachers’ Perceptions in Partnership Schools and Non-Partnership Schools in Partnership Districts.

Note. Factor scores are based on responses from when teachers were in the first year of their school’s Partnership reform.
p < .10. *p < .05. **p < .01. ***p < .001.
Partnership teachers’ heightened perception of accountability likely comes at least in part from the messaging they received around Partnership from their school and district leadership. In interviews, multiple leaders reported using their Partnership status to build a sense of urgency for their reform agenda and used this to enact changes that otherwise would have been more challenging. Describing a debate within the district over when to implement a new reading program, the superintendent of Blues used their Partnership status to push for more immediate action, noting, “How do we help the teachers feel this urgency? That’s where I think the power of the Partnership can come in if you capitalize on it, like, look [we’ve only got so much time].” Some leaders identified specific actions they were able to take using the urgency they built around their Partnership status, such as the superintendent of Penguins, who at one of their Partnership schools changed the grade configuration, replaced the principal, and also replaced a large share of the teachers. They noted that such drastic changes would normally be quite difficult, but that Partnership created a space to implement this change. Another Partnership district leader explained this strategy as “I would just say a leader knows how to use extra accountability as a lever for change and creating a sense of urgency.” They further elaborated,
Having come in knowing that these were the lowest performing schools, I’ve been able to, more over the last couple of years, use the Partnership Agreement as a lever to get a greater sense of urgency among the principal and teachers to say “We have to do things differently here. Why? Because we’re a Partnership school.”
These accounts illustrate how some Partnership district leaders used Partnership, and in particular the threat of high-stakes accountability, as a warrant to make changes that aligned with their vision for improvement in identified schools.
Improving Human Capital
Consistent with earlier research on school turnaround (Harbatkin, 2022; Heissel & Ladd, 2018; Henry et al., 2020; Strunk, Marsh, Hashim, et al., 2016; Zimmer et al., 2017), the Partnership Model’s theory of change recognizes human capital as a key driver of improvement in turnaround schools. There are two important elements of human capital to consider—effective school leaders (Aladjem et al., 2010; Hitt et al., 2018) and high-quality teachers (Henry & Harbatkin, 2020; Henry et al., 2020; Pham, 2022). We find that Partnership districts had mixed success in improving human capital in their Partnership schools across these two categories. Overall, it appears that Partnership districts were able to bring in more effective principals to lead Partnership schools. However, while some leaders reported improvements in their ability to attract and retain teachers in Partnership schools compared with prior years, they still cited maintaining a supply of high-quality teachers as among their most significant challenges.
In our interviews, Partnership district leaders noted some areas of concern around their leaders but identified principals as key players in their reforms. Speaking about some of the specific challenges in their Partnership schools, the superintendent of Canadiens lamented that many of their leaders were not well-equipped to drive instructional change, saying,
I think a lot of our Partnership principals are not instructional leaders, defined as individuals that know how to recruit, retain teachers, know how to give constant feedback to teachers, can problem-solve with teachers, and create a culture of instructional focus where the principal is truly the instructional leader. Can go in as a generalist in specific content areas, provide feedback on how to improve instruction, can lead professional development, can analyze data, and really have credibility with teachers to improve practice.
Acknowledging issues with leadership, several Partnership district leaders replaced principals to create an environment more conducive to growth and improvement. The superintendent of Penguins, for example, strategically selected a principal from another school to lead a Partnership school and anchored their reforms there around this new leadership, saying,
That school has been a pain in the whatever of anybody who’s been sitting in this chair, because it just has been a mess. I mean a total mess. No buy in or whatever. [. . .] We turn it over to this new principal—not new but [principal name], and we say, “Go for it.” [. . . ] and it’s like the sun has risen on that place. It’s a new environment, it’s a new place, different staff, kids are happy, not a peep out them, community is happy.
Teachers in Partnership schools seemed to understand district leaders’ efforts to improve the quality of leadership in their schools. Table 5 shows that, on average, teachers in Partnership schools gave their principals significantly higher ratings than teachers in non-Partnership schools, although this difference is not significant when using weighted responses (see Supplemental Appendix Table A-12 in the online version of the journal). Within this construct, Partnership teachers gave their principals significantly higher ratings for facilitating and encouraging professional development (see Supplemental Appendix Figure A1 in the online version of the journal). This suggests that the types of efforts by district leaders noted above improved leadership quality in their Partnership schools, which in turn served as a catalyst for positive change.
Some district leaders cited improvements in their ability to recruit and retain teachers relative to prior years, which could help explain some of the academic growth in Partnership schools. For example, the leader of Senators noted they had “increased the number of certified teachers [in Partnership schools].” The Avalanche leader said they were able to use funds from Partnership to improve their hiring process, which increased the fit between candidates and Partnership schools. The Ducks superintendent said, “we’ve seen some improvement in recruitment and retention.” Others were able to use modest financial incentives to help stabilize staffing, and the leader of Flyers explained that they were able to change “job descriptions to attract a different level of talent.” Despite these perceived improvements, these and other leaders still felt greater staffing challenges in their Partnership schools compared with other schools.
These improvements in staffing are best characterized as making the problem somewhat less acute; retaining and developing high-quality teachers in Partnership schools remained a significant challenge for most. Partnership schools experience much greater teacher turnover than other schools and struggle to replace them with the high-quality teachers they believe are necessary for their reforms, which hampered their efforts to improve instruction. In fact, 23% to 29% of teachers exit Partnership schools each year, roughly twice the statewide average, a trend that predated Partnership and persisted into the years of Partnership implementation (authors’ calculation, 2021). It is perhaps unsurprising then that, as Table 5 shows, teachers in Partnership schools give their school lower ratings for staffing (robust to using survey weights, see Supplemental Appendix Table A-12 in the online version of the journal). Within this construct, teachers in Partnership schools gave their schools particularly low marks for teacher retention (Supplemental Appendix Figure A1 in the online version of the journal). Moreover, leaders reported significant challenges in attracting the high-quality educators they need, and sometimes challenges even in attracting educators with basic credentials. The superintendent of Devils noted,
For every opening, you used to get 40 applicants, ten of whom were very hirable, five of whom were probably great. I’m talking up ‘till five about five years ago. Now, you are lucky to get one (applicant), extremely lucky to get two or three, and incredibly lucky if one of them is really a hirable candidate.
Of the 22 Partnership district leaders interviewed in the second year of data collection, 20 raised the supply of teachers as a concern in their turnaround work, which complicated Partnership districts’ efforts to reform the instructional core of their Partnership schools.
Issues around teacher recruitment and retention made it more challenging for Partnership schools to implement their Partnership Agreement by making it difficult to build momentum around instructional reform. Recalling that turnover forced their district to keep “starting over,” the superintendent of Flyers described,
We’ve been unable to have one program model implemented more than one year due to turnover in either leadership and/or teachers. High-quality certified teachers is another very large obstacle that we continue to face. In a building with 19 total teachers, four of them are certified teachers, so we have a serious shortage in the availability of certified teachers. [. . .] There’s the consistency issue, which prevents the model from being able to really take hold, and then there’s the lack of talent.
In addition to the challenge of sustaining reform in the face of turnover, this quote refers to a reliance on teachers who are less qualified, and in some cases not certified. Although it was not typical for a majority of teachers in Partnership schools to be noncertified, in the first year of our Partnership superintendent interviews, one third described using long-term substitute teachers to fill teaching positions in their Partnership school(s). These examples highlight the challenges of successfully implementing a turnaround plan in the face of instability among the teaching staff and suggest that Partnership may have been more effective if Partnership schools had greater access to certified and effective teachers.
Discussion and Implications
This study is the first to examine a statewide school turnaround policy, Michigan’s Partnership Model, under ESSA. Overall, we find that students in both cohorts of Partnership schools experienced achievement gains in Grade 4 to 8 math and that students in the first cohort of Partnership schools also saw gains in ELA. We also find evidence of district-level effects in other low-performing Partnership district schools, consistent with the Partnership Model’s theory of change that aims to improve outcomes in Partnership districts more broadly. Moreover, the Model’s positive achievement effects are driven by gains among the lowest achieving students in Partnership schools. In this way, Partnership compares favorably with recent turnaround efforts, which find positive but smaller effects (Redding & Nguyen, 2020; Schueler et al., 2021), and with earlier turnaround efforts in Michigan under NCLB waivers, which found null or negative effects (Hemelt & Jacob, 2017, 2018). In addition, Partnership produced much more positive effects than the generally negative impacts of Michigan’s earlier school closures (Brummet, 2014)—the initially proposed treatment for Michigan’s lowest performing schools. These findings may somewhat alleviate early concerns that the reduced federal footprint and flexibility within ESSA would allow states to be less ambitious in turning around their low-performing schools (for a summary of concerns, see Egalite et al., 2017). Unfortunately, due to the COVID-19 pandemic, we are not able to observe outcomes for students in Partnership schools several years into implementation, when a growing body of recent evidence suggests that effects are most evident (e.g., Peurach & Neumerski, 2015; Redding & Nguyen, 2020; Sun et al., 2017).
At the same time, we do not find evidence that Partnership improved outcomes for students in Partnership high schools in terms of SAT achievement, graduation, or dropout. While this may be because the Partnership Model had no effect on high schools, other factors may contribute to these null results. One is that the comparatively small number of high schools in our sample means that our school-level analyses lack sufficient statistical power to detect an effect. Second, as the majority of Partnership schools served students in the elementary and middle school grades, Partnership districts may have placed most of their focus on those schools, leaving fewer resources to support improvement in their high schools. Finally, because SAT achievement and graduation/dropout rely on experiences students have throughout high school, it may take more than 1 or 2 years to observe improvement in these outcomes.
Given that evaluations of recent turnaround efforts find variation both across and within contexts, it is vital to understand the elements of turnaround policies that are most conducive to improvement in student outcomes so that successes can be replicated. This is especially critical given that ESSA provides states and districts significant leeway in how they turn around their low-performing schools, which may allow them to adapt to emerging evidence on effective turnaround. Drawing on our qualitative and survey data, this study contributes to the literature on school turnaround by identifying factors that helped Partnership schools and districts move the needle on student outcomes. First, the supports provided through the Partnership Model helped districts tailor their reforms and strategies to the needs of their identified Partnership schools. Partnership district leaders gave positive reports of the assistance they received from their liaison at MDE/OPD, citing examples where their liaison provided support for data analysis and connected leaders with state-level resources. Partnership districts also linked support from their ISD, in areas such as professional development and curriculum consulting, with successful implementation of their Partnership Agreements. This adds to the existing evidence that technical assistance for low-performing schools supports achievement gains, especially for disadvantaged students (see, for example, Strunk & McEachin, 2014). Financial support also helped Partnership districts implement the strategies they felt were important for successful turnaround. However, district leaders simultaneously noted that far more money was needed to help Partnership schools and districts implement the kinds of reforms that might make the largest difference in outcomes—in particular improving teacher and leader recruitment and retention.
Second, Partnership district leaders leveraged the planning and accountability elements of the Partnership Model to bring about the change they felt was needed to move their Partnership schools forward. For instance, we found that, as in other studies of turnaround reforms (e.g., Meyers & Hitt, 2018; Strunk, Marsh, Bush-Mecenas, & Duque, 2016; Sun et al., 2017), the requirement to develop an improvement plan and engage in strategic planning was critical to reform success as leaders used the planning process to align existing initiatives and integrate new reforms into their work. Given the centrality of planning in the ESSA model, this bodes well for the potential success of ESSA-induced whole-school reforms.
Third, staffing Partnership schools with skilled school leaders who were a good fit for their district’s reform agenda was important for successful turnaround. Partnership district leaders were intentional about the principals they selected to lead their Partnership schools and teachers in Partnership schools reported high-quality leadership than teachers in other schools within Partnership districts. However, the recruitment and retention of teachers presented a significant challenge for Partnership districts, which is troubling given the documented importance of teachers for successful turnaround (see Redding & Nguyen, 2020; Strunk, Marsh, Hashim, et al., 2016; Zimmer et al., 2017). Partnership schools experience high rates of teacher exit, and leaders report resorting to less qualified teachers to fill teaching positions in them. Although we find that some district leaders were able to make relative improvements in teacher recruitment and retention, Partnership schools and districts overall struggled to substantially move the needle on staffing schools with qualified and high-quality teachers, which may help to explain why achievement gains were not larger or more consistent across cohorts.
Last, some Partnership leaders drew on the threat of NLA included in Partnership Agreements to bring about change by using it to build a sense of urgency for their reforms, which allowed them to take actions that may have been difficult in another context. This is interesting, especially as in the later years of the reform the MDE worked to shift the focus from accountability to support, which—as we note above—was found to be central to the success of the model. This suggests that retaining some version of NLA may still be important as a possibility should support and intervention be insufficient to help schools and districts improve in the longer term.
Together, the results from this study lead to four implications for policymakers and practitioners, in Michigan and more broadly across the country in light of ESSA’s focus on states taking the lead in school turnaround. First, ESSA requires that turnaround interventions be “evidence-based,” and the findings of this study add to the small but growing body of research on not just the effectiveness of school turnaround, but the factors that promote successful turnaround. The positive results we find for Cohort 1 schools indicate that policymakers should continue to support turnaround efforts in Partnership schools and districts, letting the reform play out and improve rather than turning whole-sale to a new improvement strategy. Partnership district leaders found the technical assistance and grant funding through the Partnership Model to be helpful in their turnaround efforts. In addition, leaders leveraged these resources in different ways that aligned with their vision of reform. This suggests that states should incorporate some degree of flexibility for schools and districts in how they approach reform.
Second, we argue that the stronger effects we find for Cohort 1, relative to Cohort 2, provides yet another data point that large-scale reforms require investments—in terms of both financial and in-kind resources. Partnership leaders reported that additional resources, such as grant funding to support Partnership districts’ implementation of their reforms and support from ISDs, helped their Partnership schools make progress toward their improvement goals. At the same time, the level of these supports remained relatively flat as new schools were identified. Cohort 2 consists of more than twice as many Partnership schools (82) as Cohort 1 (37). Moreover, more than half of Cohort 2 Partnership schools are in districts that operate Cohort 1 Partnership schools, which could have strained their capacity as they worked to implement improvement efforts across a larger number of schools. These factors may have limited the impact of Partnership and explain why we find smaller effects for Cohort 1 in the second year of implementation (which coincided with the first implementation year for Cohort 2) and smaller effects for Cohort 2 than Cohort 1. Importantly, providing additional funding for turnaround schools is one area where Michigan’s Partnership Model stands out from the requirements of ESSA, which does not provide or require additional resources for turnaround schools. It is therefore critical that states fund and support improvement efforts, ideally targeting additional resources to the areas identified in schools’ and districts’ needs assessments and strategic plans.
Third, the Partnership example highlights the need for human capital reforms in addition to instructional and operational changes. Without a sufficient supply of high-quality educators, it will be difficult for even the best laid plans to come to fruition, and schools will face greater challenges achieving their long-term improvement goals. Here, too, states have a crucial role as they are well positioned to enact policies and programs that (a) bolster the supply of qualified and high-quality educators and (b) create incentives for educators to work in turnaround schools and districts. Finally, while accountability receives much less emphasis under ESSA than previous generations of turnaround, states may wish to retain some element of accountability in their turnaround policies because savvy leaders can use the threat of accountability to bring about more rapid change.
Supplemental Material
sj-pdf-1-epa-10.3102_01623737221141415 – Supplemental material for The Efficacy and Implementation of Michigan’s Partnership Model of School and District Turnaround: Mixed-Methods Evidence From the First 2 Years of Reform Implementation
Supplemental material, sj-pdf-1-epa-10.3102_01623737221141415 for The Efficacy and Implementation of Michigan’s Partnership Model of School and District Turnaround: Mixed-Methods Evidence From the First 2 Years of Reform Implementation by Jason Burns, Erica Harbatkin, Katharine O. Strunk, Chris Torres, Aliyah Mcilwain and Sandy Frost Waldron in Educational Evaluation and Policy Analysis
Footnotes
Acknowledgements
We are grateful to the many people who gave their time in support of this work, including research participants, and those who provided technical and research support: Sheila Alles, Gloria Chapman, Dr. Paula Daniels, Dr. Venessa Keesler, Dan LaDue, Dr. William Pearson, Dr. Michael Rice, and the entire staff of the MDE Office of Partnership Districts; Trina Anderson, Rod Bernosky, Tom Howell, and Mike McGroarty from the Center for Educational Performance and Information (CEPI); and EPIC staff including Emily Hatch, Michelle Huhn, Chayse Hurley, Dr. Tara Kilbride, Emily Mohr, and Meg Turner.
Declaration of Conflicting Interests
The author(s) declared no potential conflicts of interest with respect to the research, authorship, and/or publication of this article.
Funding
The author(s) disclosed receipt of the following financial support for the research, authorship, and/or publication of this article: We would like to thank the funders of this research: Arnold Ventures, an anonymous foundation, the Michigan Department of Education (MDE), and Michigan State University’s College of Education. This research used data structured and maintained by the Michigan Education Research Institute (MERI)-Michigan Education Data Center (MEDC). MEDC data modified for analysis purposes using rules governed by MEDC are not identical to those data collected and maintained by the MDE and/or Michigan’s Center for Educational Performance and Information (CEPI). Results, information, and opinions represent the analysis, information, and opinions of the author(s) and are not endorsed by or reflect the views or positions of, grantors, MDE, CEPI, or any employee thereof. All errors are our own.

Notes
Authors
JASON BURNS, PhD, is an assistant professor of Educational Leadership, Management, and Policy at Seton Hall University. His research focuses on school turnaround, school accountability, and decision-making in education.
ERICA HARBATKIN, PhD, is an assistant professor of Education Policy and Evaluation at Florida State University. Her research focuses on school turnaround and improvement, low-performing schools, and teacher policy.
KATHARINE O. STRUNK, PhD, is the Clifford E. Erickson Distinguished Professor of Education Policy and, by courtesy, Economics at Michigan State University. She is also the director of the Education Policy Innovation Collaborative (EPIC). Her research focuses on working with state and district education agencies to effectively use data to inform and improve policy and practice, particularly focused on policies related to the educator workforce, accountability, and instruction.
CHRIS TORRES, PhD, is an associate professor of Educational Policy and Leadership at the University of Michigan. He studies urban and low-income school improvement efforts related to school choice, leadership, school turnaround, charter schools, and educator retention and turnover.
ALIYAH MCILWAIN, MA, is a PhD candidate at Michigan State University. Her research focuses on education policy and urban politics.
SANDY FROST WALDRON, MPA, is a research assistant and PhD candidate at Michigan State University College of Education. Her research focuses on the politics of education and stakeholders’ experiences with the policy process.
References
Supplementary Material
Please find the following supplemental material available below.
For Open Access articles published under a Creative Commons License, all supplemental material carries the same license as the article it is associated with.
For non-Open Access articles published, all supplemental material carries a non-exclusive license, and permission requests for re-use of supplemental material or any part of supplemental material shall be sent directly to the copyright owner as specified in the copyright notice associated with the article.
