



Abstract
We reported in a previous work that insulin degradation by insulin-degrading enzyme (IDE) was inhibited by ATP (Exp Biol Med 226:334–341, 2001). Then we studied ATP hydrolysis as a possible mechanism for reversion of this inhibition. ATP hydrolysis was determined by 32P release after hydrolysis of γ[32P]ATP. ATP hydrolysis was studied by Sephadex G200 chromatography, immunoprecipitation, and nondissociating gel electrophoresis. Purified recombinant rat IDE and extractive homogenous IDE showed similar ATP hydrolysis. All results showed concordance between insulin degradation and ATP hydrolysis, suggesting that IDE has both functions. In order to define the type of hydrolysis, we studied inhibitors of IDE, phosphohydrolases, and ATPases. Each substance studied had no effect on ATP hydrolysis, except 1 mM orthovanadate, a known inhibitor of ATPases, phosphatases, and insulin degradation. ATP hydrolysis followed a Michaelis-Menten kinetic with Vmax: 570.45 ± 113.08 pmol Pi/hr and apparent Michaelis constant (Km): 63.13 ± 3.48 μM. ATP binding studies strongly suggested an ATP binding site and enzyme kinetics established only one active hydrolytic ATP binding site per IDE molecule. ATP-induced enzyme aggregation changes as observed by electrophoresis mobility in nondissociating conditions and conformational changes on insulin binding as shown by IDE-insulin cross-linking. We conclude that IDEs have ATPase activity and that insulin-binding and degradation are dependent on ATP concentration; however, insulin does not modify the ATPase activity of IDE.
Introduction
Insulin-degrading enzyme (IDE) was first described by Mirsky as “insulinase” (1). The human sequence of IDE was published by Affholter et al. (2) and the carboxyterminal AKL sequence, which directs IDE to peroxisomes, was found in 1993 (3). Bennett et al. demonstrated that IDE-insulin complex regulates the proteasome activity and its cellular proteolysis (4), and Qiu et al. found that extracellular levels of β-amyloid peptide are regulated by IDE through degradation (5). The enzyme degrades not only insulin and glucagon but also insulin-like growth factors I and II, the leader peptide of peroxysomal thiolase (6), transforming growth factor α and other peptides (reviewed in Ref. 7). Cleavage site studies pointed out that substrate recognition by IDE would more likely depend on the tertiary peptide conformation rather than on the amino acid sequence, and it has been suggested that amyloid proteins are IDE substrates (8).
This broad protease activity observed in vitro is restricted when the studies are performed in vivo. IDE hypofunction in vivo produces an increment of insulin levels. For example, the increment of insulin by allele mutation of IDE in Goto-Kakizaki (GK) rats induces insulin resistance and diabetic response (9). IDE hypofunction also produces an accumulation of β-amyloid peptide and the intracellular domain of β-amyloid precursor protein (10).
In a previous work, we showed that ATP inhibits insulin degradation by IDE (11). The inhibition of insulin degradation appears to be strongly dependent on ATP concentration; other nucleotides cannot induce the same inhibitory effect. This ATP inhibition suggests that the nucleotide might act as a regulatory step on IDE function. Studies on insulin processing (12, 13), proteolysis regulation (4), inhibition of IDE activity by fatty acids (14), and β-amyloid peptide clearance regulation (8) have provided some insight into IDE actions and its metabolic role. In spite of these findings, an integrated understanding of the physiological role of IDE is still lacking. In this work we demonstrate that IDE is also capable of hydrolyzing ATP.
Materials and Methods
Materials.
Male Wistar rats (150–200 g) were donated by Dr. P. Gullace from INAME (National Institute of Medicaments, Buenos Aires, Argentina). Porcine insulin was a gift from Dr. Anderson (Lab. Beta, Buenos Aires, Argentina). Sodium iodide 125 (17.4 Ci/mg specific activity), γ-[32P]ATP, and α-[32P]ATP with a specific activity of 3000 Ci/mM were obtained from DuPont (Boston, MA). Centricon 30 and Centriplus 50 were from Amicon Inc. (Beverly, MA), and DEAE-Sephadex, super-fine Sephadex G-25, Sephadex G-50, and Sephadex G200 were from Pharmacia (Uppsala, Sweden). Pentyl agarose, PB-94 (Polybuffer exchanger), Polybuffer 74, ATP, dithiothreitol (DTT), N-ethylmaleimide (NEM), 1,10-phenanthroline (OP), ouabain, sodium azide, bacitracin, phenylmethylsulfonyl fluoride (PMSF), ADP, AMP, guanosine 5′-triphosphate (GTP), rabbit anti-mouse IgG, rabbit anti-mouse IgG-agarose, Coomassie brilliant blue R, and Silver Stain kit were manufactured by Sigma Chemical Co. (St. Louis, MO). Reagents for sodium dodecyl sulfate–polyacrylamide gel electrophoresis (SDS-PAGE) and immunoblotting were purchased from BioRad (Richmond, CA). All other drugs were of analytical grade.
Enzyme Purification.
The purification procedure was similar to a previous description (11). In brief, batches of 200 g of rat skeletal muscle were processed and applied to DEAE-Sephadex A-50 by batch adsorption. The more active elution was chromatographed in a 400-ml column in DEAE-Sephadex A-50. The active enzyme was precipitated with ammonium sulfate and chromatographed in a 10-ml pentyl-agarose hydrophobic column. The eluted degrading activity was precipitated, desalted, equilibrated with 25 mM histidine-HCl buffer, and applied to a 10-ml chromatofocusing PB 94 column. Enzyme activity was eluted between pH 5.2–4.8, pooled, precipitated as before, and chromatographed in 100-ml column of Sephadex G-200 and eluted with 20 mM Tris-HCl, pH 7.4, 10% glycerol, and this enzyme was used for the study. Some tubes of purified IDE were subjected to PAGE electrophoresis in nondissociating conditions, cut from gel, and electroeluted (Electro-Eluter Model 422, BioRad).
Protein concentration was assayed by absorbance at 280 nm in a spectrometer (Spectronic 3000 array; Markham, Ontario, Canada) or using Lowry’s or Bradford’s methods. All the above steps were performed at 4°C. The purified enzyme was stored at −70°C until use.
Insulin Degradation Assay.
Insulin was incubated at 37°C for 30 or 60 mins in 50 mM Tris-HCl buffer, 50 μM MgCl2 , pH 7.4, with 1% bovine serum albumin (BSA), and 16–20 pM of 125I-insulin (final incubation volume 100 μl). 125I-porcine insulin was labeled predominantly in tyrosine A-14 with a specific activity between 250 and 300 mCi/mg as described (15). Conditions were selected to preserve a linear degradation during the incubation period. The reaction was stopped by 5% trichloroacetic acid (TCA) (final concentration), kept overnight at 4°C, centrifuged for 15 mins at 1000 g, and then pellets were set apart from supernatants. The increase in 125I-insulin fragments (TCA soluble) was calculated and expressed as fentomol degraded insulin/hr (fmol/hr). TCA precipitation underestimates insulin degradation, but it is widely used for its simplicity and reproducibility (16–18).
Each experiment was performed in duplicate or triplicate. 125I-insulin controls (no enzyme present) had more than 95% of intact insulin (except for two experiments, where intact insulin represented 92%); hence, experimental results were corrected for control values. Radioactivity was counted in a gamma counter (Packard Instrument Inc., Downers Grove, IL).
ATP Hydrolysis.
The release of inorganic phosphate (Pi) was measured with γ-[32P]ATP as described by Rossi et al. (19). In brief, 0.5 μg of IDE was incubated in 50 mM Tris-HCl buffer, pH 7.4, with 50 μM MgCl2, 0.33 μCi γ[32P]ATP, and 100 μM ATP (final incubation volume 40 μl). After 30 mins of incubation at 37°C, the tubes were transported to an ice bath (2°C) and 0.6 ml of isobutanol was added, with 0.75 ml of 0.5% ammonium molybdate (w/v) in 5% perchloric acid (v/v). After incubation at 37°C for 15 secs, the mixture was vigorously shaken for 20 secs and centrifuged (3 mins at 1700 g, 4°C). Radioactive phosphate was counted in the organic phase (200 μl) in a liquid scintillation counter. Buffer radioactivity (no enzyme) was less than 2% in every experiment, and the results were corrected by this value. The activity was expressed as pmol Pi/hr, and each value is the result of three or more experiments by triplicate.
IDE Immunoprecipitation.
Three micrograms of purified IDE were incubated overnight at 4°C in 50 mM Tris-HCl buffer, 100 mM NaCl, 0.2 mg/ml BSA, pH 7.4, with 10 μg/tube of monoclonal anti-IDE antibody 9B12 (kindly provided by Richard A. Roth, Stanford University, Stanford, CA) up to 120 μl final volume. After incubation, IDE was precipitated with goat anti-mouse IgG-agarose (2 hrs at 4°C). The samples were centrifuged at 12,000 g for 5 mins at 4°C; the supernatant was removed, and its insulin-degradation activity and ATP hydrolysis were assayed as described. Controls were similar except we did not use monoclonal antibody 9B12. IDE activities in controls were considered as 100%.
SDS-PAGE and Immunoblotting.
Proteins under study (5–15 μg by line) were subject to SDS-PAGE electrophoresis in 7.5% polyacrylamide gel slabs and staining with Coomassie blue or silver following manufacturers’ protocols. Nondissociating buffer systems were used for electrophoresis of native enzyme (20). IDE (5–15 μg) was added to sample buffer at 4°C without SDS and DTT, loaded on 7.5% polyacrylamide gel free of SDS and the electrophoresis was run in a standard buffer free of SDS. In some experiments part of slab gel was stained and the bands of gel were cut along every 2 mm and the strips from gel were electro-eluted as described. In other cases, the 2-mm strip of gel with IDE were vertically loaded in a new gel for electrophoresis.
When insulin degradation or ATP hydrolysis were directly assayed in the gel, the strips were divided in two, and one-half of the strip was homogenized in 250 μl for degradation and the other half in 140 μl for hydrolysis, and each one was assayed as described.
In immunoblot studies, the enzyme was transferred to nitrocellulose membranes after IDE electrophoresis in SDS-PAGE. The membrane was blocked for 2 hrs at room temperature with 5% nonfat milk in 20 mM Tris-HCl, pH 7.5, 0.5 M NaCl, and then incubated overnight at 4°C with specific anti-IDE antibodies (1/500 of immunopurified rabbit IgG p-15 antibody or 1/750 dilution of 9B12 monoclonal anti-IDE mouse IgG). When the monoclonal antibody was used, the cellulose membrane was incubated during 1 hr with rabbit anti-mouse IgG before to color development. After washing in the same buffer containing 0.05% Tween-20, the bound antibody was detected by alkaline phosphatase-conjugated goat anti-rabbit IgG, according to manufacturer’s protocols. Pre-staining standards were used as molecular weight controls.
ATP Binding to IDE.
Enzyme Chromatography.
Forty-two micrograms of purified IDE were incubated for 20 mins at 2°C with 200 nM ATP + 200 μCi of γ[32P]ATP in Tris-HCl buffer, pH 7.4, with 10 mM MgCl2, 2 mM MnCl2 in a final volume of 500 μl, and subject to chromatography at 4°C in Sephacryl S-200 (100 ml column previously calibrated with IDE, BSA and ATP). The chromatography was eluted with the same buffer and collected at 1.5 ml per tube. Bovine albumin, used as control, was incubated and chromatographed in identical conditions.
Photoaffinity Cross-Linking.
Thirty micrograms of chromatofocusing purified enzyme with 0.5 μg of BSA used as control were incubated in 20 μl of 50 mM Tris-HCl buffer, pH 7.4, containing 10 mM MgCl2, 10% glycerol, 20% dextrose, 5 mM dithiothreitol (DTT) and from 0.16 to 0.54 μM α-[32P]ATP. Experiments were performed with IDE and α-[32P]ATP alone or with addition of other nucleotides or insulin. The reaction mixture was incubated at 30°C for 60 secs and irradiated with a Philips lamp TUV-15W G15T8, 254 nm wavelength (Philips Co., Eindhoven, The Netherlands) for 30 mins at 1°C with 1 nanoeinstein/mm2/min and stopped with 5 μl of 2.5 mM unlabeled ATP (21). Samples were subject to electrophoresis on 7.5%, reduced SDS-PAGE, fixed, and washed overnight with sodium pyrophosphate 0.1 M in 15% TCA, stained, dried, and autoradiographed with Kodak x-OMAT AR film in an exposure cassette with intensifying screen (Cronex, Dupont, Wilmington, DE).
Insulin Cross-Linking.
Cross-linking was processed as described (22). Ten micrograms of chromatofocusing purified IDE were incubated in 50 μl of 50 mM sodium phosphate buffer, pH 7.5, with 100 mM NaCl, 125I-insulin (~4 × 10⁵ cpm), and 1 mM OP with and without 1 μg of unlabeled insulin. In experimental tubes, IDE and variable concentrations of ATP were preincubated for 60 secs at 37°C and followed by another 60 mins at 4°C with radioactive insulin. Three microliters of disuccinimidyl suberate (8.25 mM in dimethylsulfoxide [DMSO]; final concentration 0.46 mM) were added and the incubation was prolonged for 20 mins more at 4°C. The reaction was stopped by addition of 8 μl of denaturing buffer containing 0.25 M Tris-HCl, pH 7.4, 7.5% SDS, and 375 mM DTT. After heating at 100°C for 2 mins, the samples were subjected to 7.5% SDS-PAGE. The gels were stained, dried, and autoradiographed, and densitometer studies were done with Scion Image software (based on National Institutes of Health (NIH) Image program on the Macintosh platform).
ATP Kinetic Studies.
Preliminary experiments were done in order to determine the linearity of protein concentration and time of study. For the apparent Michaelis constant (Km) determination, 0.5 μg of purified IDE were incubated in 50 mM Tris-HCl buffer, pH 7.4, with 50 μM MgCl2, 0.33 μCi γ-32P-ATP in 40 μl of final volume. Hydrolysis was measured as described before. The reaction followed a Michaelis-Menten equation and statistical variations were taken into account for calculations. Five experiments were done in triplicate.
Statistics.
Results are expressed as the mean ± SEM. To allow comparisons, in some experiments, results of the experimental condition are expressed as percentage of its own basal condition. Significance was always calculated using the absolute values. Student’s t test was used for statistical significance between groups.
Results
The last step of IDE purification in Sephadex G200 chromatography showed coincidence between proteins and insulin degradation (Fig. 1). SDS-PAGE of purified enzyme showed a 110 kDa band and some small bands of degraded IDE, as observed in the immunoblot with the specific antibody P15 (Fig. 1, inset), with the absence of another contaminant protein.
To study ATP hydrolysis by IDE, we analyzed the requirements of Mg2+ and Mn2+. Fifty micromoles of Mg2+ induced a small increment of ATP hydrolysis, which decreased sharply with ionic increment (Fig. 2A), while a dose-dependent increase in IDE activity was observed with Mn2+ from 50 μM to 1 mM. After two washes with 10 mM EDTA, ATP hydrolysis decreased, but not significantly, and it was restored with both ions. Mn2+ showed to be more active than Mg2+, and this capacity was more evident with insulin degradation (Table 1). The significant decrease in insulin degradation by EDTA was restored by Mn2+ but not by Mg2+, suggesting that Mn2+ could be the native ion for both functions.
IDE possesses a binding consensus sequence for Zn2+ and this ion is essential for enzyme proteolysis. We studied the effect of Zn2+ because low Zn2+ concentration has been proposed to recover denaturalized IDE improving its insulin degradation activity. One, 5, 10, and 20 μM Zn2+ did not induce an increase of insulin degradation, and 1 mM Zn2+ inhibited the enzyme’s insulin degradation activity (not shown). We used the same approach for ATP hydrolysis (Fig. 2B). At low concentrations, Zn2+ and Cu2+ had no effect on ATP hydrolysis. Conversely, concentrations higher than 10 μM resulted in a decrease in enzyme activity, suggesting that IDE is not dependent on these ions for ATP hydrolysis. Ca2+ at variable concentrations had little effect on ATP hydrolysis, and with 1 mM Ca2+ hydrolysis diminished 20% (not shown).
Table 2 shows the behavior of other ions with or without the addition of Mg2+. The ions studied did not show activity on ATP hydrolysis, except 1 mM LiCl that decreased hydrolysis. This response to 1 mM Li+ is probably due to the toxic effect of high concentration of this ion on IDE because 50 μM LiCl had no effect on hydrolysis. K+ did not induce changes on ATP hydrolysis, but the insulin degradation increased 30% with 100 mM KCl (IDE activity, fmol/hr/μg of degraded insulin; basal + 50 μM MgCl2, 5.53 ± 0.13; 100 mM KCl + 50 μM MgCl2, 7.20 ± 0.11; P < 0.001; n = 3).
Enzyme hydrolysis by ATP (IDE +50 μM MgCl2, Fig. 3) was time- and protein-dependent, and the hydrolysis was linear up to 6 μg enzyme/tube for 1 hr. As expected, BSA had no effect. The described conditions were used to determine ATP hydrolysis.
When ATP hydrolysis was measured during enzyme purification (Fig. 1), the proteins’ peak, insulin degradation, and ATP hydrolysis were superimposed. This coincidence of hydrolysis can be due to IDE activity itself or to some contaminant protein attached to IDE and not detected by silver staining in SDS-PAGE. In order to verify if degradation and hydrolysis are IDE’s activities, the enzyme was immunoprecipitated with the specific monoclonal antibody 9B12 (Table 3). The immunoprecipitation induced a significant decrease of both IDE activities (insulin degradation, 66%; ATP hydrolysis, 53%). This response suggests that IDE have intrinsically both activities, although it does not certify it because some proteins can coprecipitate during immunoprecipitation.
To answer this point, immunoprecipitated IDE was subject to nondissociating electrophoresis because in an electric field at 7.5% acrylamide gel concentration, protein mobility depends on its charge and size. Then, if associated, coprecipitated proteins must separate and move isolated, and both activities must be seen in different positions. The gel was cut and insulin degradation and ATP hydrolysis were measured in the gel (Fig. 4). Three main peaks were observed at 28% (24%–34%), 55% (52%–62%), and 80% (76%–84%) position on gel, and insulin degradation and ATP hydrolysis were coincident. This coincidence strongly suggests that both activities are structural to IDE, while the relationship between percentage of degradation and hydrolysis are less important because gel strips were not identical and dilution volumes were different. IDE mobility in nondissociating gel is not similar to that observed in SDS-PAGE, and the bands are less defined. We observed two bands at 25% and 50% and, in some cases, IDE mobility at 80%. This IDE mobility at 80%, previously observed, when rechromatographed in the same conditions generated one band at 50% (not shown). We believe that this mobility can be the result of gel saturation because it appears after electrophoresis with the precipitated proteins during immunoprecipitation or after gel electrophoresis with high enzyme concentration.
To confirm these results we compared insulin degradation and hydrolysis with homogeneous, extractive rat IDE and purified recombinant rat IDE (rIDE). The enzyme purified in successive chromatography steps described in Figure 1, which present small fragments of degraded IDE, was subject to electrophoresis in nondissociated conditions, was cut from gel, electroeluted, and run again in SDS-PAGE showing only one band in IDE position (Fig. 5A). This band was recognized as IDE by the specific carboxyterminal antibody p15 (Fig. 5B). This enzyme and rIDE (Fig. 5C) (kindly provided by Dr. Eduardo M. Castaño from Instituto de Química y Fisicoquímica Biológica, UBA, Buenos Aires, Argentina) were used for comparisons of insulin degradation and ATPase activities. ATP hydrolysis (picomoles Pi/hr/μg proteins) with rIDE was 519.67 ± 26.79, n = 3; extractive IDE, 1341.50 ± 202.70, n = 4; P < 0.02; and insulin degradation (fmol/hr/μg proteins) with rIDE, 3.90 ± 0.74, n = 3; extractive IDE, 2.27 ± 0.06, n = 3; P = NS. rIDE expressed in Escherichia coli and purified in nickel-chelating column have similar ATP hydrolysis and insulin degradation activities to extractive IDE. Small differences in activity between enzymes can be due to some disagreement in protein assays (densitometry by Scion Image versus Bradford).
Because proteolysis and hydrolysis appeared to be IDE functions, we studied the effect of some substances on enzyme hydrolysis and insulin degradation (Table 4). Insulin is an IDE substrate, and bacitracin competes with insulin for enzyme binding; N-ethylmaleimide is an alkylating agent of sulfhydryl groups and inhibits insulin degradation; sodium azide is an inhibitor of phosphohydrolases; ouabain is a potent inhibitor of Na+/K+ ATPases; orthovanadate is an inhibitor of ATPases and phosphatases and 1,10-phenanthroline is an inhibitor of insulin degradation because it chelates Zn2+. As it is known, insulin inhibits insulin degradation in a dose-response way because it competes with labeled insulin. The IDE inhibition of degradation is small with the insulin doses studied (100 nM) because it is within the known Km of IDE for insulin degradation. N-ethylmaleimide, orthovanadate, 1,10-phenanthroline and bacitracin are inhibitors of insulin degradation of variable degree, depending on concentration and incubation conditions (Table 4). Except for sodium orthovanadate, the substances tested did not modify ATP hydrolysis. Sodium orthovanadate is an inhibitor of ATPases and phosphatases, since they compete with the gamma phosphate during the transitional state of hydrolysis. Vanadate derivatives, such as peroxovanadate, are more active inhibitors of insulin degradation than orthovanadate. The hydrolysis inhibition of IDE with orthovanadate suggests that the enzyme might be phosphorylated during the transitional state of hydrolysis. These results also suggest that the enzyme has no contamination with Na/K ATPases and apyrases, because there is no inhibition of hydrolysis with ouabain and sodium azide. Moreover, hydrolysis appears as independent from sulfhydryl groups, since N-ethylmaleimide has no effect.
In the conditions described above, we studied the enzyme kinetics of ATP hydrolysis. The hydrolysis followed a Michaelis-Menten kinetics with a Vmax of 570.45 ± 113.08 pmol Pi/hr and an apparent Km of 63.13 ± 3.48 μM (n = 5) (Fig. 6). Graphical representation of enzyme kinetics and Hill value (nH = 1) suggest that there is only one active site in IDE molecule for ATP hydrolysis. IDE reaches a Vmax with 500 μM of ATP concentration, which suggests that the enzyme is saturated at ATP cellular concentrations.
IDE has an insulin binding site for proteolysis, and the enzyme would be expected to have an ATP binding site for ATP hydrolysis. The finding of an ATP binding site would support the concept that IDE has structurally both activities. Therefore, we studied enzyme binding to ATP. Sephacryl S-200 chromatography of IDE and ATP (ATP + γ-[32P]ATP) that was previously incubated for 20 mins at 2°C showed radioactivity in IDE position (Fig. 7A), while BSA in identical conditions only showed radioactivity in ATP position (Fig. 7B). This ATP distribution suggests an enzyme binding to nucleotide. Photoaffinity cross-linking of α-[32P]ATP to IDE (Fig. 8A) showed a band at 110 kDa that disappears after addition of 10 mM ADP, AMP, or GTP. The 70-kDa band, observed in some enzyme purifications as degraded IDE, also disappears after nucleotide addition, but high insulin concentration (8 μM) was unable to inhibit the α-[32P]ATP cross-linked to enzyme. Nucleotide competition suggests that the cross-linked bands are IDE. Albumin added as control remains stable. All these results suggest that IDE binds ATP and demonstrate that insulin has no effect on ATP binding or hydrolysis; instead, insulin degradation appears to be dependent on ATP concentration, as already reported (11).
ATP inhibition of insulin degradation can be due to a decrease in insulin binding by IDE, a decrease in its catalytic activity, or both. To study if a decrease in insulin binding participates in the inhibition of insulin degradation we performed a 125I-insulin cross-linking to IDE with variable ATP concentrations (Fig. 8B). As it is known, high insulin doses compete with radioactive insulin and suppress the 125I-insulin cross-linking to the enzyme. Increasing doses of ATP modified insulin cross-linking (densitometer analysis; (a) 1 μM insulin: total inhibition; (b) no ATP: 100%; (c) 0.5 mM ATP: 137%; (d) 5 mM ATP: 92%; (e) 10 mM ATP: 50%; significance for each point: P < 0.0005). The changes of basal 125I-insulin cross-linking to IDE with ATP suggest the nucleotide can induce a change in the enzyme that modifies the insulin binding site, which might explain the decrease of insulin degradation. This interpretation agrees with previous results showing a decrease in enzyme affinity to insulin with ATP (11).
Conformational changes in the enzyme can also modify its molecular behavior and aggregation. For example, IDE mobility in SDS-PAGE does not agree with the elution volume of native IDE in Sephadex G200 chromatography, which suggests a molecular weight higher than 110 kDa. To study whether ATP could modify this behavior, IDE was subject to 7.5% PAGE in nondissociating conditions with the addition of 1 and 3 mM ATP. Without ATP (Fig. 9A), there were two main bands at 29% and 35% on gel position. The addition of 3 mM ATP (Fig. 9C) showed the disappearance of 35% band and the appearance of 53% band. Four similar experiments had the same pattern, showing a strong 35% band and subtle 29% and 53% band without ATP, and a strong increment of 53% band with 3 mM ATP (densitometer analysis is present in Fig. 9). These changes in gel electrophoresis can be due to differences of IDE mobility in an electric field with millimolar ATP concentrations, although IDE showed an almost homogenous isoelectric charge when it was purified by chromatofocusing. Another possibility is that enzyme distribution in nondissociating gel could be related to changes in monomer aggregation. The enzyme position at 53% appears as monomer when compared with molecular weight markers of many colors. Altogether these results strongly indicate that ATP induces conformational and aggregation changes in IDE.
Recently, it has been proposed, using recombinant rIDE, that enzyme degradation activity is modified by polyphosphates rather than ATP (23). For this reason, we studied insulin degradation with rIDE to verify our previous results (Table 5). Five millimolar ATP without ions did not induce a significant decrease in insulin degradation, but the addition of ions significantly decreased insulin degradation without ATP. Because imidazole (used for rIDE elution from the metal affinity column during purification) could displace ions without ATP dissociation from IDE, the enzyme was pre-incubated at 37°C for 1 hr with 50 μM MgCl2 to obtain hydrolysis of presumed bound ATP (rIDE loses some activity after this time, Table 5). After pre-incubation there was a significant 60% inhibition of insulin degradation by ATP, while phosphates did not induce a significant decrease of degradation. The use of 5 mM pyrophosphate (PPi) or triphosphate (PPPi) with 10 mM MgCl2 + 2 mM MnCl2 after rIDE pre-incubation did not induce inhibition of insulin degradation (not shown). These results suggest that ATP inhibits insulin degradation, while the phosphates actions are variable, depending on IDE ionic concentration.
Discussion
The comparison between insulin degradation and ATP hydrolysis of extracted IDE (from rat muscle) or rIDE (expressed in E. coli BL21) was similar. Furthermore, immunoprecipitated IDE with a subsequent electrophoresis in nondissociating conditions showed correspondence between hydrolysis and proteolysis (Fig. 4). Levels of both activities are not comparable, because the Kms are different and quantification in the gel is not exact.
Song et al. published recently (23) that IDE inhibition of insulin degradation induced by ATP depends on inorganic phosphates rather than on the nucleotide. To test our results we repeated the experimental conditions described by Song et al. We found that insulin degradation in basal rIDE conditions is inhibited with the sole addition of ions. This finding suggests that rIDE is deprived of ions. In this work, we observed that ATP hydrolysis with progressive concentrations of Mg2+ or Mn2+ showed basal hydrolysis before ion addition (Fig. 2), suggesting an ionic association to the enzyme. Furthermore, Ebrahim et al. found Zn2+ and Mn2+ associated to purified enzyme (24). The use of imidazole as eluent from metal affinity columns can displace Mg2+ and other ions (25–27). This could explain differences in results on insulin degradation because after enzyme pre-incubation with Mg2+, rIDE showed a similar inhibition with ATP such as the one described in a previous work (11). Moreover, studies on E. coli F1-ATPase showed from its six nucleotide-binding sites (three catalytic and three noncatalytic) that these noncatalytic sites could bind PPi. Addition of PPi could produce net displacement of nucleotides from catalytic sites (28) because PPi makes a complex with Mg2+, decreasing Mg2+ availability within the catalytic sites. Therefore, PPi does not compete for catalysis but competes for ions and changes the nucleotide activity. This means that polyphosphates would modify IDE degradation activity. We used Mg2+ for this study because Mg2+ and Mn2+ have similar response with hydrolysis, but insulin degradation activity of IDE appears more dependent on Mn2+ than Mg2+.
The ATP inhibition of insulin degradation can also be supported by the effect of orthovanadate on ATP hydrolysis. It is known that insulin degradation by IDE is inhibited with peroxovanadate and vanadate at variable concentrations (29). Hydrolysis inhibition by vanadate is due to competition with gamma phosphate impeding hydrolysis during the transitional state; hence, binding persistence of ATP could explain the inhibition of insulin degradation.
The IDE inhibition of insulin degradation by ATP has been shown to be an allosteric inhibition (11) because Dixon plot of enzyme kinetics is not lineal, Hill value is higher than 1, and v/v versus log s at variable ATP concentrations has a sigmoid curve. Furthermore, insulin at various concentrations has no effect on ATP binding and hydrolysis. ATP hydrolysis by IDE has a Hill value of 1 and follows a Michaelis-Menten kinetics with lineal representation in double reciprocal plot (that is, only one active site per molecule of IDE). Changes in aggregation do not impede insulin degradation because IDE monomer has the insulin binding site and the catalytic Zn2+ for proteolysis as observed by us (Fig. 4) and described by other authors (30, 31). Song et al. showed cooperativity in enzyme degradation with small substrates and suggested that there are subunit interactions in enzyme dimer, but they did not find cooperativity in insulin degradation (30). Then dimerization does not explain the ATP allosteric inhibition of insulin degradation. Taken together, these results suggest more than one ATP binding site in IDE with only one active site for hydrolysis. Although there is no typical ATPase consensus sequence in IDE, as described by Walker, the enzyme has at least two possible binding sites in the glycine-rich zone of rat IDE (amino acids [aa] 331–369). It is known that the presence of an ATP consensus sequence does not always guarantee ATP binding, as mentioned by Doolittle et al. (32), and that unknown sequences could bind ATP (33). Between aa 378–383 there is a putative sequence Asp-X(2–4)-Gly for Mg2+ or Mn2+ coordination (34–36), which is usually near the glycine rich zone.
ATP decreases insulin binding and degradation and also diminishes dimer formation suggesting conformational changes in IDE. Apparent increments in insulin binding have been observed with catalytic site mutations of IDE or inhibition of insulin degradation with N-ethylmaleimide. It may represent the transitory equilibrium of insulin still bound and not degraded (31). Increases or decreases in IDE-insulin cross-linking as a result of low or high ATP concentration could be explained by spatial changes in IDE folding during ATP binding, decreasing the insulin exposition to IDE catalytic site or directly to the insulin binding. This protein behavior could also explain the increments in degradation with small substrates induced by ATP (23).
The kinetics studies showed an apparent Km for ATP hydrolysis of 66.13 ± 3.48 μM, similar to chaperone proteins according to Diamant et al. (37). Chaperone proteins are slow ATPases, with protease activity that can control the folding, assembly, or disassembly of multimeric proteins, and facilitate protein translocation through membranes (38) and degradation of proteins with altered structures. An example of these chaperone proteins in prokaryotes is Protease La, present in mitochondria (39). The oligomerization and proteolysis of chaperones are dependent on ATP energy and substrate binding (39). IDE, with regard to insulin, seems different because ATP decreases its dimer formation and inhibits insulin proteolysis. Moreover, IDE is not dependent on energy for proteolysis, and insulin, as substrate, does not improve insulin degradation.
In a previous presentation we described IDE in mitochondrial matrix (40), and this finding has been confirmed recently (41). In this last work, a possible functional role of IDE of processing leader protein sequences directed to mitochondria was suggested. Metalloproteinases are essential for mitochondrial biogenesis, and mitochondrial processing peptidase (MPP) is one of these proteins. Cytochrome bc1 has intrinsic MPP activity, which can be demonstrated after Triton X-100 treatment, and the known crystallographic data from cytochrome bc1 has been used as a model to study spatial structure of MPP (42). The model shows two interacting subunits, with a pocket between them for substrate binding, and a loop at the bottom of the alpha subunit, formed by the glycine-rich zone, which is near the catalytic zone of the beta subunit. Changes in selected glycines do not impede dimer formation but dramatically decrease binding and substrate proteolysis (42). Although IDE homology with MPP is less than 10%, and in MPP both subunits are complementary, some functional similarities with IDE, as degradation of presequences, would suggest that glycine rich zone could play a functional role in IDE degradation activity.
We previously showed that ATP is more active than ADP on the inhibition of insulin degradation and its concentration is almost ten times lower than ATP (11), then ATP appears as a regulator of IDE insulin proteolysis and the ATP hydrolysis to ADP as the required step for activation of insulin degradation. The cellular distribution of IDE gives value to ATP hydrolysis, because the enzyme can be found in cytosol, but it is directed and localized in peroxisomes and mitochondria. Insulin regulates fatty acid oxidation in peroxisomes, as demonstrated by Hamel et al. (43), and IDE can regulate insulin through degradation. In this way, peroxisomal insulin activity could be regulated by IDE, and the activity of IDE might be regulated by ATP concentration and fatty acid availability (ATP as expression of metabolic energy status and fatty acids because they inhibit IDE) (14).
IDE regulation by ATP opens a way to gain better knowledge of IDE functions. The behavior of the enzyme suggests a different pattern from that known for chaperone proteins. Another question that remains to be explained is whether IDE protease activity and its control by ATP are the true enzyme functions, or whether the control by ATP of insulin degradation by IDE is only one part of still unknown actions of internalized insulin.
Changes in IDE Activity Induced by Mg2+ and Mn2+ a
ATP Hydrolysis: Changes Induced by Ions a
Effect of IDE Immunoprecipitation a,b
IDE Degradation and Hydrolysis: Changes Induced by Drugs and Inhibitors a
Insulin Degradation with Rat IDE a

Sephadex G200 chromatography of IDE. Peak of degraded insulin is 18% and conditions were selected to preserve a linear degradation during the incubation period. Proteins distribution, insulin degradation, and ATP hydrolysis are coincident. Inset (A) SDS-PAGE and silver staining of enzyme chromatography. The number shows the position of MW markers. Left line: middle of ascending proteins; center line: protein peak; right line: middle of descending proteins. (B) immunoblot of purified IDE with the specific IDE carboxyterminal p15 antibody. Contaminant proteins are not observed. (♦) Percentage of 125I-Insulin degraded; (▴) ATP hydrolysis; (▪) protein concentration.
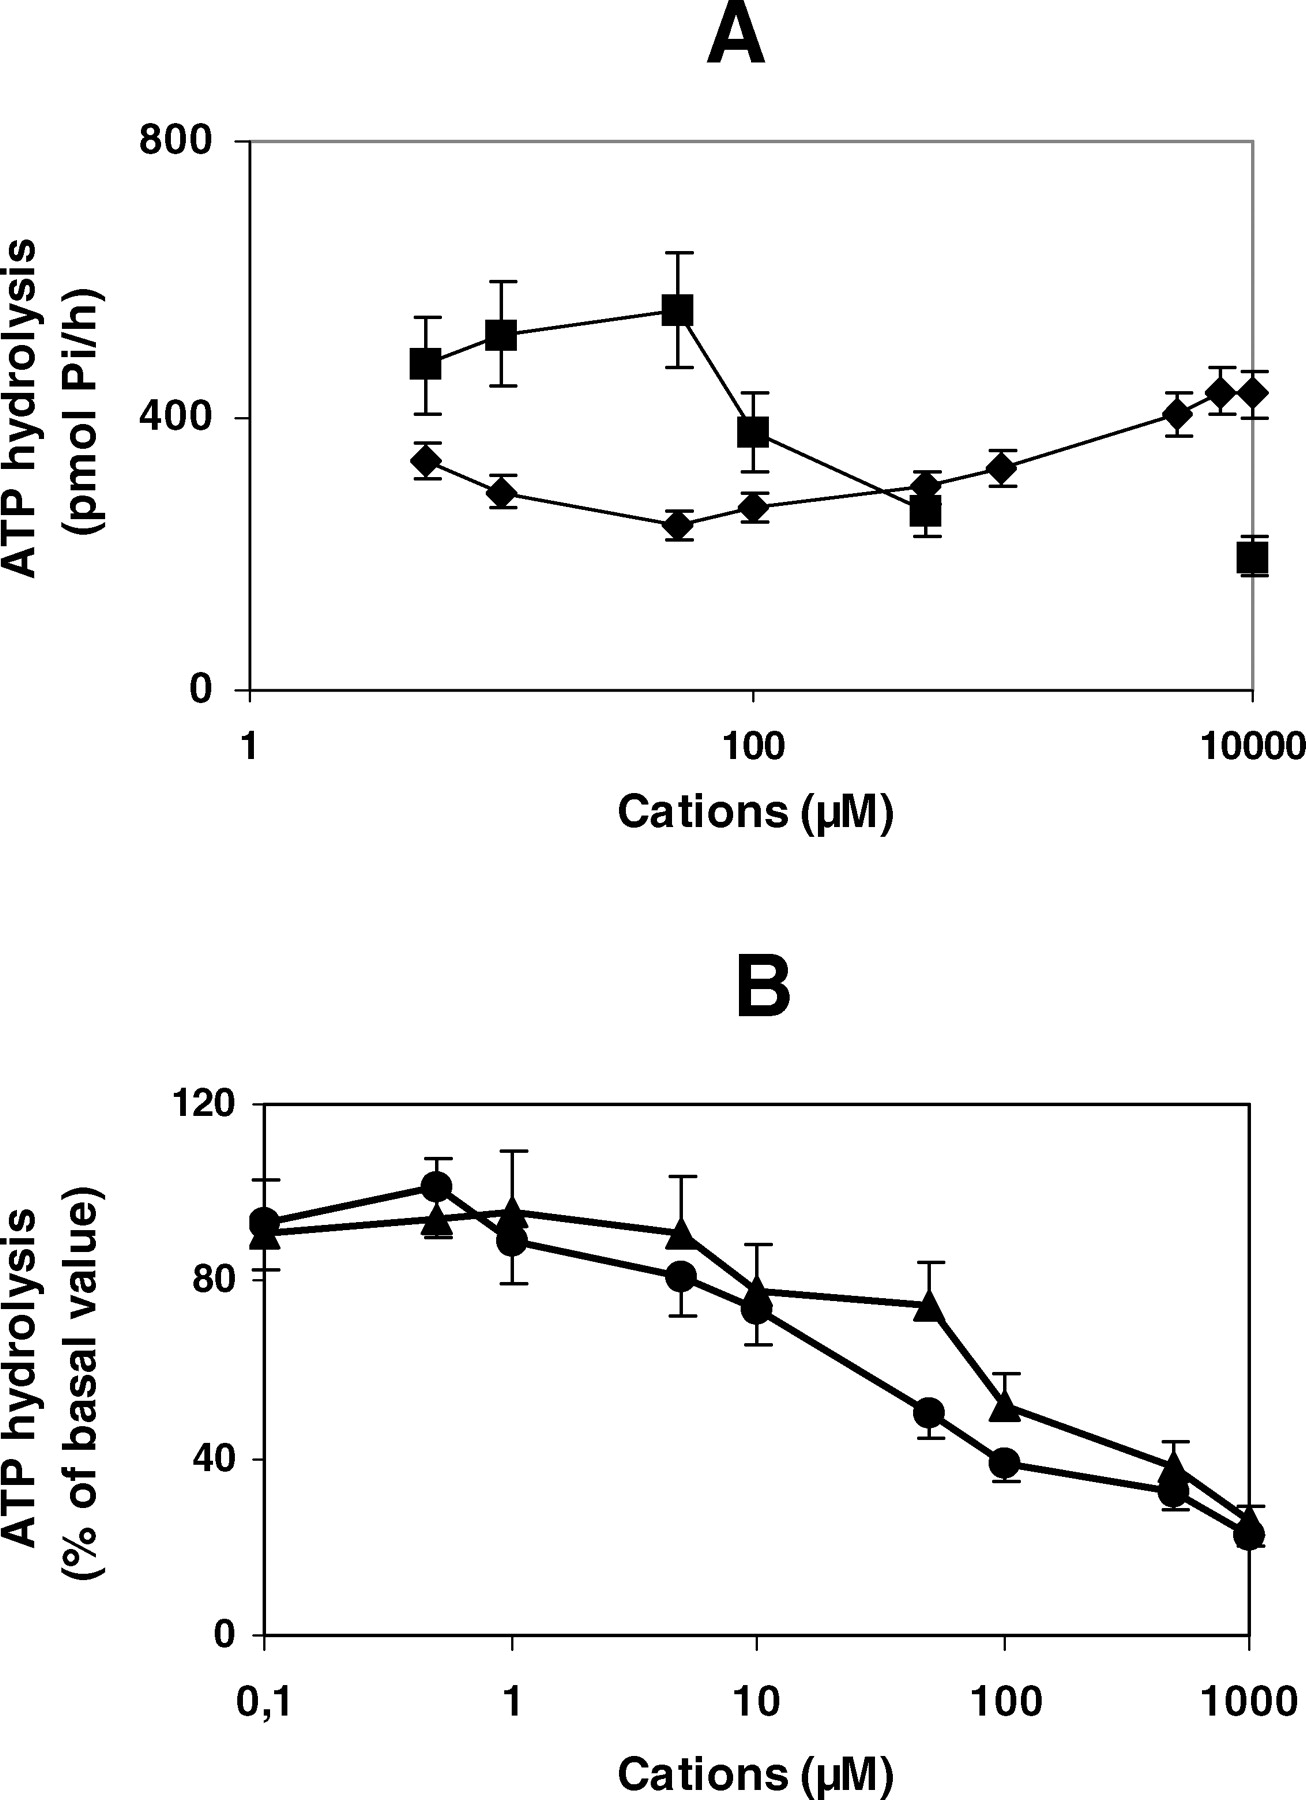
IDE dependence of cations. Hydrolysis was determined as in Methods section. (A) Mg2+ (▪); Mn2+ (♦). (B) Zn2+ (•); Cu2+ (▴). (n = 3). There is a basal ATP hydrolysis before cations addition.
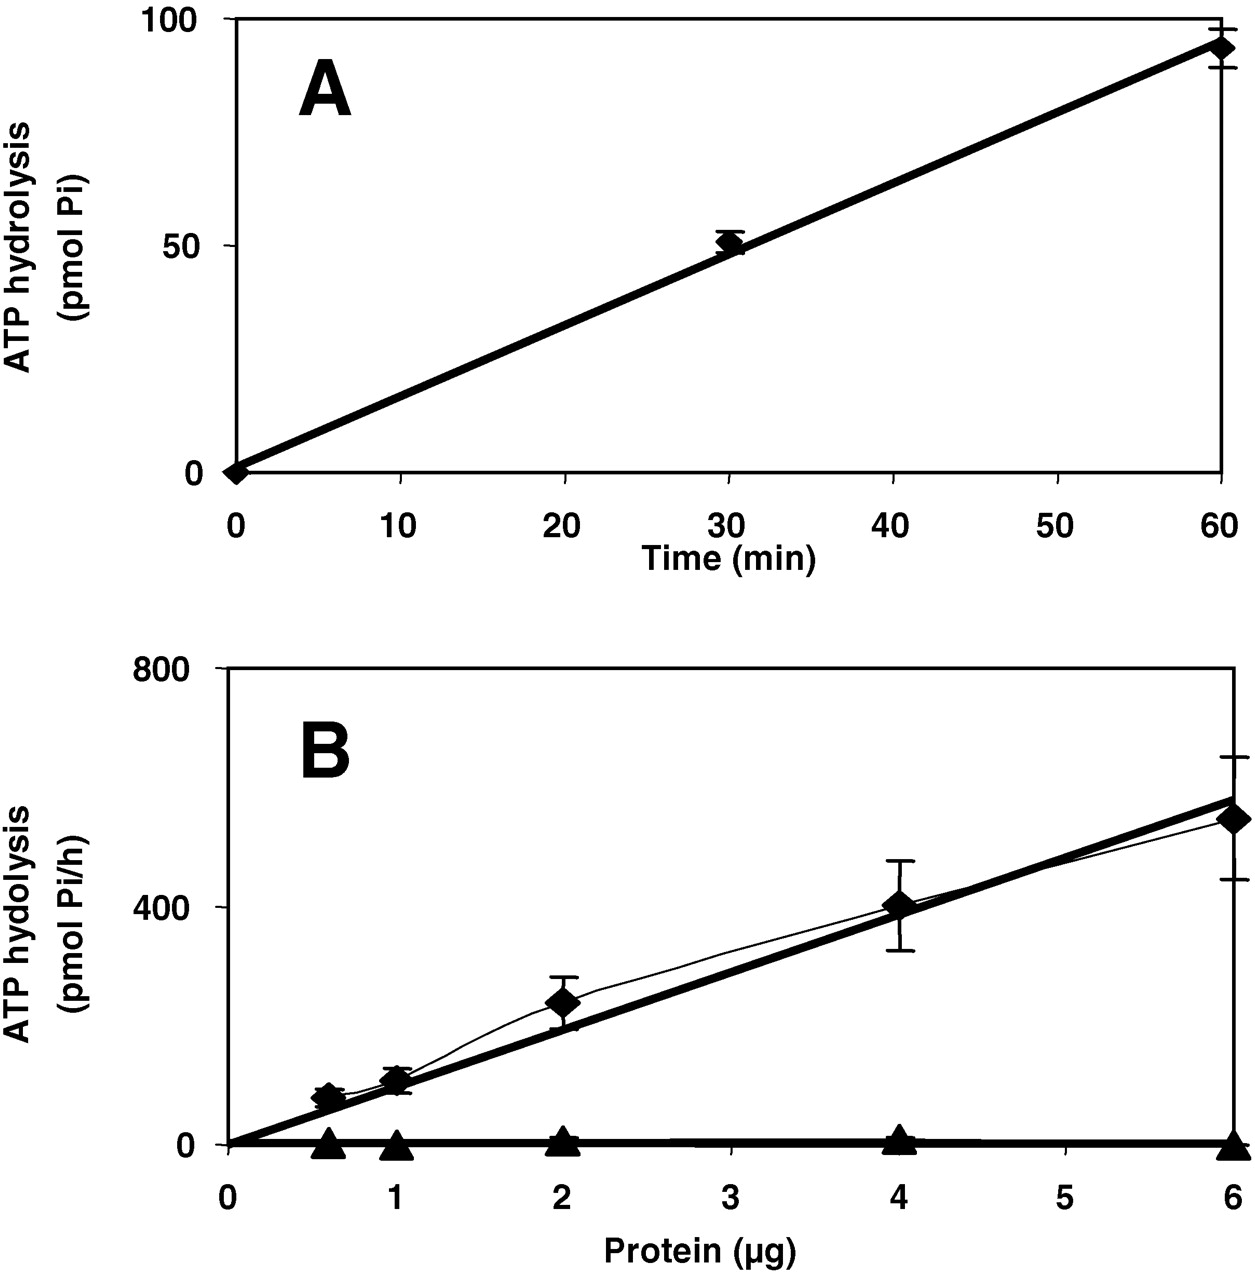
Time and protein dependence of ATP hydrolysis. Hydrolysis was determined as in Methods section. (A) Time dependence. (B) Protein dependence. IDE (♦); BSA (▴). (n = 3).
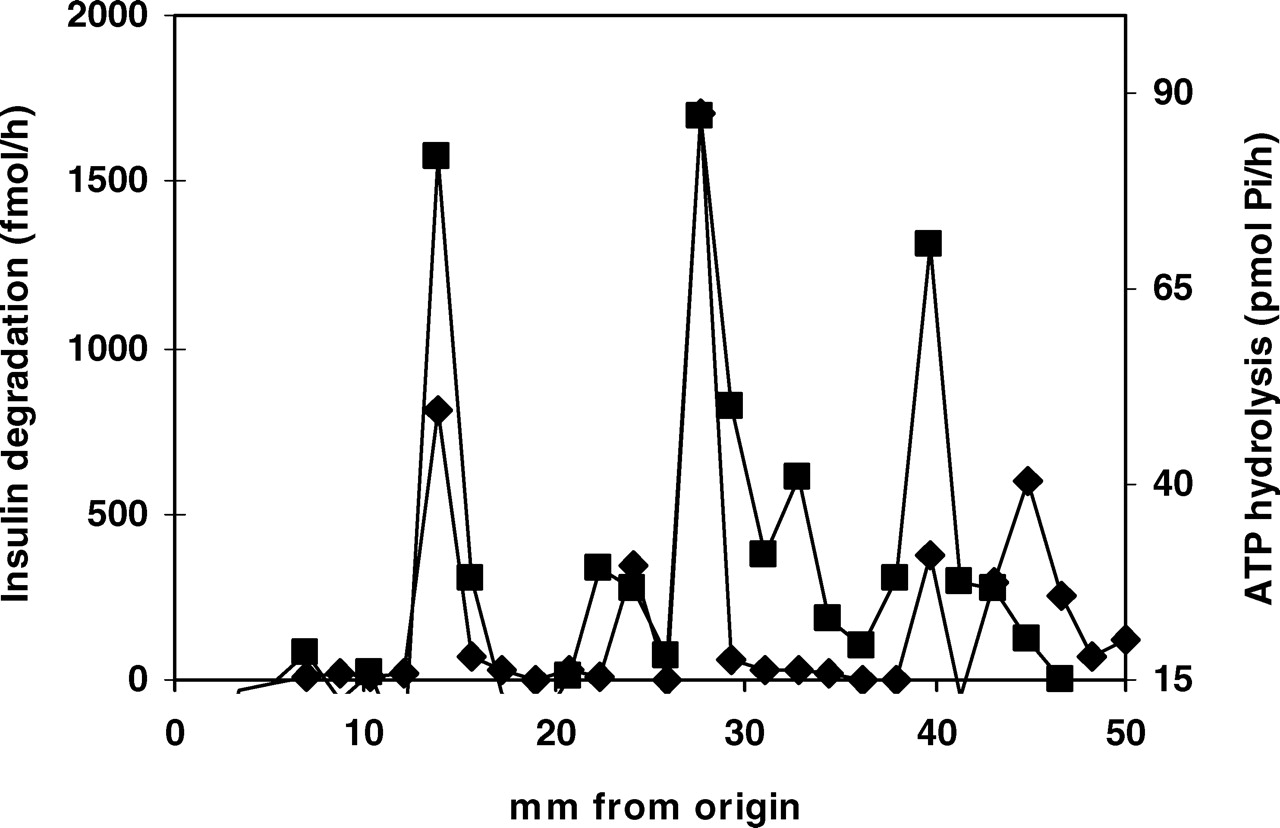
IDE electrophoresis in nondissociating conditions. Immunoprecipitated IDE was subject to gel electrophoresis in nondissociating conditions. The form of stacking gel was modified and IDE was sealed along the gel width in only one line. After electrophoresis, the slab gel was cut every 2 mm and half of the gel was used for insulin degradation and the other half for ATP hydrolysis. Insulin degradation and ATP hydrolysis were assayed in pieces of gel as described in Methods section. Three peaks are observed at 28% (24%–34%), 55% (52%–62%), and 80% (76%–84%) position on gel. There is coincidence between insulin degradation and ATP hydrolysis. The 80% peak observed in gel is probably due to protein excess (trailing). Insulin degradation (♦); ATP hydrolysis (▪).
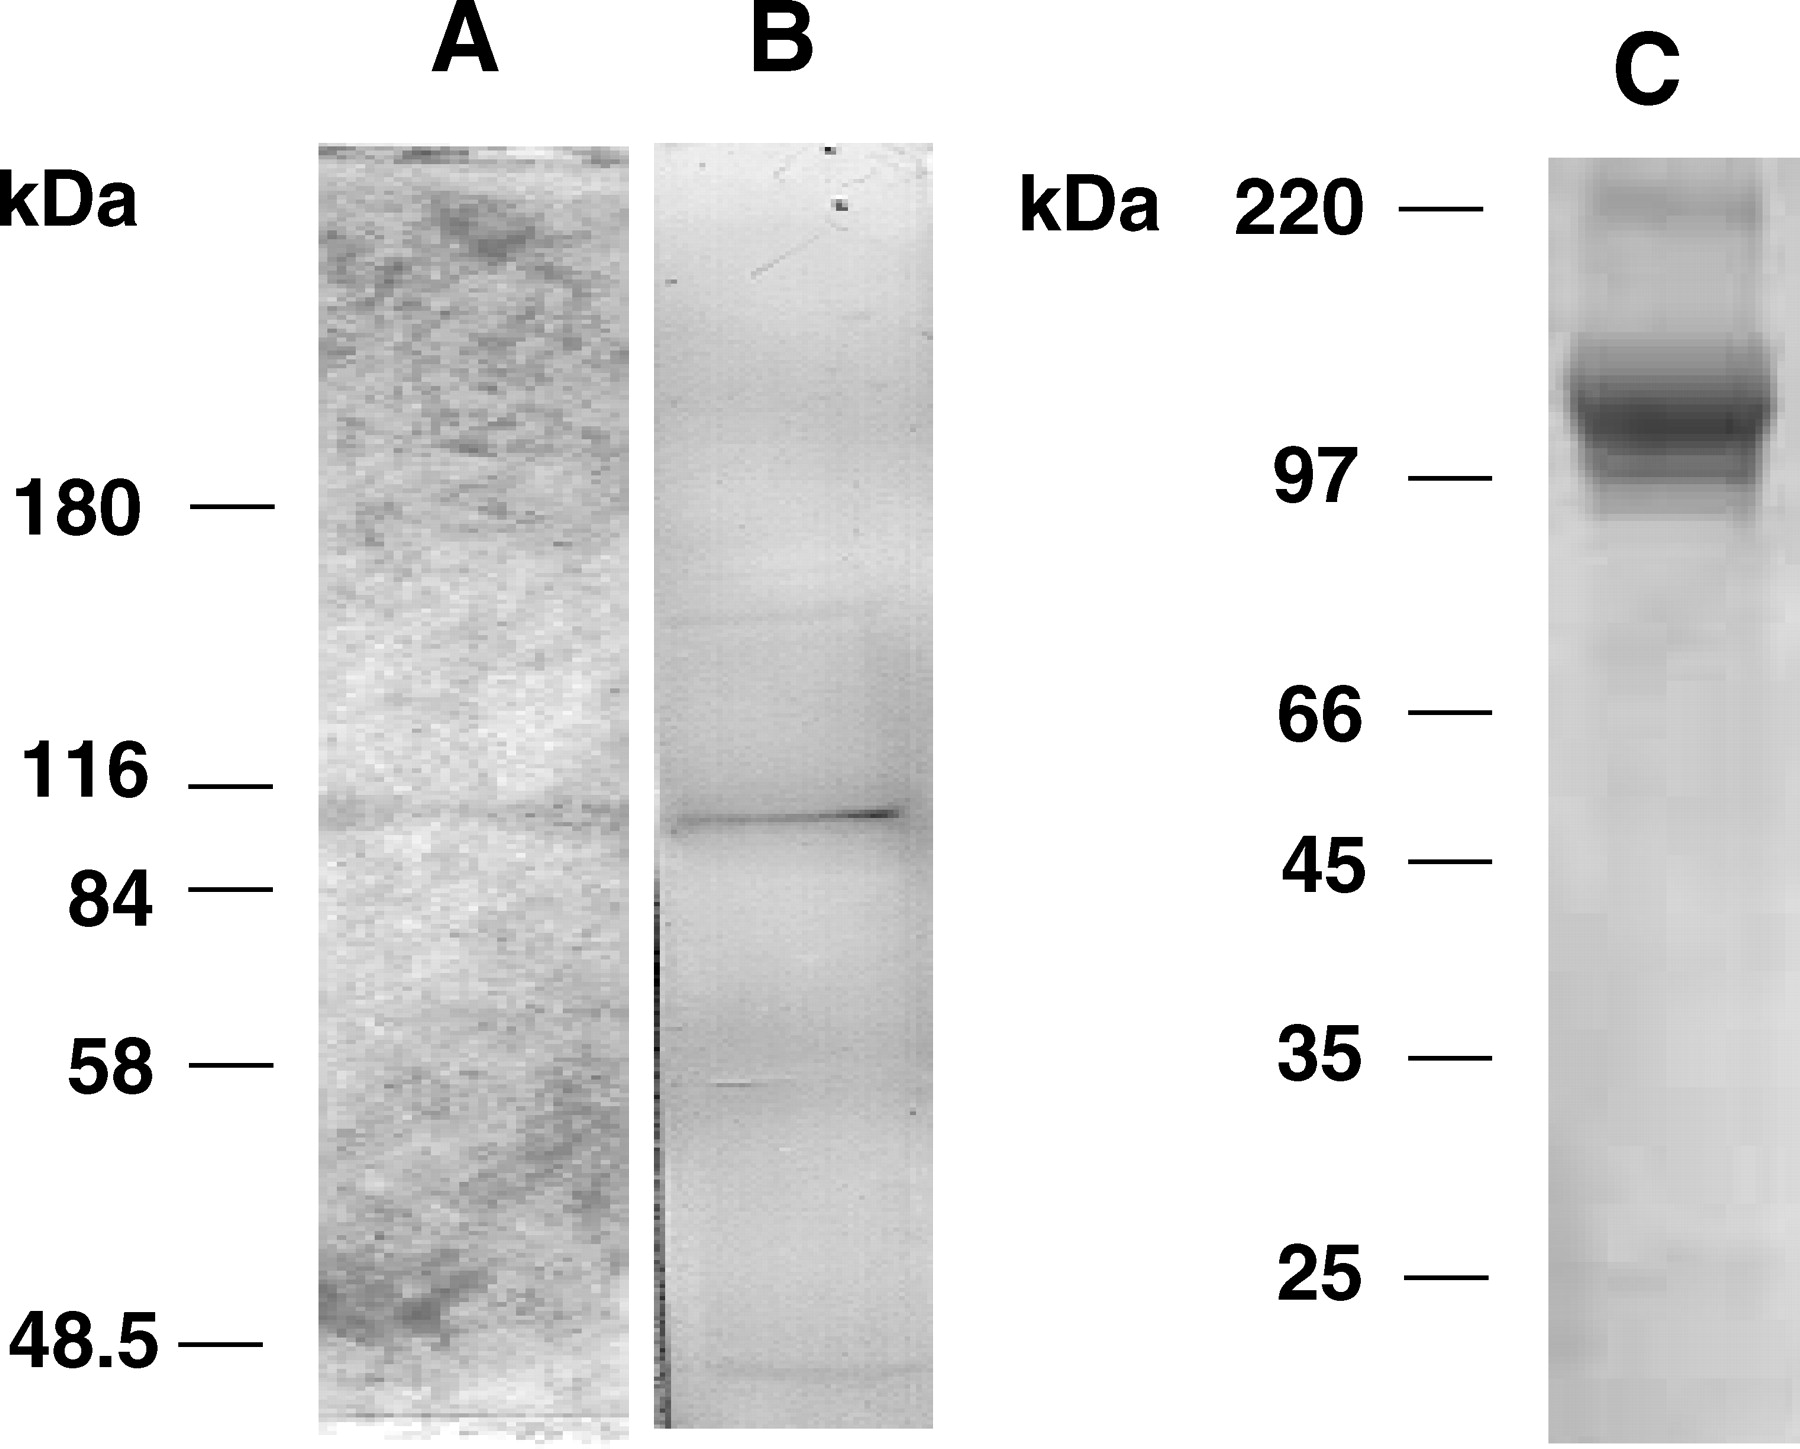
Insulin-degrading enzyme purification. (A) Silver staining of SDS-PAGE of IDE after enzyme purification followed by electrophoresis in no dissociating conditions and electroelution. (B) Enzyme immunoblot with the specific p15 carboxyterminal IDE antibody. (C) recombinant rat IDE (rIDE). The enzyme was expressed in E. coli, purified in a nickel-chelating column and re-purified by high-performance liquid chromatography. (Reprinted with permission of Dr. E. M. Castaño). MW markers are indicated.

Enzyme kinetics. (A) ATP hydrolysis with increases doses of ATP. (B) Double reciprocal plot of data shows a straight line (r2 = 0.997). Vmax: 570.45 ± 113.08 pmol Pi/hr. Km: 63.13 ± 3.48 μM (n = 5). There is no cooperative effect in ATP hydrolysis and Vmax is reached with 500 μM ATP.
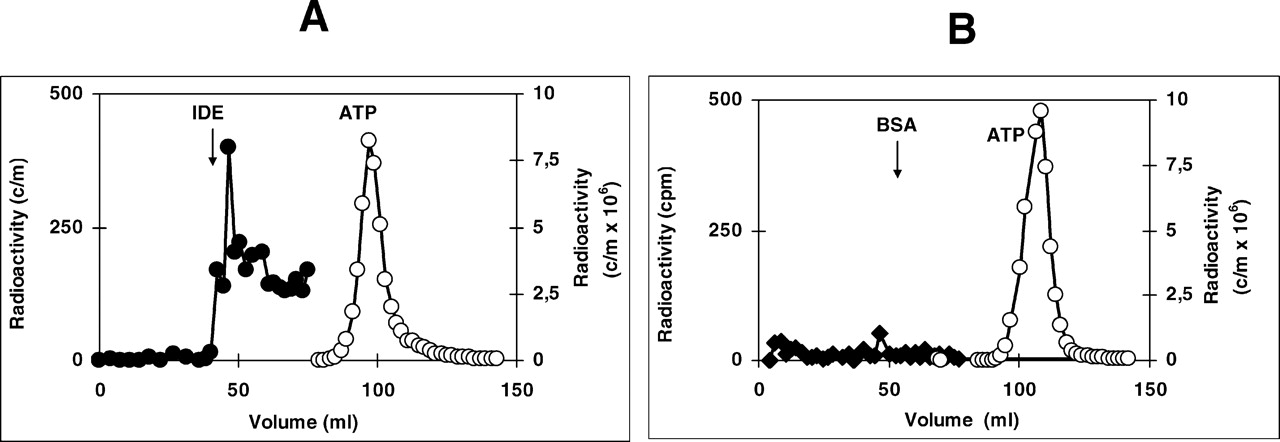
ATP binding to IDE — enzyme chromatography: 42 μg of purified IDE was incubated during 20 mins at 2°C with ATP (200 nM ATP + 200 μCi γ-[32P]ATP, see Methods section) in a final volume of 500 μl and subject to chromatography at 4°C in Sephacryl S-200 (100-ml column previous calibrated with IDE, BSA, and ATP) and collected at 1.5 ml per tube. Bovine albumin was incubated and chromatographed in identical conditions. (A) Chromatography of IDE and ATP. (B) Chromatography of BSA and ATP. There is a radioactive peak in IDE and ATP position with enzyme, but only an ATP radioactive peak with BSA.

Cross-linking studies. (A) ATP-IDE cross-linking. IDE-α[32P]ATP cross-linking photoaffinity was subject to electrophoresis in SDS-PAGE and exposed for autoradiography. Numbers show MW markers. (a)10 μM ATP; (b) 10 mM ADP; (c) 10 mM AMP; (d) 10 mM GTP; (e) 8 μM insulin; (f) 80 nM insulin. Nucleotides addition suppresses IDE-α-[32P]ATP cross-linking. Insulin at two concentrations has no effect. (B) Insulin-IDE cross-linking. 125I-insulin cross-linked to IDE was subject to SDS-PAGE and autoradiography. Numbers show MW markers. (a) 1 μM insulin: total inhibition; (b) no ATP: 100%; (c) 0.5 mM ATP: 137%; (d) 5 mM ATP: 92%; (e) 10 mM ATP: 50%. High cold insulin concentrations suppress IDE-125I-insulin cross-linking and increasing doses of ATP modifies the enzyme binding to 125I-insulin. Densitometer analysis; significance for each point to basal (no ATP): P < 0.0005.

ATP effects on IDE. The enzyme was subject to electrophoresis in nondissociating conditions (proteins bands are less defined than SDS-PAGE). (A) native IDE, (B) 1 mM ATP; (C) 3 mM ATP. The percentage values represent enzyme mobility from origin. Line A (no ATP) represents 100% density (densitometer analysis by Scion Image). Enzyme mobility 29%: A: 100%, B: 97%, C: 165% (P < 0.02). Enzyme mobility 35%: A: 100%, B: 50% (P < 0.05), C: not visible. Enzyme mobility 53%: A: 100%, B: 130%, C: 222% (P < 0.02). ATP changes IDE distribution in gel electrophoresis because 3 mM ATP induces the disappearance of 35% band and strengthens 29% and 53% bands.
Footnotes
Acknowledgements
We thank Dr. Eduardo M. Castaño for his help with recombinant rat IDE and Mrs. Mónica Alvarado for her skillful technical assistance.