



Abstract
Endothelin (ET)-1 is produced by endothelial cells and cardiac myocytes. ET-1 has positive inotropic and chronotropic effects on the heart and causes myocardial cell hypertrophy. Exercise training induces a physiologic cardiac hypertrophy. To study whether myocardial ET-1 is involved in the formation of exercise training–induced cardiac hypertrophy, we investigated time-course alterations of myocardial ET-1 gene expression and ET-1 peptide level in the heart of rats during a formative process of exercise training–induced cardiac hypertrophy. We used the hearts of rats that had been exercise-trained for 4 weeks (4WT) or 8 weeks (8WT) and sedentary control rats for 4 weeks (4WC) or 8 weeks (8WC). Exercise-trained rats performed treadmill running for 5 days/week (60 mins/day). Left ventricular mass index and wall thickness and stroke volume index, measured using echocardiography, in the 8WT group were significantly greater than in the 8WC group, although there were no differences between the 4WC and 4WT groups in these parameters. These results indicated that the 8WT rats developed physiologic cardiac hypertrophy, whereas the 4WT rats did not yet have cardiac hypertrophy. Myocardial ET-1 gene expression and tissue ET-1 concentration in the heart were significantly higher in the 8WT group than in the 8WC group, whereas these values did not differ between the 4WC and 4WT groups. The present study suggests that an alternation of myocardial ET-1 production corresponds with the formation of exercise training–induced cardiac hypertrophy. Therefore, the exercise training–induced change in myocardial ET-1 production may participate in a mechanism of exercise training–induced cardiac adaptation (e.g., cardiac hypertrophy).
Introduction
Exercise training causes a physiologic cardiac hypertrophy, commonly referred to as “the athletic heart” (1, 2). The athletic heart is a physiologic cardiac hypertrophy that is characterized by increases in left ventricular (LV) chamber size, wall thickness, and mass (3–5). Because the ratio of LV wall thickness to radius is unchanged, the athlete’s heart is classified as eccentric LV hypertrophy. These adaptations can help satisfy the increased cardiac demands placed during exercise and enhance cardiac function (e.g., LV diastolic filling) in the resting condition (3–5). Thus, exercise training brings beneficial adaptations for cardiovascular system. However, the molecular mechanisms of these exercise training–induced adaptations are unclear.
Cardiac myocytes (6) and endothelial cells (7) produce endothelin (ET)-1. In addition to its potent vasocontractile effects (7), ET-1 has potent positive inotropic and chronotropic effects on isolated heart muscles (8, 9) and induces myocardial cell hypertrophy (10). Several studies have reported that the production of ET-1 was markedly increased in some cases of pathologic cardiac hypertrophy (11–14). These findings suggested that increased ET-1 in the heart participated in a formation of the pathologic cardiac hypertrophy. On the other hand, exercise training induces a physiologic cardiac hypertrophy (1, 2). However, the implication of ET-1 in the heart of rats during the formation of exercise training–induced physiologic cardiac hypertrophy remains to be elucidated.
Because ET-1 upregulates cardiac hypertrophic signaling, we hypothesized that myocardial ET-1 is involved in the formation of exercise-induced cardiac hypertrophy. The present study investigated whether messenger RNA (mRNA) expression and tissue peptide levels of ET-1 in the heart of rats increase during a formative process of exercise training–induced cardiac hypertrophy. The present study tested our hypothesis by using the hearts of rats that were exercise-trained for 4 weeks (treadmill running), in which physiologic cardiac hypertrophy is not yet induced; rats that were exercise-trained for 8 weeks, in which cardiac hypertrophy is exhibited; and sedentary control rats for 4 weeks or 8 weeks.
Materials and Methods
Animals and Protocol.
The experimental protocols were approved by the Committee on Animal Research at the University of Tsukuba. Male 4-week-old Sprague-Dawley rats (body weight, 69.1–74.9 g) were obtained from Charles River Japan Inc. (Yokohama, Japan) and cared for according to the Guiding Principles for the Care and Use of Animals based on the Helsinki Declaration of 1964. These rats were maintained on a 12:12-hr light:dark cycle and received food and water ad libitum. Each group of 10 rats underwent 4 weeks (4WT) or 8 weeks (8WT) of a treadmill running protocol, according to the method described in our previous papers (15, 16). The rats were trained for 5 days/week on a motor-driven treadmill for 15 mins/day at 15 m/min for the first 2 days. Duration and intensity increased daily during the first week, until the animals were running for 60 mins at 30 m/min, at a 0% grade. Thereafter, exercise intensity was kept constant at this level for the remainder of the training. An additional 20 rats were confined to their cages for 4 weeks (4WC) or 8 weeks (8WC), but were handled daily. All of the post-training measurements in the exercise-trained group were performed 48 hrs after the last exercise bout, to avoid acute effects of exercise. After the body weight and hemodynamic measurements, the whole heart was rapidly excised and washed thoroughly with cold saline to remove contaminating blood, and the left ventricle was separated from the right ventricle and atria. The left ventricle was weighed, frozen in liquid nitrogen, and stored for determination of the mRNA expression of ET-1 by real-time quantitative reverse transcriptase (RT) polymerase chain reaction (PCR) analysis and for measurement of tissue ET-1 levels by sandwich enzyme immunoassay (EIA). The soleus muscle was also excised, frozen in liquid nitrogen, and stored for measurement of citrate synthase activity. Sedentary rats in the 4WC and 8WC groups were killed at the same time point as the exercise-trained rats (4WT rats were 8 weeks old and 8WT rats were 12 weeks old).
Hemodynamic Measurements.
On the day of the experiment, systolic and diastolic arterial pressures and heart rates (HR) of the animals were measured using a tail-cuff sphygmomanometer (model MK-1030; Muromachi Kikai Co., Ltd., Tokyo, Japan). After these measurements, the rats were anesthetized with intraperitoneal administration of 40 mg/kg body weight pentobarbital sodium, and transthoracic echocardiography was performed with an echocardiographic system (SSD-900; Aloka, Tokyo, Japan) equipped with a 7.5-MHz convex scan probe, as previously described (17). LV end-diastolic diameter (LV-EDD), LV end-systolic diameter (LV-ESD), and LV wall thickness at end-diastole were measured. Stroke volume index (SVI) was calculated using the following formula: (LV-EDD)3 − (LV-ESD)3/body weight.
Muscle Oxidative Enzyme Activity.
Citrate synthase activity, a marker of mitochondrial content and training adaptation, was measured in the whole soleus muscle homogenate using the spectrophotometric method (17).
Quantitative Real-Time RT-PCR.
Total tissue RNA was isolated by acid guanidinium thiocyanate plus phenol plus chloroform extraction with Isogen (Nippon Gene, Toyama, Japan), according to the method described in our previous papers (17, 18). Briefly, the tissue was homogenized in Isogen (50 mg tissue/1 ml Isogen) with a Polytron tissue homogenizer (model PT10SK/35; Kinematica, Lucerne, Switzerland). Total RNA was extracted with chloroform, precipitated with isopropanol, and washed with 75% (v/v) ethanol. Total RNA was treated with an Rnase-free DNase kit (QIAGEN, Tokyo, Japan) and further purified with an RNeasy mini kit (QIAGEN). Single strand cDNA from prepared RNA (2 μg) was synthesized with omniscript reverse transcriptase (QIAGEN) using an oligo (dT) primer at 37° C for 60 mins.
The mRNA expression levels of ET-1 and β -actin were analyzed by real-time quantitative PCR with a TaqMan probe using an ABI Prism 7700 Sequence Detector (Perkin-Elmer Applied Biosystems, Foster, CA), as previously described (19). The gene-specific primers and TaqMan probes were synthesized from Primer Express v. 1.5 software (Perkin-Elmer), according to the published cDNA sequences for each of the following: ET-1 (20), and β -actin (21) mRNA. The sequences of the oligonucleotides were as follows: ET-1 forward: 5′-TCTACTTCTGCCACCTGGA-CAT-3′ , ET-1 reverse: 5′-GAAGGGCTTCCTAGTCCA-TACG-3′ ; ET-1 probe: 5′-CATCTGGGTCAACACTCC-3′ ; β-actin forward: 5′-GGCCGGGACCTGACA-3′ , β-actin reverse: 5′-GCTGTGGTGGTGAAGCTGTAG-3′ ; and β-actin probe: 5′-ACTACCTCATGAAGATCC-3′ .
The expression of β-actin mRNA was used as an internal control. The PCR mixture (25 μl total volume) consisted of 450 nM of both forward and reverse primers for ET-1 and β-actin (Perkin-Elmer), 200 nM of 6-carboxy-fluoresencin (FAM)-labeled primer probes (Perkin-Elmer), and TaqMan Universal PCR Master Mix (Perkin-Elmer). Each PCR amplification was performed in triplicate, using the following profile: 1 cycle of 95° C for 10 mins, 40 cycles at 94° C for 15 secs, and 60° C for 1 min. The quantitative value of ET-1 mRNA was normalized by that of β-actin mRNA expression.
Sandwich-EIA.
Concentrations of ET-1 in heart tissue extracts were determined using a sandwich-EIA Kit (Immuno-Biological Laboratories, Fujioka, Japan). The reported cross-reactivity of the antibody was ≤ 0.1% for all big ETs, ≤ 0.1% for ET-3, and 3.3% for ET-2. The assay procedure was carried out as previously described (11, 12).
Statistical Analysis.
Values are expressed as mean ± SE. Statistical analysis was carried out by analysis of variance followed by Scheffé’s F test for multiple comparisons. P < 0.05 was accepted as significant.
Results
There was no significant difference in body weight between 4WC and 4WT (Table 1). Body weight in the 8WT group was significantly lower than that in the 8WC group. LV weight mass index for body weight (LV mass index) in the 8WT group was significantly greater than that in the 8WC group, although there were no differences between the 4WC and 4WT groups in LV mass index (Table 1). LV wall thickness and SVI, measured by using echocardiography, in the 8WT group were significantly greater than those in the 8WC group, although there were no differences between the 4WC and 4WT groups (Table 1). There was no significant difference in resting HR between the 4WC and 4WT groups (Table 1). Resting HR in the 8WT group was significantly lower than in the 8WC group. There were no significant differences in resting systolic and diastolic arterial pressures among the 4WC, 4WT, 8WC, and 8WT groups (Table 1). Citrate synthase activity in the soleus muscle in the 8WT group was significantly greater than that in the 8WC group, although there were no differences between the 4WC and 4WT groups in citrate synthase activity (Table 1). These results indicated that the 8-week trained rats developed cardiac hypertrophy and exhibited physiologic effects of exercise training, whereas the 4-week trained rats did not yet have these adaptations.
There was no significant difference in mRNA expression of ET-1 in the heart between the 4WC and 4WT groups (Fig. 1). The mRNA expression of ET-1 in the heart was significantly higher in the 8WT than in the 8WC group (Fig. 1). The peptide levels of ET-1 in the heart are shown in Figure 2. There was no significant difference in the peptide level of ET-1 in the heart between the 4WC and 4WT groups (Fig. 2). The peptide level of ET-1 in the heart was significantly higher in the 8WT than in the 8WC group (Fig. 2).
Discussion
We demonstrated that myocardial ET-1 mRNA expression and tissue ET-1 concentration in the heart were increased by exercise training for 8 weeks, whereas these levels were not changed by exercise training for 4 weeks. In the present study, exercise training for 8 weeks induced cardiac hypertrophic adaptations, as evidenced by significant increases in LV mass index, LV wall thickness, and SVI, and decreases in resting HR, although these parameters did not change with exercise training for 4 weeks. Therefore, exercise training for 8 weeks brings physiologic adaptations for cardiac morphology and function. ET-1 is produced by cardiac myocytes (6). ET-1 has potent positive inotropic and chronotropic effects on the heart (8, 9) and induces myocardial cell hypertrophy (10). The present study suggests that time-course alteration of myocardial ET-1 production corresponds with formation of exercise training–induced cardiac hypertrophy. Thus, the exercise training–induced change in myocardial ET-1 production may participate in a mechanism of exercise training–induced cardiac adaptation (e.g., cardiac hypertrophy).
Pressure overload–induced pathologic cardiac hypertrophy in a rat model of aortic banding increased gene expression and production of ET-1 in the heart (14, 22, 23). The present study showed that exercise training for 8 weeks increased mRNA and peptide levels of ET-1 in the heart. ET-1 in the heart activates mitogen-activated protein kinase signaling pathway via the activation of GTP-binding protein (24, 25), thereby resulting in cardiac myocyte hypertrophy (26, 27). Therefore, it is considered that myocardial ET-1–mediated activation in cellular signaling participates in a mechanism for the formation of the “athletic heart.” The present findings indicate that exercise training–induced alteration of myocardial ET-1 production may participate in a formation of physiologic cardiac hypertrophy, and that ET-1 may be a common mechanism implicated in both pathologic and physiologic cardiac hypertrophy.
We previously demonstrated that mRNA expression of preproET-1 in rat heart was not changed by exercise training for 15 weeks, in which case, the rats developed physiologic cardiac hypertrophy and enhanced of cardiac function (18). The present study revealed that exercise training for 4 weeks did not exhibit cardiac adaptations with unchanged ET-1 production in the heart, whereas exercise training for 8 weeks induced increases in mRNA and peptide levels of ET-1 in the heart, with development of physiologic cardiac hypertrophy. These observations suggest that exercise training–induced alteration of ET-1 production may be an essential cellular regulation in the early stage of formation in physiologic cardiac hypertrophy.
The mechanism underlying the increase in the production of ET-1 in the heart by exercise training remains to be elucidated. We previously reported that mRNA expression of preproET-1 and peptide ET-1 concentration in rat heart were increased immediately after and during the recovery period after acute running exercise (28, 29). We also reported that plasma levels of ET-1 were increased immediately after, 30 mins after, and 60 mins after endurance exercise in humans (30). Therefore, it is possible that chronic repeated intermittent upregulation of ET-1 production in the heart by a bout of exercise results in the exercise training–induced increase in mRNA and peptide levels of ET-1 in the heart.
In conclusion, we demonstrated that mRNA and peptide levels of ET-1 in the rat heart were increased by exercise training for 8 weeks, although exercise training for 4 weeks did not change the myocardial ET-1 production. The present study suggests that an alternation of myocardial ET-1 production corresponds with formation of exercise training–induced cardiac hypertrophy. Thus, the exercise training–induced change in myocardial ET-1 production may participate in a mechanism of exercise training–induced cardiac adaptation (e.g., cardiac hypertrophy).
Selected Characteristics of Sedentary Control and Exercise-Trained Rats a
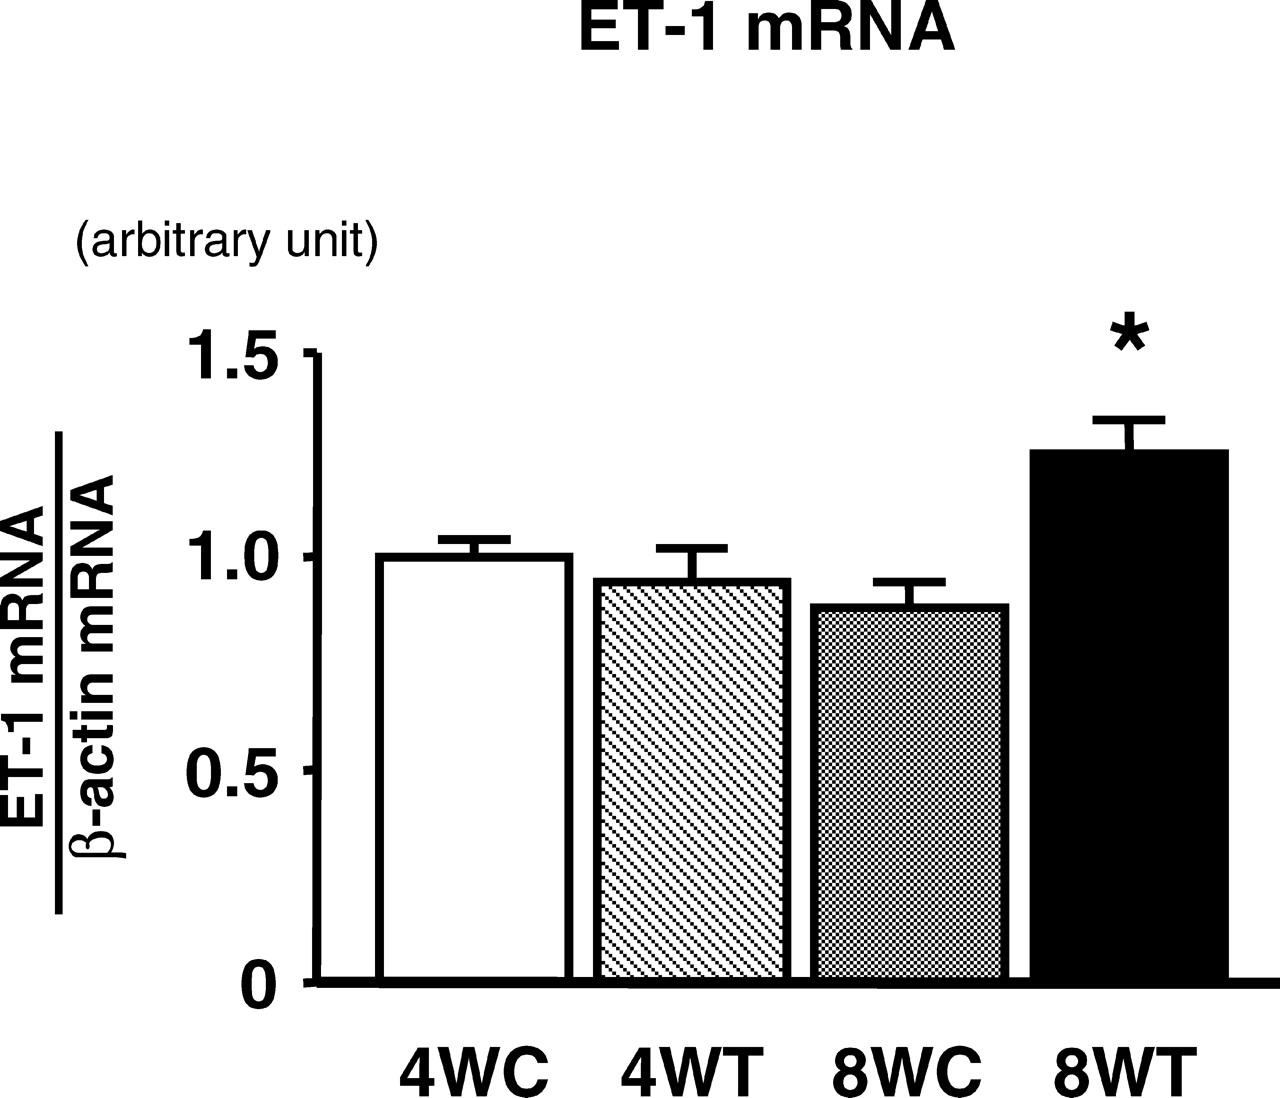
Expression of ET-1 mRNA in the heart (left ventricle) of exercise-trained rats for 4 weeks (4WT; n =10) and 8 weeks (8WT; n = 10); and sedentary control rats for 4 weeks (4WC; n = 10) and 8 weeks (8WC; n = 10). Expression of ET-1 mRNA in the heart was analyzed by real-time quantitative PCR. The expression of β-actin mRNA was determined as an internal control. The ratio of ET-1 mRNA to β-actin mRNA was calculated. The level of expression of ET-1 mRNA was normalized by that of β-actin mRNA. Data are expressed as mean ± SE. *P < 0.05 vs. 4WC, 4WT, and 8WC groups.
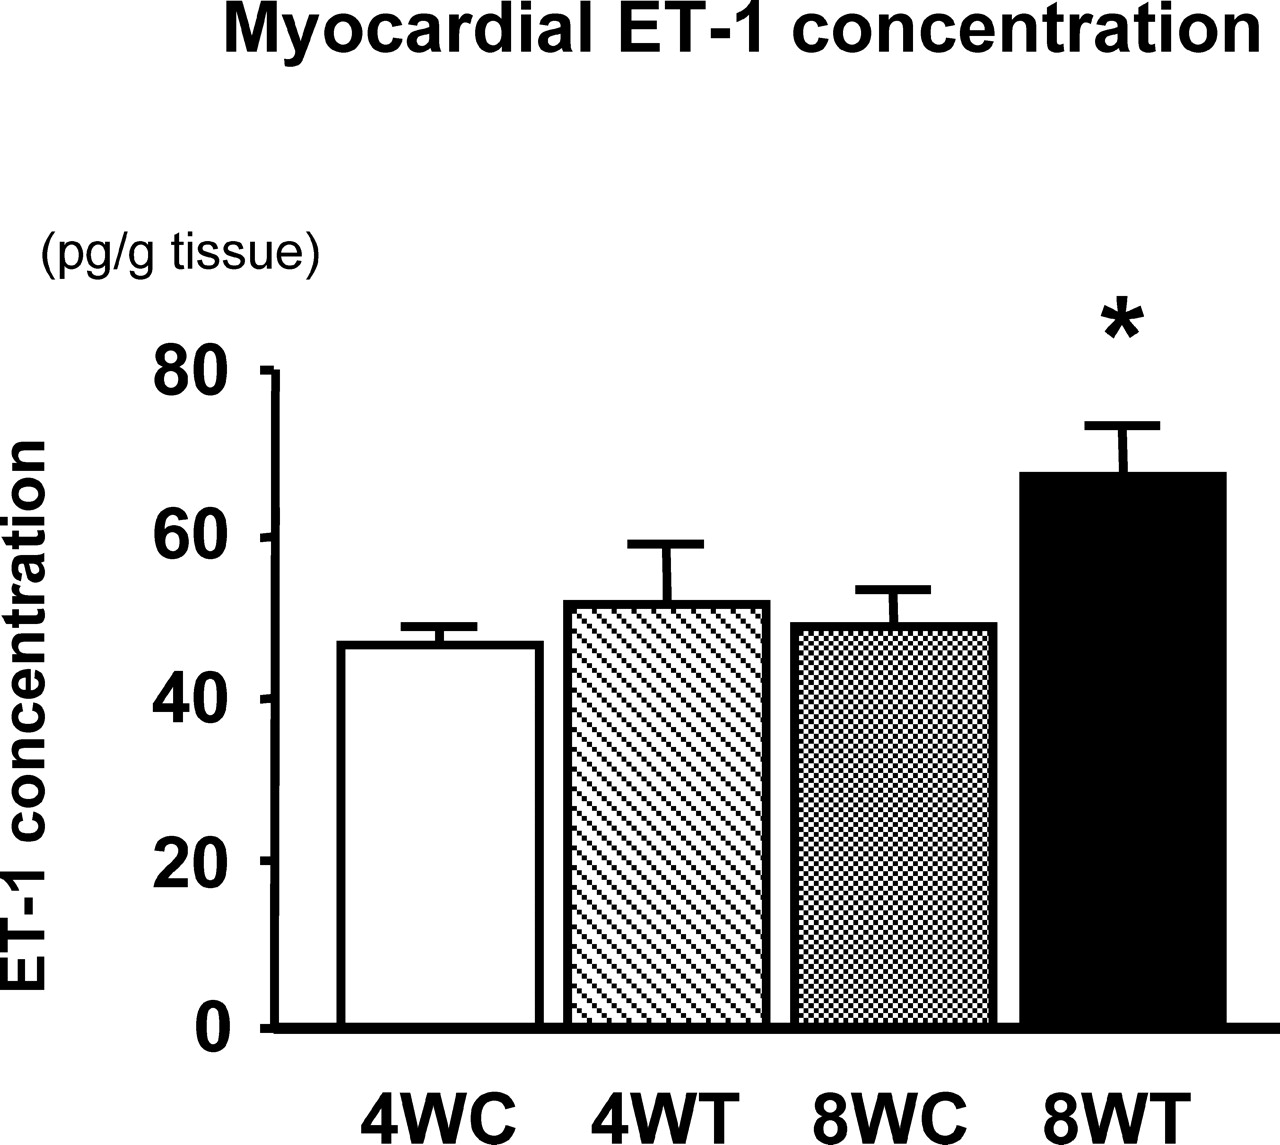
Peptide levels of ET-1 in the heart (left ventricle) of exercise-trained rats for 4 weeks (4WT; n =10) and 8 weeks (8WT; n = 10); and sedentary control rats for 4 weeks (4WC; n = 10) and 8 weeks (8WC; n =10). Data are expressed as mean ± SE. *P < 0.05 vs. 4WC, 4WT, and 8WC groups.
Footnotes
This work was supported by grants-in-aid for scientific research from the Ministry of Education, Science, Sports and Culture of Japan (15390077, 15650130, 16500391, and 17700484).