




Abstract
Real-time confocal particle tracking (CPT) was used to compare the transport and trafficking of polyethylenimine (PEI)/DNA nanocomplexes to that of efficient adenoviruses in live primary neurons. Surprisingly, the quantitative intracellular transport properties of PEI/DNA nonviral gene vectors are similar to that of adenoviral vectors. For example, the values of individual particle/virus transport rates and the distributions of particle/virus transport modes (i.e., the percentage undergoing active, diffusive, or subdiffusive transport) largely overlapped. In addition, both PEI/DNA vectors and adenoviruses rapidly accumulated near the cell nucleus in primary neurons despite our finding that PEI/DNA move slower in neurites than in the cell body, whereas adenoviruses move with equal rates in either location. The intracellular trafficking pathways of PEI/DNA and adenoviruses, however, were substantially different. The majority of PEI/DNA trafficked through the endolysosomal pathway so as to end up in late endosomes/lysosomes (LE/Lys), whereas adenoviruses efficiently escaped endosomes. This result suggests that the sequestration of nonviral gene vectors within acidic vesicles may be a critical barrier to gene delivery to primary neurons in the central nervous system (CNS).
Introduction
Delivery of therapeutic genes into the central nervous system (CNS) represents a relatively new approach to combat brain-related diseases, such as neurodegenerative disorders and brain tumors (1–3). Various viral gene vectors, including adenovirus (4), adeno-associated virus (5), and herpes simplex virus (6), have demonstrated efficacy in delivering genes into cells within the CNS. However, safety and other concerns related to viral vectors may limit their widespread use (7).
The use of synthetic gene delivery vectors, such as polymer-based systems, may overcome many of the problems intrinsic to viral vectors (8). Polyethylenimine (PEI) is among the most efficient polymers used to deliver genes into various cell types, including primary neurons (9–14). PEI can condense relatively large cargo genes into small nanoparticles (15), protect DNA from degradation by nucleases (16), and has been hypothesized to escape endosomes using a proton-sponge effect (17, 18). Recently, several groups have shown that PEI-based gene vectors can deliver therapeutic genes to the CNS (11, 19, 20). Nonviral gene vectors, however, exhibit substantially lower transfection efficiency in the CNS compared to viral vectors (21, 22). Intracellular barriers may contribute to the suboptimal performance of nonviral gene vectors (8, 23).
In this paper, we compared the intracellular transport of synthetic PEI/DNA nanocomplexes to that of adenoviruses in primary neurons. Through this comparison, we sought to uncover mechanistic differences and similarities in the intracellular behavior of highly efficient viruses compared to one of the most efficient nonviral systems used currently.
Materials and Methods
Primary Neuron Cell Culture.
Rat embryonic brains were kindly provided by Dr. Suk Jin Hong and Professor Ted Dawson (Department of Neuroscience, Johns Hopkins University). Cells were isolated by treating the brain tissue with trypsin/EDTA for 20 mins at 37°C. Trypsinization was halted by adding neuron-plating media (Dulbecco’s modified Eagle’s medium [Invitrogen, Carlsbad, CA], supplemented with 20% fetal bovine serum [Invitrogen], penicillin [100 units/ml, Invitrogen], and streptomycin [100 g/ml, Invitrogen]). Approximately 5 × 10⁵ cells were seeded per 35-mm glass-bottom dish (MatTek Corp., Ashland, MA) coated with poly-
Fluorescent Labeling of Nanocomplexes.
Polyethylenimine (PEI; branched, MW = 25 kDa, Sigma) was fluorescently labeled with Oregon Green (OG) 488 (Molecular Probes, Eugene, OR) according to manufacturer’s protocol. OG-labeled PEI was purified by size exclusion chromatography using Sephadex G-75 (Sigma), and its concentration was determined by trinitrobenzene-sulfonic acid (TNBS; Sigma) assay (24). To make PEI/DNA nanocomplexes, PEI was added to 2.5 μg of salmon DNA (Sigma) (all solutions in 150 mM NaCl) at an N:P (nitrogen to phosphate ratio) equal to 20. The mixture was vortexed briefly and incubated for 30 mins at room temperature. Following the complex formulation, the particle size and the zeta potential were measured using Zetasizer 3000HS (Malvern Instruments Inc., Southborough, MA). The size and zeta potential of PEI/DNA nanocomplexes were 143 ± 36.1 nm in diameter and 29.3 ± 2.3 mV, respectively. Nanocomplexes made with various plasmid DNA exhibited similar properties (data not shown).
Fluorescently Labeled Adenovirus.
Green fluorescent protein–labeled recombinant adenovirus serotype 5 (2.2 × 10¹⁰ viral particles/ml) was constructed and provided by Professor David Curiel (University of Alabama) (25). The viruses were genetically labeled by fusing the viral capsid protein IX to enhanced green fluorescent protein. This labeling technique is advantageous in monitoring real-time intracellular behavior of adenoviruses because it retains the full functionality of virions, and the labeled protein is known as one of the last components to leave the capsid during the disassembly process (26). Viruses were kept at −80°C until use.
Confocal Microscopy and Multiple Particle Tracking.
Either adenoviruses (multiplicity of infection [MOI] = 80) or PEI/DNA nanocomplexes were added to neurons and incubated at 37°C for 1 hr. Cells were washed twice with phosphate-buffered saline (PBS) and cell growth media were added prior to observation. The intracellular transport of gene vectors was quantified with confocal particle tracking (CPT) 1 . Briefly, samples were excited with 488-nm laser, and 20-sec movies were acquired at 20 frames per second employing a confocal microscope (LSM 510 Meta, Zeiss, Thornwood, NY) equipped with a 100X/1.4 NA oil-immersion lens. Cells were maintained at 37°C during the observation using an airstream stage incubator (Nevtek, Burnsville, VA). Movies were analyzed with MetaMorph software (Universal Imaging Co., Downing-town, PA) to obtain real-time x-positional and y-positional data over time. Particle mean square displacement (MSD) and effective diffusivity (Deff) were then calculated as previously reported (27, 28). MSD and Deff of individual gene vectors in 2-dimensional space are
Suh J, An Y, Tang B, Hanes J. Real-time DNA polyplex tracking in the endolysosomal pathway of live cells. Submitted.
where τ is time scale. We assumed that the cell cytoplasm is locally isotropic, in which case 2-dimensional diffusivity values are identical to 3-dimensional diffusivities (29). Bulk transport properties were obtained by ensemble-averaging individual transport rates. The reader is referred to a recent review for details related to particle tracking in live cells (29).
We fluorescently labeled the PEI component of PEI/DNA nanocomplexes. We have previously shown that intracellular transport properties of PEI/DNA nanocomplexes and free PEI are nearly identical in terms of quantitative transport rates and percentage localization within the endolysosomal pathway. 2
An Y. Real-time intracellular trafficking of DNA-loaded polymer nanoparticles. Master’s thesis, Johns Hopkins University, Baltimore, MD, 2005.
Determination of Tracking Resolution.
The particle-tracking resolution of the setup used in this study is approximately 20 nm, as determined by fitting the MSD of polystyrene particles moving in a homogeneous medium (glycerol) to
where σ is the tracking resolution (29).
Classification of Transport Modes.
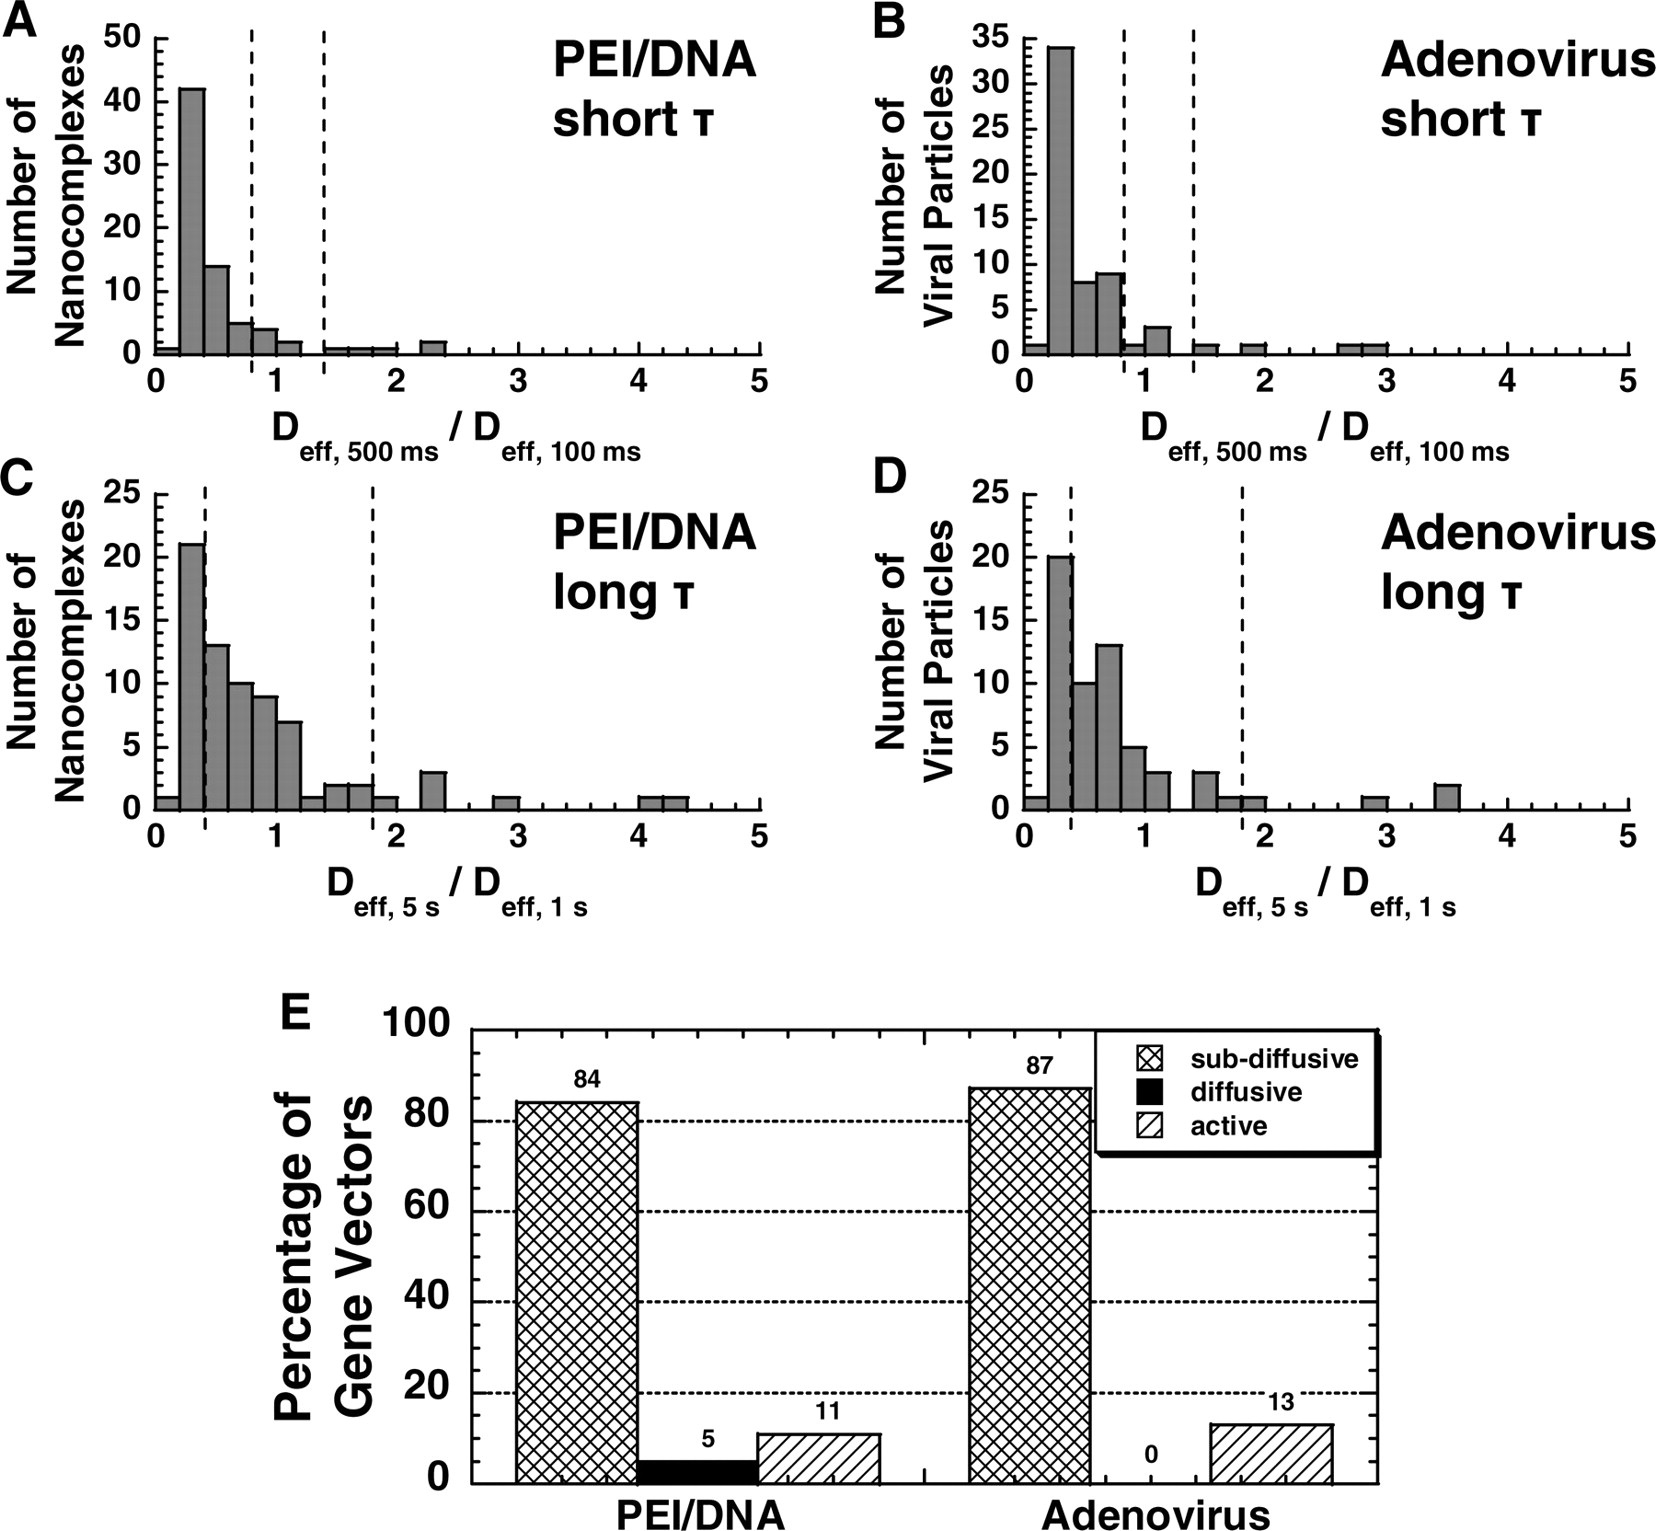
To determine the transport modes (i.e., diffusive, subdiffusive, or active) of individual gene vectors, a value called relative change (RC) is calculated for each particle as described elsewhere (30). Briefly, RC is defined as
where the reference τ is smaller than the probed τ. Thus, RC measures the relative change in Deff of an individual particle over time scale. First, a theoretical RC distribution of a population of purely diffusive particles is obtained by Monte Carlo simulation. Based on this distribution, upper and lower bounds are generated such that 95% of diffusive particles fall between these bounds. RC values of real gene vectors (i.e., PEI/DNA nanocomplexes or adenoviruses) are then calculated. The RC for the short time regime uses a reference τ of 100 msecs and a probed τ of 500 msecs, and that of the long-time regime is based on the reference τ of 1 sec and the probed τ of 5 secs. Gene vectors with an RC value between the upper and lower bounds are classified as diffusive, below the lower bound as subdiffusive, and above the upper bound as active. The overall transport mode of an individual vector is then determined from the modes of transport over the two-time regimes (short and long time scales).
Colocalization Study.
Either adenoviruses (MOI = 400) or PEI/DNA nanocomplexes were added to neurons and incubated at 37°C for 2 hrs. To fluorescently label late endosomes (LE) and lysosomes (Lys), LysoTracker Red (Molecular Probes, Eugene, OR) was added to cells at a final concentration of 100 nM 30 mins prior to observation. Cells were washed twice with PBS, and cell growth media were added prior to observation. Samples were excited with 488-nm and 543-nm lasers, and images of live cells were acquired employing a confocal microscope (LSM 510 Meta, Zeiss) equipped with a 100X/1.4 NA oil-immersion lens. Cells were maintained at 37°C during the observation using an airstream stage incubator (Nevtek). Colocalization of gene vectors and acidic vesicles were quantified on a per-pixel basis with MetaMorph software (Universal Imaging Co.).
Results
Transport Rates of PEI/DNA Nanocomplexes and Adenoviruses in Primary Neurons.
We sought to compare the intracellular transport of PEI/DNA nanocomplexes and adenoviruses in primary neurons. We used real-time CPT, which allows the quantitative transport rates and modes of transport of individual particles (PEI/DNA and adenovirus) to be determined in real-time with high spatiotemporal resolution. The ensemble-averaged transport rates of adenoviruses (n = 60 in 15 cells) and PEI/DNA nanocomplexes (n = 73 in 18 cells) were not statistically different 1 hr postaddition to primary neurons (Fig. 1A and B). At a time scale, τ, of 5 secs, the average effective diffusion coefficients (Deff) are 0.0019 μm2/sec for PEI/DNA nanocomplexes and 0.0028 μm2/sec for adenoviruses. Interestingly, both vector types experience a sharp decrease in the ensemble average Deff at short time scales (τ < 1 sec), which then approaches a plateau at long time scales (τ > 1 sec) (Fig. 1B).
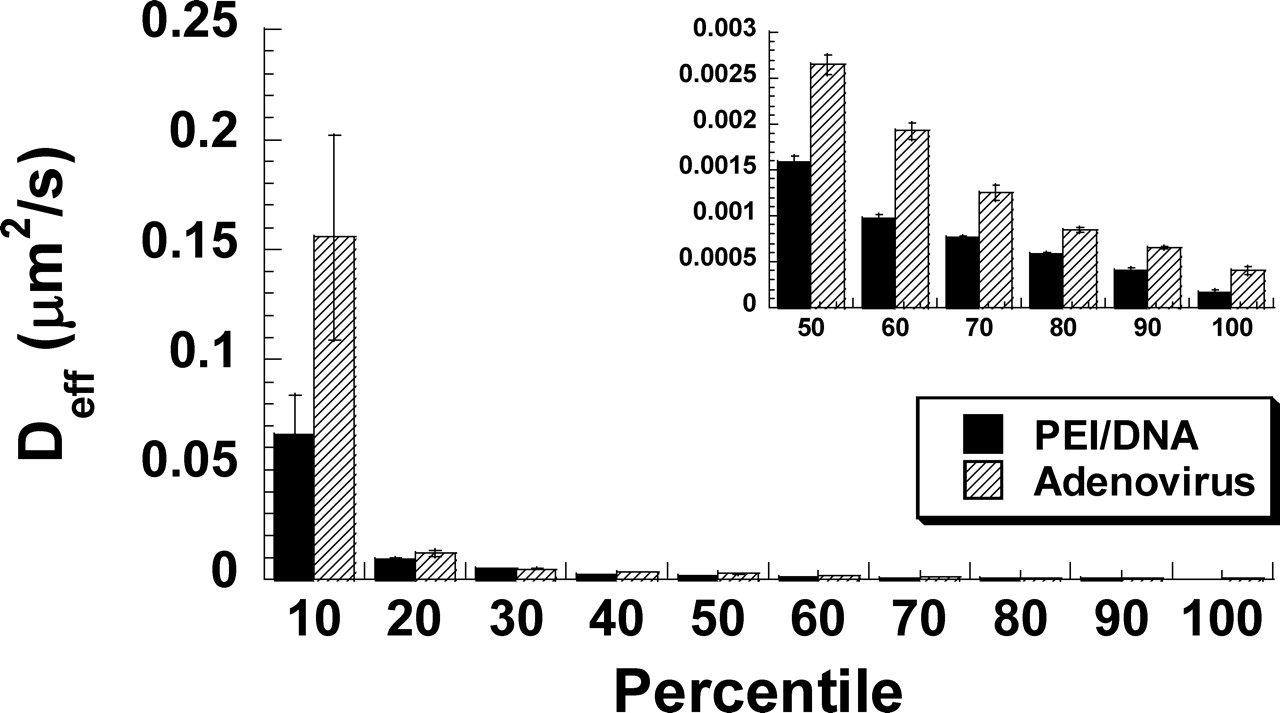
The difference in the average Deff between PEI/DNA nanocomplexes and adenoviruses is not statistically significant (as determined by Kruskal-Wallis test) because of a large overlap in Deff values for individual viral and nonviral gene vectors (Fig. 1C and D for τ = 500 msecs; Fig. 1E and F for τ = 5 secs). However, the distribution of diffusivities for adenovirus is shifted toward more rapid transport rate compared to PEI/DNA nanocomplexes (Fig. 1). To further investigate these differences, individual gene vector Deff (τ = 5 secs) values were ranked from highest to lowest values and divided into 10 subgroups. The first 10th percentile reflects the fastest 10% of each species, the 20th percentile represents the next 10%, and so forth. The average Deff for every 10th percentile of PEI/DNA nanocomplexes were then compared to that of adenoviruses (Fig. 2). Remarkably, adenoviruses exhibit higher average Deff compared to PEI/DNA nanocomplexes for every subgroup, and the differences are all statistically significant (P < 0.05, ANOVA).
Transport of Gene Vectors in Cell Bodies and Neurites.
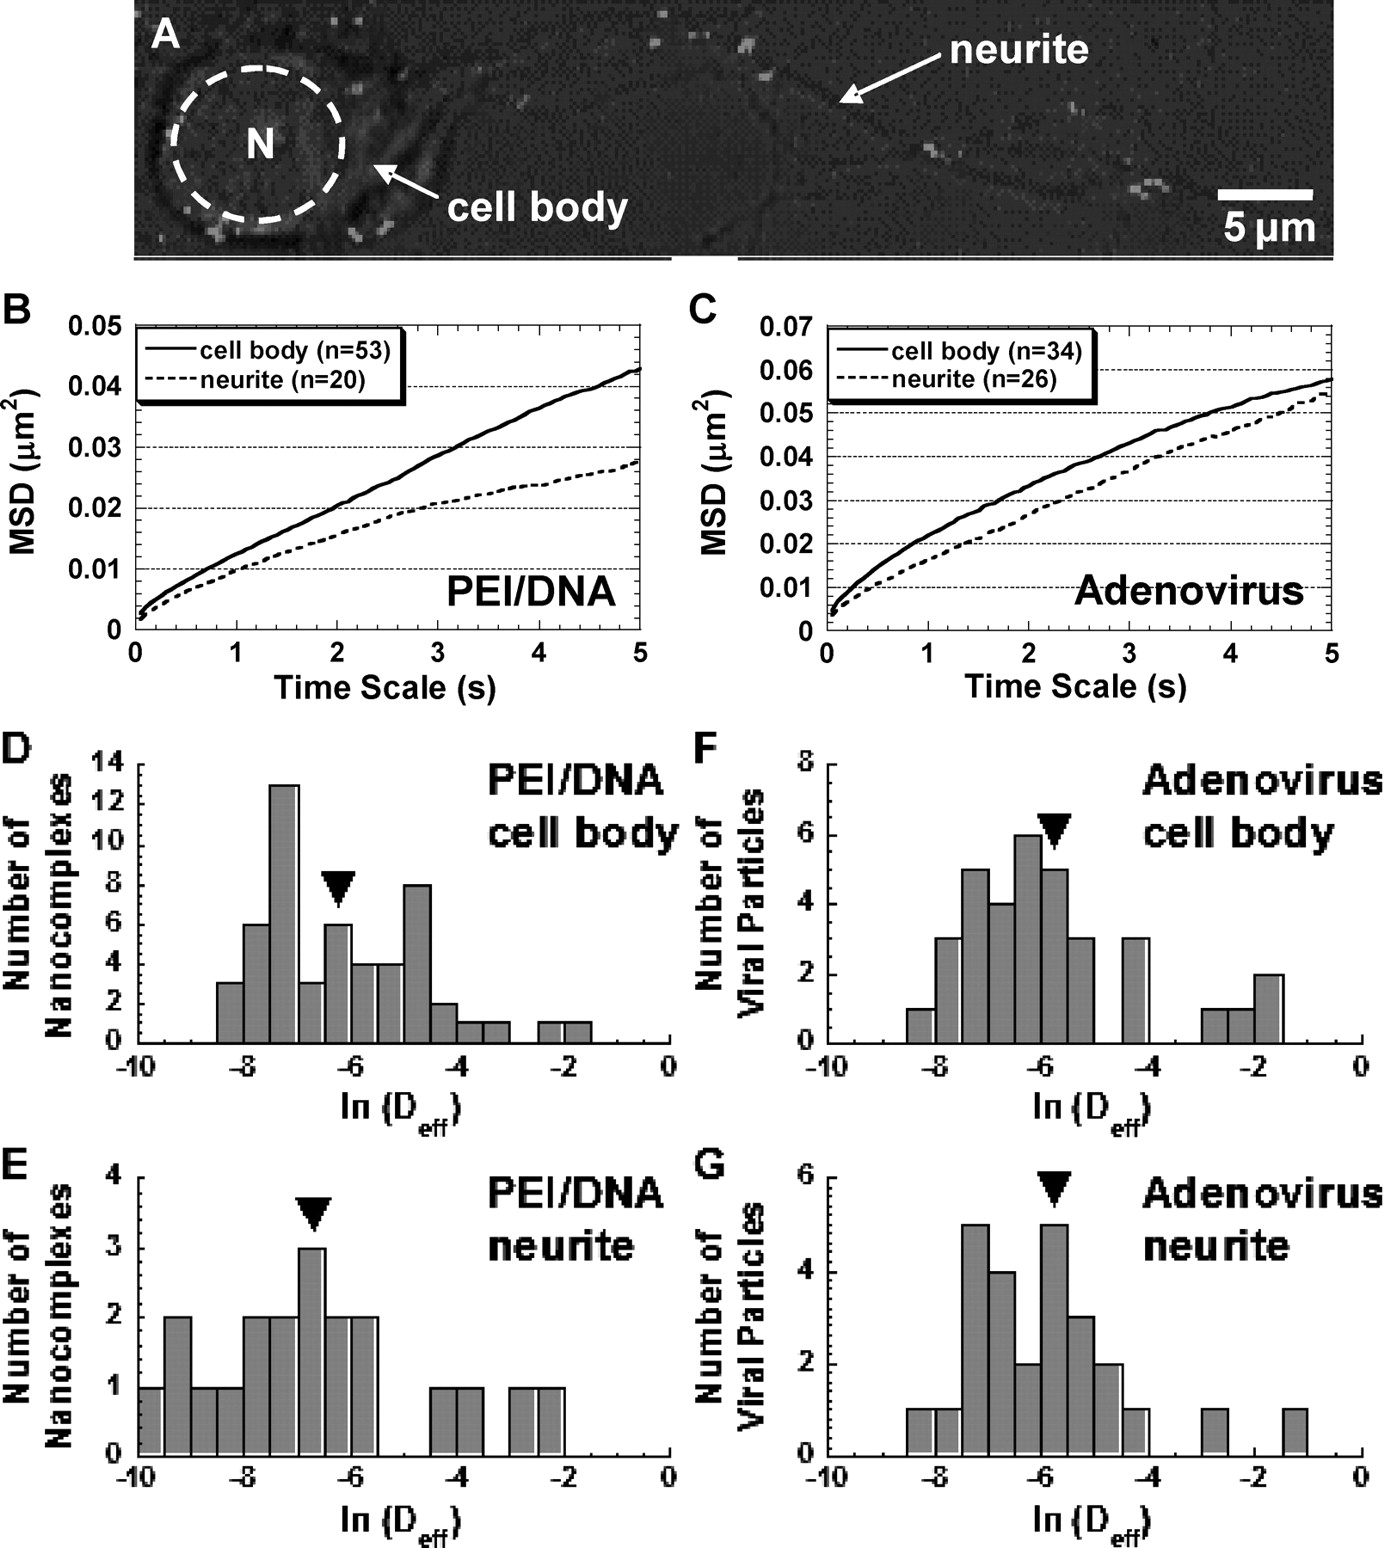
To determine if gene vector transport rates are affected by their intracellular location, gene vectors were classified by whether they were colocalized with cell bodies or neurites of primary neurons (Fig. 3A). PEI/DNA nanocomplexes within cell bodies achieve approximately 1.5-fold greater average transport rates (as measured by ensemble average mean square displacement <MSD> at a time scale of 5 secs) than those associated with neurites (Fig. 3B), whereas adenoviruses in either biological location display similar ensemble MSD over time scale (Fig. 3C). The average Deff of PEI/DNA nanocomplexes in cell bodies is not statistically different than that in neurites (Fig. 3D and E) owing to the large variation in particle transport rates in both locations. However, 20% of PEI/DNA complexes associated with neurites (left tail of distribution in Fig. 3E) exhibit smaller Deff values than the slowest complexes within cell bodies (Fig. 3D). For adenoviruses, distributions of Deff are similar in both cell bodies and neurites (Fig. 3F and G).
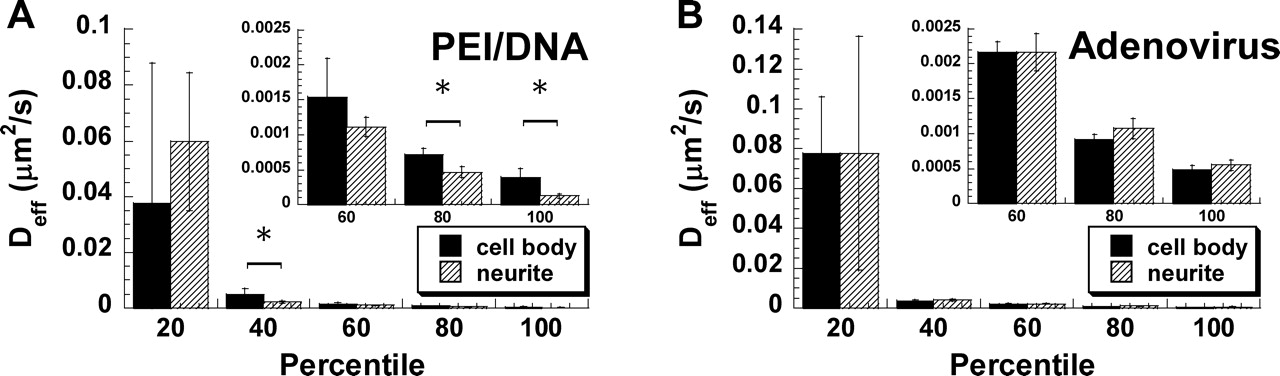
To further investigate the heterogeneity in gene vector transport rates colocalized with cell bodies and neurites, gene vectors in these two regions were divided into subgroups according to highest to lowest Deff values (Fig. 4). The top 20th percentile represents the fastest 20% of gene vectors, and so forth. The average Deff values are significantly higher for PEI/DNA nanocomplexes within cell bodies compared with vectors associated with neurites for the majority of the subgroups (i.e., 40th, 80th, and 100th percentiles) (Fig. 4A). Thus, the intracellular transport of nonviral PEI/DNA nanocomplexes is affected by their location in neurons. In comparison, adenoviruses demonstrate similar average Deff for cell bodies and neurites for every subgroup (Fig. 4B).
Transport mode of Gene Vectors.
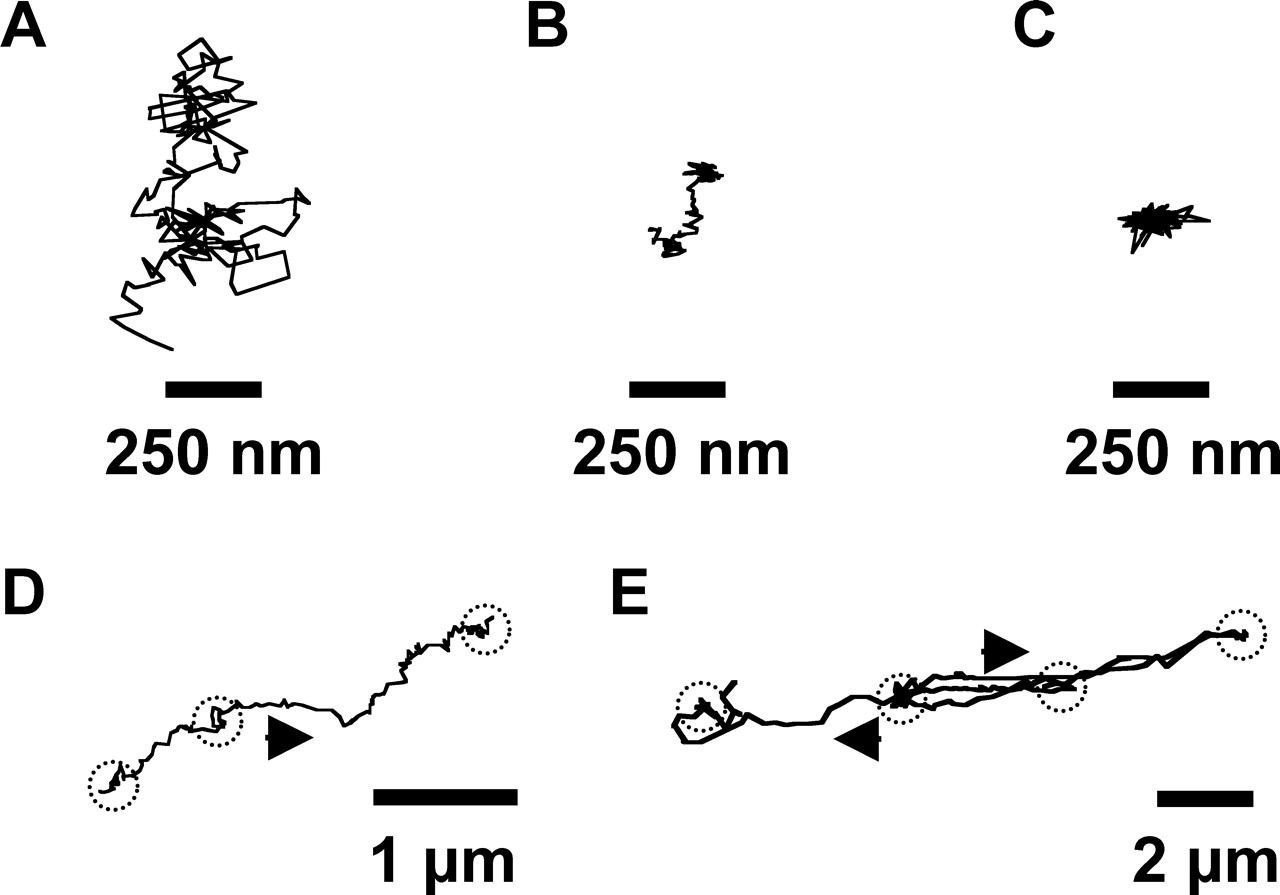
Figure 5 depicts the example trajectories of PEI/DNA nanocomplexes (Fig. 5A, B, and D) and adenoviruses (Fig. 5C and E) in neurons. Diffusive gene vectors exhibit unhindered, random motion (Fig. 5A). Subdiffusive gene vectors, however, show hindered motion within a confined area (Fig. 5B and C). Interestingly, several vectors in this category exhibit partial free motion during the observation, which may be caused by transient liberation from the intracellular structures (Fig. 5B). Actively transported gene vectors display directed and saltatory motions (Fig. 5D and E). The mode of transport (subdiffusive, diffusive, or active) of dozens of individual viral and nonviral gene vectors was categorized by calculating the relative changes (RC) in Deff of individual PEI/DNA nanocomplexes and adenoviruses at short (τ = 500 msecs) and long (τ = 5 secs) time scales (Fig. 6; see Materials and Methods for classification of transport modes) (30). The transport of subdiffusive gene vectors may be restricted by the cage-like structure of cytoplasmic microdomains or by transient gene carrier adsorption to relatively immobile intracellular structures. Diffusive vectors undergo unrestricted, thermally driven Brownian motion. Finally, actively transported vectors likely travel along microtubules (MT) in a motor protein-dependent manner (27).
The majority of both viral and nonviral gene vectors undergo subdiffusive transport at short time scales (Fig. 6A and B), while most gene vectors are diffusive at long time scales (Fig. 6C and D). Taking into account the modes of particle transport at both short and long time scales, the overall transport modes of individual gene vectors are then determined (30). More than 80% of both adenoviruses and PEI/DNA nanocomplexes exhibit overall subdiffusive transport, and 11% of PEI/DNA nanocomplexes and 13% of adenovirus are actively transported at any given time postcell entry (Fig. 6E).
Transport Mechanism of Gene Vectors in Primary Neurons.
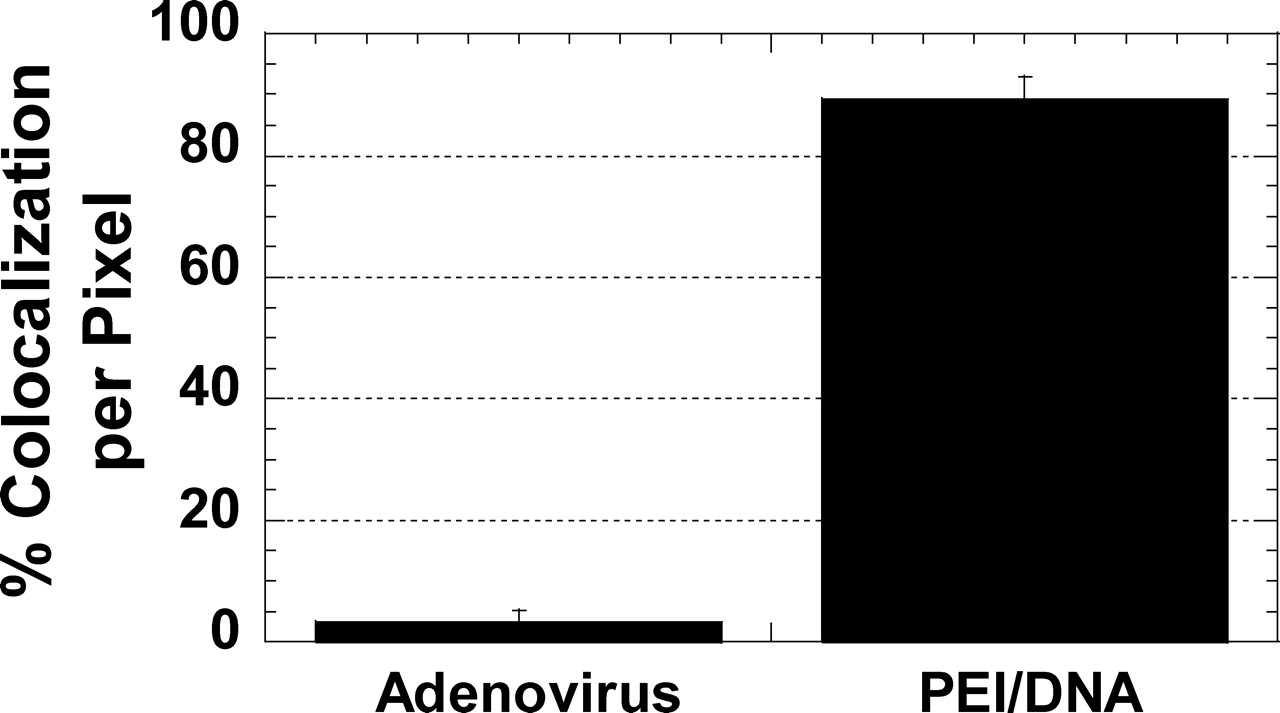
To determine if the transport mechanism of nonviral PEI/DNA nanocomplexes differ from that of adenoviruses, colocalization studies of gene vectors with LE/Lys were performed. Greater than 85% (on a per-pixel basis) of PEI/DNA nanocomplexes colocalize with LE/Lys in primary neurons at 2 hrs post-transfection, whereas less than 5% of adenoviruses colocalize with LE/Lys (Fig. 7). The difference in colocalization is statistically significant (P < 0.05, ANOVA).
Discussion
Successful gene delivery may require efficient transport of gene vectors through the molecularly crowded cytoplasm to reach the cell nucleus (8, 27, 31, 32). Viruses are known to take advantage of the cellular machinery to be actively transported within mammalian cells (33–36), which may partly explain their high efficiency. Recently, our group revealed that nonviral gene vectors can also transport efficiently toward the cell nucleus along MT in cell lines (27–29). Here, we directly compare, both qualitatively and quantitatively, the real-time intracellular transport properties of adenoviruses and synthetic PEI/DNA nanocomplexes for the first time; this comparison is made in neurites and cell bodies of primary neurons. Our goal was to determine if differences in particle transport through the cell cytoplasm might help to explain the discrepancy in gene delivery efficiency between viral and nonviral vectors in primary neurons.
The most remarkable difference observed in the intracellular transport between efficient adenoviruses and inefficient PEI/DNA nanocomplexes is the sequestration of nonviral vectors in cellular vesicles of the endolysosomal pathway. The vast majority of PEI/DNA nanocomplexes (85% on a per-pixel basis) are found in LE/Lys of primary neurons (2 hrs post-transfection), whereas less than 5% of adenoviruses experience the same fate. Per-pixel colocalization underestimates the amount of gene vectors colocalized with cellular vesicles (i.e., colocalization of PEI/DNA vectors with acidic vesicles is higher than 85% if the analysis is done through visual inspection on a per-particle basis). After endocytosis, adenoviruses escape endosomes rapidly in a pH-dependent manner (37). The binding of adenovirus penton base proteins to cell integrins is suggested to facilitate endosome escape (37). PEI/DNA nanocomplexes are hypothesized to escape endosomes via a proton-sponge effect (15, 32); however, our data suggest endosome escape is rare in primary neurons within 2 hrs. Recently, we observed similarly high levels of PEI/DNA nanocomplex colocalization with acidic vesicles 12 hrs post-transfection in differentiated SH-SY5Y neurotypic cells (38). Therefore, escape of gene vectors from membrane-bound cellular vesicles may be a critical bottleneck for efficient intracellular gene delivery with PEI/DNA nanocomplexes in primary neurons. The development of non-immunogenic endosomolytic molecules that can be conjugated to nonviral vectors is expected to vastly improve gene delivery efficiency (8).
Aside from this critical difference, viral and nonviral gene vectors share similar modes and rates of transport in neurons. Over 80% of both viral and nonviral gene vectors experience subdiffusive transport in neurons, suggesting their overall intracellular transport is impeded by steric obstacles in the cytoplasm or by transient or irreversible adhesion to intracellular structures (39, 40). Approximately 60% of gene vectors classified as subdiffusive undergo normal diffusion at long time scales (i.e., a large percentage of particles exhibit a transition from subdiffusive to diffusive behavior over time scale), indicating that the vectors may be able to move through the cytoplasm as the intracellular network shifts or relaxes (41), or as they desorb from intracellular structures.
Another similarity in the intracellular transport of gene vectors is that approximately 11%–13% of both adenoviruses and PEI/DNA nanocomplexes are actively transported in primary neurons. Adenoviruses are known to associate with motor proteins, travel along MT toward the cell nucleus in a directed fashion (34), and display saltatory motion (42); however, these properties have not been demonstrated in primary neurons to our knowledge. Previous work in our group demonstrated that approximately 17% of nonviral PEI/DNA nanocomplexes are actively transported in a MT-dependent manner within live COS-7 cells (27). Therefore, transport of viral and nonviral carriers is similar in primary neurons and standard cell lines, such as COS-7 cells.
The average transport rate of actively transported adenoviruses was similar to that of actively transported PEI/DNA nanocomplexes (difference not statistically significant, data not shown). Thus, despite being in different cytoplasmic compartments (i.e., adenoviruses outside of acidic vesicles and PEI/DNA nanocomplexes inside LE/Lys), both viral and nonviral gene vectors are able to exploit the intracellular transport machinery to be actively transported in primary neurons. Ensemble transport properties, however, are only one reflection of the population of gene vectors, and important information can be obtained from studying the heterogeneity in particle transport rates (27, 28). Although a majority of adenoviruses share similar intracellular transport rates with a majority of PEI/DNA nanocomplexes, outlying adenovirus particles exist that display faster transport rates than the fastest PEI/DNA particles. In addition, some outlying PEI/DNA nanocomplexes exhibit slower transport rates than the slowest adenoviruses. These differences may be caused by the intracellular regions in which the gene vectors reside within the primary neurons. Specifically, neurons consist of two spatially distinct regions: cell bodies and neurites. Adenoviruses display similar Deff whether they are in the cell body or the neurite. Interestingly, 20% of PEI/DNA nanocomplexes within neurites exhibit transport rates lower than the lowest Deff seen for nanocomplexes in the cell body. Because PEI/DNA nanocomplexes used in the study are approximately 2-fold larger in size than adenoviruses (43), they may experience greater hindered motion in the limited cytoplasm of neurites. Another possible explanation is that some gene vectors (i.e., adenoviruses and PEI/DNA nanocomplexes) may be associated with the surface of the neurite plasma membrane without being successfully internalized. Although we have confirmed that gene vectors are localized within cell bodies of neurons during confocal imaging, 3-dimensional confocal imaging cannot resolve whether gene vectors colocalized with neurites are internalized or surface-associated. Interestingly, it has been suggested that enveloped viruses such as murine leukemia virus (MLV) and human immunodeficiency virus (HIV), experience rapid actin-mediated and myosin II-mediated transport toward internalization sites at cell body in 293 cells (44). It is not known whether adenoviruses may exploit this mechanism in neurons. Overall, slight differences in the intracellular transport rates of viral and nonviral gene vectors may be caused by the fact that adenoviruses are generally outside of acidic vesicles, whereas the vast majority of PEI/DNA nanocomplexes are within LE/Lys at 2 hrs transfection.
Because PEI/DNA nanocomplexes display overall intracellular transport rates similar to adenoviruses, the cytoplasmic transport of nonviral vectors toward the perinuclear region may not be limiting in primary neurons. However, gene vectors that reach the perinuclear region and successfully escape endosomes may still need to traverse the highly crowded cytoplasmic area surrounding the nucleus prior to reaching a nuclear pore complex (30).
In conclusion, sequestration of gene vectors within acidic vesicles, rather than transport of vectors toward the perinuclear region, may be a formidable barrier to successful gene delivery into neurons with nonviral PEI-based gene vectors. Improving the endosome escape ability of PEI/DNA nanocomplexes may substantially improve the performance of these vectors in differentiated primary neurons.
Intracellular transport of PEI/DNA nanocomplexes (solid lines, n = 73) and adenoviruses (dotted lines, n = 60) at 1 hr post-transfection/infection in primary neurons. (A) The ensemble (geometric mean) mean square displacement (<MSD>) of gene vectors with respect to time scale (τ). (B) The geometric mean effective diffusivity (<Deff>) of gene vectors with respect to time scale. Vertical dotted line separates the Deff curves roughly into two regimes. Distribution of natural logarithmic effective diffusivities (ln Deff) of (C) PEI/DNA nanocomplexes and (D) adenoviruses at τ = 500 msecs. Distribution of ln Deff of (E) PEI/DNA nanocomplexes and (F) adenoviruses at τ = 5 secs. The geometric means of Deff are indicated by ▾. Average effective diffusivity (<Deff>) of every 10th percentile of PEI/DNA nanocomplexes and adenoviruses at τ = 5 secs in primary neurons. Inset displays the data for slowest 50% of gene vectors. Differences in average Deff of all subgroups are statistically significant between PEI/DNA nanocomplexes and adenoviruses (P < 0.05, ANOVA). Intracellular transport of PEI/DNA nanocomplexes (n = 73) and adenoviruses (n = 60) in different intracellular locations (cell bodies [solid lines] or neurites [dotted lines]) of primary neurons. (A) Location of adenoviruses (white) within the cell body or the neurite of a primary neuron. Nucleus is indicated with dotted circle. (B) The ensemble (geometric mean) mean square displacement (MSD) of PEI/DNA nanocomplexes in cell bodies (n = 53) or neurites (n = 20) plotted against time scale (τ). (C) The ensemble (geometric mean) MSD of adenoviruses in cell bodies (n = 34) or neurites (n = 24) plotted against time scale. Distribution of natural logarithmic effective diffusivities (ln[Deff]) of PEI/DNA nanocomplexes within (D) cell bodies (n = 53) or (E) neurites (n = 20) at the time scale τ = 5 secs. Distribution of ln(Deff) of adenovirus within (F) cell bodies (n = 34) or (G) neurites (n = 26) at the time scale τ = 5 secs. Geometric means of Deff are indicated by ▾. Average Deff of every 20th percentile of (A) PEI/DNA nanocomplexes and (B) adenoviruses in cell bodies or neurites at τ = 5 secs. Inset displays the data for slowest 60% of gene vectors. Differences in average Deff are statistically significant for the samples indicated with an asterisk (*) (P < 0.05, ANOVA). Example trajectories of gene vectors in neurons. Trajectories of (A) a diffusive PEI/DNA nanocomplex, (B) a subdiffusive PEI/DNA nanocomplex, (C) a subdiffusive adenovirus, (D) an actively transporting PEI/DNA nanocomplex, and (E) an actively transporting adenovirus. Both directed and saltatory (indicated by dotted circles) motions are observed in actively transporting PEI and adenovirus gene vectors. Direction of arrows indicates the direction of active movement. Distributions of relative change (RC) for PEI/DNA nanocomplexes (n = 73) and adenoviruses (n = 60) at short and long time scales (τ). Distribution of RC for (A) PEI/DNA nanocomplexes and (B) adenoviruses at short time scales. Distribution of RC for (C) PEI/DNA nanocomplexes and (D) adenoviruses at long time intervals. For short time scale transport mode categorization (τ = 500 msecs), Deff of individual gene vectors at τ = 500 msecs are compared to Deff at τ = 100 msecs. For long time scale transport modes (τ = 5 secs), Deff of individual gene vectors at τ = 5 secs are compared to Deff at τ = 1 secs. Dotted lines are the upper and lower RC bounds that separate the transport mode of gene vectors into subdiffusive (left), diffusive (center), and active (right). (E) Categorization of overall transport modes of PEI/DNA nanocomplexes (n = 73) and adenoviruses (n = 60) based on relative change (RC) values at short and long time scales. Gene vectors are classified into transport modes as subdiffusive (crisscross), diffusive (solid), and active (hatched) modes of transport. Percentage of colocalization between gene vectors (PEI/DNA nanocomplexes or adenoviruses) and late ensosomes/lysosomes at 2 hrs post-transfection/infection, measured by percentage of overlapping pixels (n = 5 fields of view). The difference is statistically significant (P < 0.05, ANOVA).
Footnotes
Funding was provided by the National Science Foundation (BES 9978160 and 0346716), the National Institutes of Health (T32-GM07057), an Achievment Award for College Scientists fellowship to J.S., and a post graduate scholarship from the Natural Sciences and Engineering Research Council of Canada to S.K.L.
Acknowledgements
We thank Drs. Suk Jin Hong and Ted Dawson (Johns Hopkins University, Department of Neuroscience) for invaluable discussions and for providing rat embryonic brains. We are also grateful to Drs. Long Le and David Curiel (University of Alabama, Division of Human Gene Therapy) for providing labeled adenoviruses.