



Abstract
We have determined the variability of the monocyte proteome and identified those proteins that demonstrate the greatest variation in the general control population. Monocytes were isolated from 18 healthy (9 male and 9 female) donors ages 18–50 and with no known genetic or blood disorder. A combination of Ficoll-Paque PLUS density centrifugation of cells found in the buffy coat and positive selection with monoclonal antibodies against CD14, coupled to magnetic beads, led to >98% purity of monocytes. A 100,000 g microsomal membrane fraction or 100,000 g supernatant fraction from a control subject was compared to the equivalent fractions from a distinct control subject by two-dimensional differential gel electrophoresis (2D DIGE). Those protein spots that demonstrated Cy3-/Cy5- ratios greater than 2.5-fold in at least one experiment were selected for further statistical analysis. We determined variability for 31 cytosolic and 12 membrane protein spots. Proteins have been identified for 27 of the cytosolic protein spots and 9 of the microsomal membrane protein spots by in-gel digestion with trypsin followed by reverse-phase high-performance liquid chromatography in line with tandem mass spectrometry. We identified 24 distinct monocyte proteins that demonstrated the greatest variability in this general control population. The proteins demonstrating the greatest variance in the cytosolic fraction were enolase-1 and WD (tryptophan-aspartate) repeat-containing protein 1, and in the membrane fraction they were lamin B1 and L-plastin. This study demonstrates the importance of considering variance in the control population when performing future protein profiling comparisons of monocytes derived from disease versus control populations.
Introduction
Monocytes and tissue macrophages, along with lymphocytes and granulocytes, constitute the dynamic cell-mediated immunity system with an important immuno-regulatory role. Monocytes are the largest of the leukocytes and constitute about 5% of the white blood cell (WBC) population in peripheral blood. The monocyte life cycle is divided into four stages: development from precursor cells in bone marrow, circulation in the blood, migration into the tissues, and differentiation into macrophages (1). Blood monocytes in inflammatory conditions are known to become activated and to produce biologically active molecules, such as cytokines, chemokines, adhesion molecules, and enzymes (proteinases and proteinase inhibitors), which play a crucial role as signaling factors in many multifunctional diseases (2).
The basic scenario of inflammation at the affected site includes the release of cytokines interleukin-1 (IL-1) and tumor necrosis factor-α (TNF-α) by monocytes, which activate endothelial cells to increase expression of receptors and adhesion molecules vascular cell adhesion molecule-1 (VCAM-1), intercellular adhesion molecule-1 (ICAM-1), E-selectin, and L-selectin on the surface of various immune cells. They present pieces of pathogens to T cells so that the pathogens may be recognized again and killed. The levels of cytokines, chemokines, receptors, and adhesion proteins released by monocytes have been intensively studied in the case of many diseases, such as asthma (3); atherosclerosis (4); skin disorders (5); diabetes (6); osteoporosis (7); autoimmune disease (8, 9); and viruses associated disorders (10), cancers (11, 12), and sickle cell disease (13).
Increasingly proteomic approaches are being used to study changes in the monocyte proteome in various inflammatory diseases. Yet individuals who do not have any of the disorders listed above experience daily stresses that lead to inflammatory responses and changes in expression of the monocyte proteome. Recently, Jin et al. have established a two-dimensional gel proteome and phosphoproteome map of blood monocytes (14). They observed 1523–1769 protein spots, identifying 231 by matrix-assisted laser desorption/ionization time-of-flight (MALDI TOF)/TOF analysis, representing 164 distinct proteins. This was an important study that sets the stage for protein profiling studies on various inflammatory diseases. In the current protein profiling study, we provide the first analysis of how this monocyte proteome varies within the general control population.
Materials and Methods
Sample Preparation.
Human blood samples were collected from 18 healthy donors (9 male and 9 female, ages 18–50). Peripheral whole blood was collected in vacutainer tubes containing K3EDTA, sufficient for 10 ml of blood, and was used immediately after collection. The red blood cells (RBCs) were sedimented at 550 g for 20 mins at 20°C. Plasma was discarded, and the RBC pellet and buffy coat were diluted four times in 1× Dulbecco’s phosphate saline (without calcium chloride and magnesium chloride; Gibco, Carlsbad, California). Diluted cell suspension (35 ml) was carefully layered over 15 ml Ficoll Paque (1.077 density; Amersham Biosciences, Piscataway, NJ) and centrifuged at 400 g for 30 mins at 20°C. The mononuclear cell layer, at the interphase, was carefully transferred to a conical tube and washed two times with phosphate-buffered saline (PBS) buffer.
For removal of platelets, the cell pellet was resuspended in PBS and centrifuged at 200 g for 15 mins at 20°C. Most of the platelets remained in the supernatant upon centrifugation at 200 g. The cell pellet was resuspended in PBS buffer containing 2 mM EDTA and 0.5% bovine serum albumin (BSA). Cells were counted, and we then proceeded to magnetic labeling.
Magnetic Cell Sorting.
The CD14+ cells were magnetically labeled with CD14 MicroBeads using a monocyte isolation kit from Miltenyi Biotech (Auburn, CA). The suspension was loaded on a column, which was placed in the magnetic field of a magnetic cell sorting (MACS) separator. The magnetically labeled CD14+ cells were retained on the column. The unlabeled cells ran through, and this cell fraction was depleted of CD14+ cells. After removal of the column from the magnetic field, the magnetically retained CD14+ cells were eluted as the positively selected cell fraction. Monocyte purity in each cell preparation was evaluated by flow cytometry analysis (FACSCalibur; BD Biosciences, San Jose, CA).
Fractionation of Monocytes.
The method was a modification of that of Huber et al. (15). The cells were resuspended in buffer containing 250 mM sucrose, 3 mM imidazole, pH 7.4, 1 mM EDTA, and Complete Tab proteases inhibitor (Roche Diagnostic, Indianapolis, IN). The cells were homogenized with a Glas-Col motor homogenizer (Terre Haute, IN) on maximum speed (4000 rpm) on ice until the cell suspension became clear. The nuclei were pelleted at 800 g for 10 mins at 4°C, and the supernatant was centrifuged at 100,000 g at 4°C to obtain crude microsomal membrane and cytosolic fractions. Both the pellets of nuclei and membrane fraction were resuspended in extraction buffer containing: 20 mM HEPES, pH 7.0; 100 mM KCl; 1 mM dithiothreitol [DTT]; 2 mM MgCl2; 2% ASB-14 detergent, and proteases inhibitor tablet. Cytosolic and membrane fractions containing 150 μg and 200 μg, respectively, were purified using a 2D Clean-up Kit (Amersham Biosciences), and freeze-dried pellets were stored at −80°C.
Protein Labeling.
Cytosolic (40 μg) and membrane (50 μg) proteins solubilized in labeling buffer containing 30 mM Tris-HCl, pH 8.5, 7 M urea, 2 M thiourea, and 2% ASB-14 were minimally labeled with Cy3 or Cy5 fluorophores (Amersham Biosciences) according to the manufacturer’s protocol. The control proteins were derived from the blood samples collected from distinct healthy donors. Equal amounts of control proteins (40 μg cytosolic or 50 μg membrane fraction) were labeled with the two different fluorophores (Cy3 and Cy5, respectively). Both Cy3- and Cy5-labeled samples were mixed before separation on a 2D gel. To estimate the variance in expression in this control population, seven control-control experiments were carried out for cytosolic fraction, and six control-control experiments were performed for the membrane fraction.
2D Gel Electrophoresis.
A mixture of labeled proteins were separated by 2D gel electrophoresis, as we have described previously (16). The first dimension, isoelectric focusing (IEF), was performed with a 13-cm Immobiline DryStrip with a nonlinear pH 3–10 gradient using an Ettan IPGphor II (Amersham Biosciences) at 20°C. Immobiline strip rehydration was performed for 12 hrs in rehydration buffer (1% IPG buffer [Amersham Biosciences], pH 3–10 NL; 7 M urea; 2 M thiourea; 2% ASB-14; and 40 mM DTT) containing 80 μg of Cy3- and Cy5-labeled cytosolic or 100 μg of Cy3- and Cy5-labeled membrane proteins. IEF was performed in three steps: at 500 V for 1 hr, at 1,000 V for 1 hr, and at 8,000 V for 33,300 Vhr. Prior to the second dimension, the Immobiline strip was equilibrated and reduced in a solution containing 50 mM Tris-HCl, pH 8.5, 2% sodium dodecyl sulfate (SDS), 30% glycerol, and 5 mg/ml DTT at 90°C for 1 min. This was followed by equilibration and protein alkylation (carbamidomethylation) at room temperature in the Tris-HCl buffer containing 6 M urea, 2% SDS, 30% glycerol, and 20 mg/ml iodoacetamide for 10 mins. After equilibration and alkylation, the proteins separated by IEF were further separated by SDS-PAGE on a 10% polyacrylamide gel. The separation was performed in a Hoefer SE 600 unit (Amersham Biosciences) at 30 mA/gel constant current until the dye front migrated to the bottom of the gel. Where indicated, the gels were stained with Sypro Ruby (Molecular Probes, Eugene, OR) according to the manufacturer’s protocol.
Gel Image Analysis.
The separated proteins labeled with Cy3 and Cy5 fluorophores were detected in the 2D gels using a Typhoon 8600 and 2920 2D-Master Imager (Amersham Biosciences). After detection, the identical Cy3- and Cy5-labeled proteins migrating to the same 2D spot were quantified based on the corresponding fluorescence intensities, and their molar ratios were calculated using DeCyder Differential In-Gel Analysis software (Amersham Biosciences).
Protein Identification.
Selected 2D gel spots were analyzed for protein identification of corresponding tryptic peptides. The selected spots were excised from Sypro Ruby–stained 2D gels using an Ettan Spot Picker (Amersham Biosciences). Proteins in the excised gel pieces were digested using an in-gel trypsin digestion kit (Pierce, Rockford, IL), and corresponding tryptic digests were collected according to the manufacturer’s protocol. Peptides in each tryptic digest were separated and identified by liquid chromatography in line with tandem mass spectrometry (LC/MS/MS) and database search.
Mass Spectrometry.
The LC/MS/MS analysis was performed using a Surveyor high-performance liquid chromatography (HPLC) system connected through a PepFinder kit (with peptide trap and 99:1 flow splitter) to a LCQ DECA XP Ion Trap mass spectrometer with a nanospray ionization source (ThermoFinnigan, San Jose, CA). Peptides in the tryptic digest (10 μl) were separated by reverse-phase HPLC on a PicoFrit BioBasic C18 column (0.075 × 100 mm; New Objective, Woburn, MA) at 0.7 μl/ min flow rate. Water and acetonitrile with 0.1% formic acid each were used as solvents A and B, respectively. The gradient was started and kept for 10 mins at 0% B, then ramped at 60% B in 60 mins, and finally ramped to 90% B for another 15 mins. The eluted peptides were analyzed in data-dependent MS experiment (“big three”) with dynamic exclusion as previously described (17). The spray voltage was set at 1.6 kV; the ion transfer capillary temperature was set at 180°C.
Database Search.
The peptide sequence can be identified through interpretation of its MS/MS spectrum and similarity to the MS/MS spectrum of a known peptide sequence. Raw mass spectra were converted to DTA peak list using BioWorks Browser 3.1 (ThermoFinningan) with the following parameter settings: precursor mass ± 1.4 Daltons, total ion current (TIC) threshold 105, group scan 6, minimum group count 1, and minimum ion count 20. Each selected MS/MS spectrum was searched against the National Center for Biotechnology Information nonredundant protein sequence database (nr.fasta; June 15, 2005) containing 2,506,589 sequences using the TurboSEQUEST software (18, 19) tool version 27 (rev. 12). The software creates theoretical peptides for all or a limited group of database proteins, calculates corresponding MS/MS spectra, and compares them to an experimental spectrum (submitted for the database search) to find the match. The database search was restricted to 700–3500 molecular mass tryptic peptides of human (Homo sapiens) origin. Up to two missed trypsin cleavage sites were allowed, and cysteines were considered carbamidomethylated. The acceptable molecular mass difference (mass tolerance) between an experimental and database peptide was set to 1.5 mass units. Mass tolerance for experimental and calculated MS/MS fragment ions was set to zero. In order to minimize false (random) matches, we used conservative criteria for peptide identification. The candidate database peptide with the highest Xcorr score was considered the match if the following identification criteria were met: (i) Xcorr of at least 2.0, 2.2, and 3.3 for singly, doubly, and triply charged peptides, respectively, and (ii) dCn of at least 0.1 regardless of charge state. The proteins were identified through at least three tryptic peptides with charge states of +2 or +3 that meet the stated criteria. Using these criteria, the rate of false (random) protein identification was estimated as ≤0.7% based on a published statistical model (20). The protein sequences were examined using BLAST tool to eliminate redundancy. A single-protein member of a multiprotein family or set of isoforms was identified if at least one identified tryptic peptide was present in that protein and absent in the others. Also, a protein was identified only if its calculated molecular mass matched the apparent molecular mass (based on gel electrophoresis). If these two criteria were not met, all isoforms or potential sources of a set of detected tryptic peptides were listed.
Statistical Analysis.
We first transformed the ratios on the natural log scale to normalize the data, and we assumed that the observed log-ratios on a protein represented a random sample from a normal distribution. Next, we computed the sample mean and the standard deviation (SD) of the log-ratios for each protein. We also performed a separate t test for each protein to assess whether its mean log-ratio was zero. The P values for the tests needed to be adjusted to account for multiple testing. We used the Holm method (21) and the false discovery rate method (22) for this adjustment. We did not use the Bonferroni method, as it is more conservative (less powerful) than the Holm method at the same familywise error rate. A nonsignificant result based on an adjusted P value implies that there is no evidence of a significant change in the protein. To convert a SD on the log-ratio scale to the ratio scale, we used the fact that if Y = log
e
(X) followed a normal distribution with mean μ and SD σ, then X followed a log-normal distribution with mean exp(μ +σ2/2) and
Results
We analyzed the variability in monocyte proteins in the general population derived from 18 University of Texas Dallas students and staff (9 males and 9 females, ages 18–50). As the aim of this study was to determine the variability of the monocyte proteome in the general population, we did not record ethnic background. However, this will be an important issue when this approach is applied to specific diseases. Peripheral blood monocytes were purified by gradient centrifugation followed by positive selection with specific monoclonal antibodies against CD14 coupled to paramagnetic beads. Flow cytometric analysis was used to assess the purity of the monocyte population, which was >98%, as shown in Figure 1. Monocytes were fractionated by homogenization and centrifugation into 100,000 g supernatant (cytosolic) and 100,000 g pellet (membrane) fractions.
Using two-dimensional differential gel electrophoresis (2D DIGE), we determined that when the same control sample of monocyte protein was split and labeled with Cy3 and Cy5 dyes, 99.8% of ratios fell within a 2.5-fold difference from the expected value of 1 (data not shown). To determine the variability in the general control population, we labeled total cytosolic or membrane proteins from different controls with Cy3 and Cy5. In seven experiments for the cytosolic comparisons and six experiments for the membranes, we observed more than 900 fluorescent protein spots each. Protein spots where Cy3/Cy5 ratios were at least 2.5 in at least one of the experiments were selected for further analysis. This resulted in a total of 31 cytosolic and 12 membrane protein spots. We analyzed the 31 cytosolic and 12 membrane protein spots and found that the mean ratios were not statistically different from 1 (the smallest adjusted P value was 0.66, as would be expected when either control can represent the numerator and denominator of the ratio). All 43 protein spots of interest were analyzed for protein identification by tandem mass spectrometry. Proteins were identified in 27 of 31 cytosolic (Table 1) and 9 of 12 membrane protein spots (Table 2). The variation determined for each of these 36 protein spots is presented in Figure 2. The position of the 27 cytosolic and 9 membrane protein spots that demonstrated the greatest variation in this control population is indicated on the two-dimensional IEF SDS-PAGE gels shown in Figure 3A and B, respectively.
Six of the identified proteins from the cytosolic fraction were found in more than one spot corresponding to similar molecular masses with different pI: Moesin or Moesin/ anaplastic lymphoma kinase fusion protein (gi 5419633 or 14625824) was found in spots 7–8; WD repeat-containing protein 1 isoform 1 or WD repeat-containing protein 1 isoform 2 (gi 12803341 or 3420181) was found in spots 9–12; Enolase-1 (gi 29792061) was found in spots 17 and 18; Annexin A1 and glyceraldehyde-3-phosphate dehydrogenase (gi 55959292 and gi 32891805, respectively) were found in spots 22–24; and Gelsolin (Precursor) or Gelsolin isoform 2 (gi 121116 or gi 38044288) were found in spots 4 and 5. This most probably reflects posttranslational modification altering protein pI with little effect on molecular mass (e.g., phosphorylation).
Four of the identified proteins corresponded to different molecular masses: Enolase-1 (gi 29792061) was found in spots 19 and 20; Annexin A1 and glyceraldehyde-3-phosphate dehydrogenase (gi 55959292; gi 32891805) were found in spots 25–27; and Gelsolin (Precursor) or Gelsolin isoform 2 (gi 121116 or gi 38044288) was found in spots 4–6. This may reflect posttranslational modifications in a protein altering its molecular mass (e.g., glycosylation), alternative splice forms, or partial degradation of a protein.
Among the proteins identified in the membrane fraction, only one protein, L-plastin, was present in three spots, 4, 5, and 9, corresponding to similar molecular masses with different pI. In total we identified 18 high-variance proteins in the cytosolic fraction and 9 in membrane fraction. Enolase 1 was found in the cytosolic as well as in the membrane fraction. However, the sequence coverage was much higher in the cytosolic fraction than in the membrane fraction. Three of the identified proteins in the membrane fraction, Trifunctional enzyme subunit alpha, mitochondrial Precursor, Endoplasmin (heat-shock protein 90 kDa), and Myosin-14 were detected by only two peptides. Based on our 2D map of the membrane proteins (Fig. 3B), we can conclude that these proteins are present at low copy number. For the 10 spots that contained more than one protein, we cannot be sure of the specific variation for an individual component. This can be addressed in the future by running 2D gels with varied ranges of isoelectric point in the first dimension.
Discussion
The monocyte proteins that demonstrated the greatest variance in cytosolic as well as membrane fractions fall into a small group of functional categories, as displayed in Figure 4: (i) cytoskeletal remodeling proteins: vinculin, gelsolin (Precursor) or gelsolin isoform 2, moesin or moesin/anaplastic lymphoma kinase fusion protein, WD repeat protein 1 isoform 1 or WD repeat-containing protein 1 isoform 2, Coagulation factor XIII, L-plastin, Myosin-14, Myosin-9, and tyrosine-protein kinase HCK; (ii) metabolic pathway enzymes: enolase 1, glycogen phosphorylase, pyruvate kinase isozymes M1/M2, Transaldolase 1, and glyceraldehyde-3-phosphate dehydrogenase; (iii) mitochondrial enzymes: NAD(P)-dependent Malic enzyme, mitochondrial aldehyde dehydrogenase 2, Trifunctional enzyme subunit alpha mitochondrial Precursor; (iv) proteins involved in the synthesis, repair, and stabilization of nucleic acids: C1-tetrahydrofolate THF synthase, asparaginyl-tRNA synthetase, Lamin B1; (v) protein repair participants: heat-shock 70 kDa protein 1 and Endoplasmin (heat-shock protein 90 kDa beta member 1); and (vi) others: Cytosolic nonspecific dipeptidase 2, anti-inflammatory mediator-Annexin-1, and dihydropyrimidinase-related protein 2.
The protein demonstrating the greatest variation in the cytosolic fraction was Enolase, with an SD of 4.28. Lamin B1 or L-plastin in the membrane fraction was found in one spot with an SD equal to 3.21. Enolase 1 is a multifunctional enzyme that, in addition to its role in glycolysis, where it catalyzes the conversion of 2-phosphoglycerate to phosphoenolopyruvate in the presence of Mg2+ ions (24), plays a part in various processes such as growth control, hypoxic tolerance, and allergic responses, as well as several types of diseases, such as bacterial, fungal, cancer, neurologic, and autoimmunity (25). Enolase is present in the cytoplasm, but it can translocate to the plasma membrane. We identified one of the spots from the membrane fraction as an enolase. Recently, significantly higher amounts of enolase have been observed on the surface of hematopoietic cells (neutrophils, B cells, T cells, and monocytes) after stimulation with PMA (phorbolmyristateacetate) and LPS (lipopolisaccharide; Refs. 26, 27). It was discovered that alpha enolase present on the cell surface plays a role as a strong plasminogen binding receptor (27–29).
In the membrane fraction, the most variance was found for Lamin B1 and L-plastin identified in the same spot. Lamins are karyoskeletal proteins that are components of the nuclear lamina, a protein meshwork associated with the nucleoplasmic surface of the inner nuclear membrane that is important for organizing the nuclear envelope and inter-phase chromosome architecture (30). Lamin B as a constitutive component of nucleated cells is important for attaching the lamina to the inner nuclear membrane. The acquisition of lamins A/C during embryogenesis of higher vertebrates appears to be associated with particular developmental stages (31). An important feature of leukocytes is the ability to become activated at sites of inflammation by integrin-mediated adhesion. The mechanism by which integrin adhesion is regulated is a crucial aspect of inflammatory processes. L-plastin, a leukocyte actin binding protein, has been implicated in regulating integrin function (32). It was shown that phosphorylation of L-plastin at Ser5 rapidly induced integrin-mediated adhesion when introduced into the cytosol of freshly isolated primary human polymorphonuclear neutrophils and monocytes (33). In response to inflammatory signals, a very important property of leukocytes is their ability to modulate their adhesive function.
Members of the cytoskeletal remodeling protein group are vinculin (34) and L-plastin (33), which regulate adhesion and migration by providing the link between the actin cytoskeleton and transmembrane receptors integrins and cadherins. Gelsolin (35), moesin (36), WD-repeat protein 1 (37), and Coagulation factor XIII (38) also control cell motility and act as signal transducers in cytoskeletal remodeling. Gelsolin in macrophages and dendritic cells is also present in podosomes, which are characteristic dynamic actin-rich structures present in highly motile cells that are actively engaged in matrix remodeling and tissue invasion (39). Myosin-9 is expressed abundantly in hematopoietic, lymphopoietic, and epithelial cells (40) and plays a pivotal role in phagocytosis, assembly of focal contacts, and cell adhesion (41). Expression of Myosin-14 was observed only after treatment of RAW 264.7 mouse macrophages with sodium butyrate, an inhibitor of histone deacetylase, or trichostatin A, leading to differentiation of the cells. Noninduced cells showed little expression of Myosin-14, which supports the idea that it is more abundant in differentiated tissues (42). This could be the reason why we identified this protein with only two peptides.
Alpha enolase and pyruvate kinase are the glycolytic enzymes catalyzing the conversion of 2-phosphoglycerate to phosphoenolopyruvate (24) and phosphoenolopyruvate to pyruvate (43), respectively. Enolase may also function in the intravascular and pericellular fibrinolytic system as a receptor and activator of plasminogen on the cell surface of several cell types, such as leukocytes and neurons (29). Glycogen phosphorylase is the enzyme responsible for glycogen breakdown in liver and muscle. Glycogen phosphorylase of human leukocytes exists in two forms that are interconvertible by phosphorylation-dephosphorylation (44). Activation by phorbol myristate acetate of human polymorphonuclear leucocytes resulted in activation of phosphorylase and glycogen breakdown (45). Transaldolase regulates redox-dependent apoptosis through controlling NADPH and ribose 5-phosphate production via the pentose phosphate pathway (46), and glyceraldehyde-3-phosphate dehydrogenase catalyzes the conversion of glyceraldehyde 3-phosphate to 1,3 diphosphoglycerate (47).
The human mitochondrial NAD(P)+-dependent Malic Enzyme (m-NAD-ME) is believed to play an important role in metabolism of glutamine for energy production in rapidly proliferating tissues and tumors (48). Mitochondrial aldehyde dehydrogenase 2 is a member of the aldehyde dehydrogenase superfamily, enzymes that are critical for detoxification via the NAD(P)+-dependent oxidation of numerous endogenous and exogenous aldehyde substrates, including pharmaceuticals and environmental pollutants (49). Trifunctional enzyme subunit is a part of the mitochondrial multi-enzyme complex of the fatty acid β-oxidation cycle containing enoyl-CoA hydratase,
C1-tetrahydrofolate THF synthase activity is important in a variety of cellular processes, including de novo purine and thymidylate synthesis, serine and glycine interconversion, methionine biosynthesis, and protein synthesis in mitochondria and chloroplasts and vitamin metabolism (51). Asparaginyl-tRNA synthetase enzyme catalyzes the first step in translation of the genetic code, attaching a specific amino acid to a tRNA molecule with the appropriate anticodon. Recently, human cytoplasmic aminoacyl-transfer tRNA synthetases, which are autoantigens in idiopathic inflammatory myopathies, were shown to activate chemokine receptors on T lymphocytes, monocytes, and immature dendritic cells by recruiting immune cells that could induce innate and adaptive immune responses (52). The protein repair participant group includes heat-shock 70 kDa protein 1 and endoplasmin (heat-shock protein 90 kDa beta member 1 [Hsp90]), which mediate the folding of newly translated polypeptides and, in cooperation with other chaperones, stabilize preexisting proteins against aggregation (53). Hsp90 plays a role in the monocyte-macrophage lineage, participating in proliferation and cell cycle control and in the acquisition of functional heterogeneity of the mature macrophage phenotype, with potential effects on the role of the macrophage in innate immunity (54).
The cytosolic nonspecific dipeptidase degrades a large number of dipeptides. Given its broad tissue distribution, cellular localization, and broad substrate specificity, the cytosolic nonspecific dipeptidase may function as a housekeeping enzyme in the catabolism of dipeptidic substrates (55). Annexin-1 is an anti-inflammatory mediator controlling polymorphonuclear leukocyte (PMN) trafficking. It has been implicated in the regulation of phagocytosis, cell signaling, and proliferation and in the control of anterior pituitary hormone release (56). Dihydropyrimidinase-related protein 2, or collapsing response mediator protein 2, has been identified in the nervous system, where it plays a critical role in the establishment of neuronal polarity. Relatively new evidence indicates a redistribution of collapsin at the uropod in polarized T cells, suggesting that it may regulate T-cell migration (57). Differential display or RNA fingerprint was applied to identify genes differentially expressed in monocyte maturation induced by an immuno-modulating peptide on human peripheral blood mononuclear cells. One of the free activated genes was DRP2 (dihydropirimidinase-related protein 2). The expression pattern of identified genes seemed to correlate with different monocyte subsets, monocyte-derived cells, and expected functional changes (58).
The current study defines a class of monocyte proteins that met our selection criteria and demonstrated substantial variation in the general control population. The role of this subset of monocyte proteins in inflammatory diseases will be the subject of future studies. This study also indicated the need for careful definition of variability in any control population used for disease state comparisons by proteomic approaches.
Cytosolic Proteins That Demonstrate the Greatest Variation in the Control Populations (in Decreasing Order)
Membrane Proteins That Demonstrate the Greatest Variation in the Control Population (in Decreasing Order)
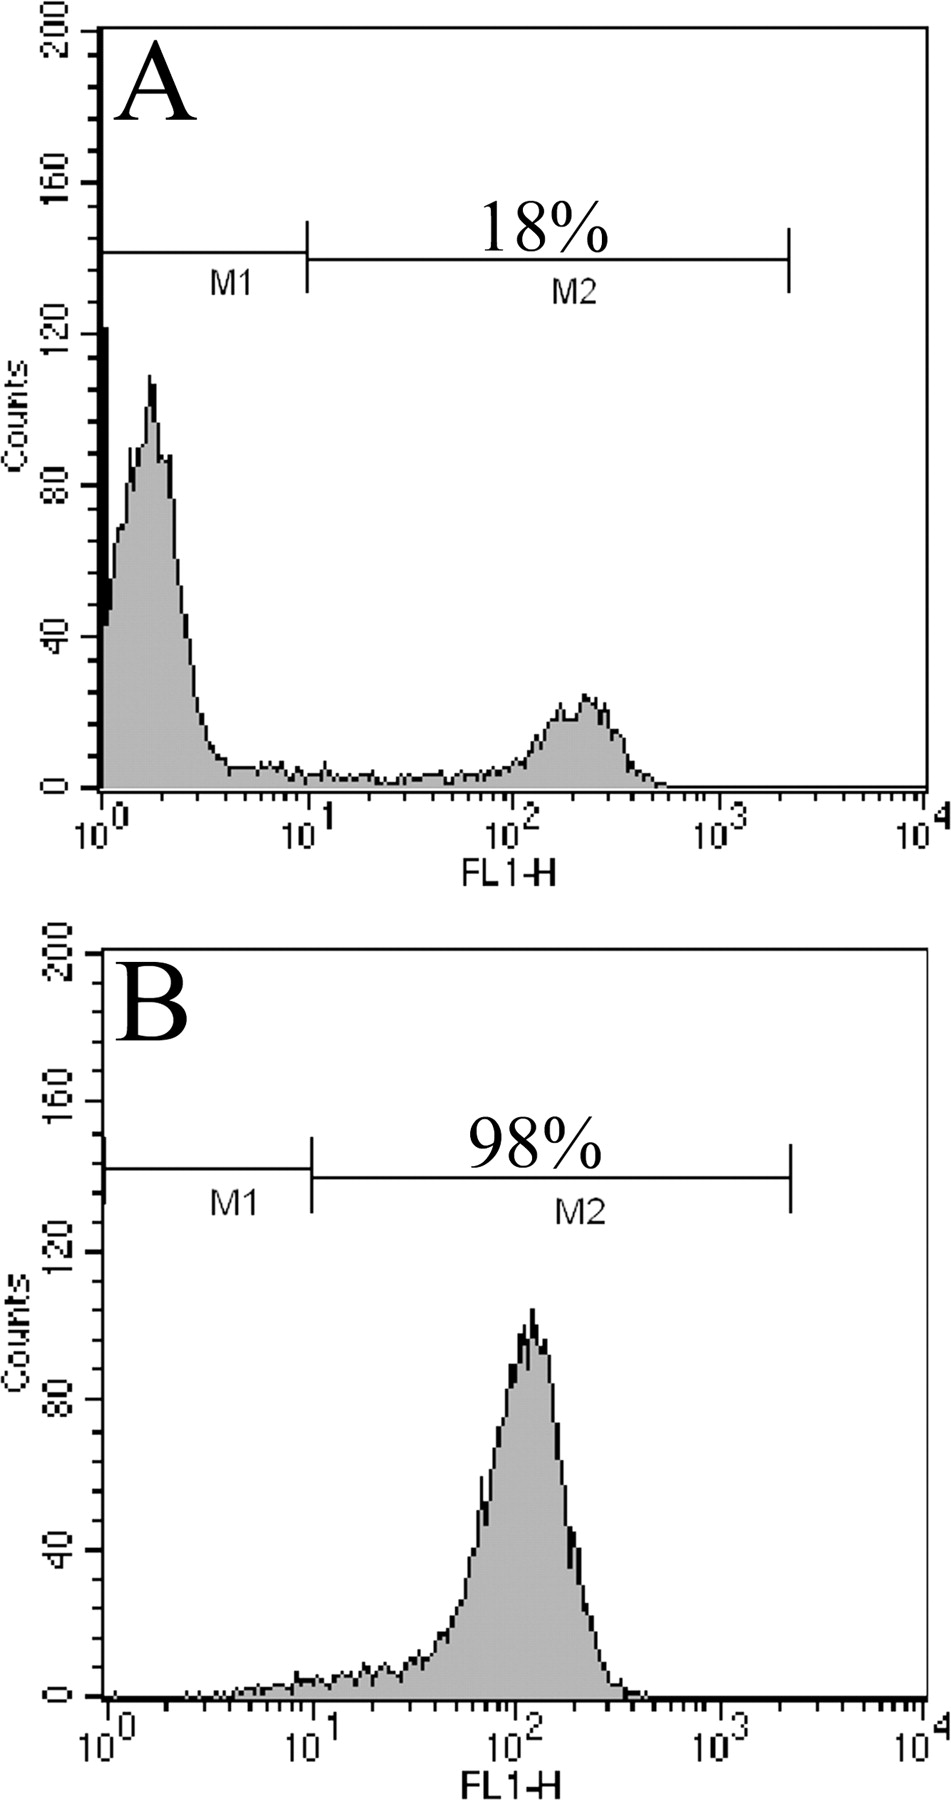
Phenotypic analysis of peripheral blood mononuclear cells and capture of the monocyte population by flow cytometry. Cells were stained for 10 mins at 4°C with fluorescein isothiocyanate (FITC)–conjugated mouse monoclonal antibody (mAb) CD14. The analysis was restricted to monocytes: a gate was drawn on a forward and side scatter dot plot around the monocyte population, and the fluorescence of FITC-labeled CD14 mAb was used to identify CD14+ cells and gate out other cells. A total of 104 events gates were counted per sample. Results are expressed as the percentage of cells staining above background levels established using an isotype control (IgG2a) mAB. Before magnetic separation, we observed an 18% positively stained monocyte population (A), and after MACS the purity was ≥98% (B).
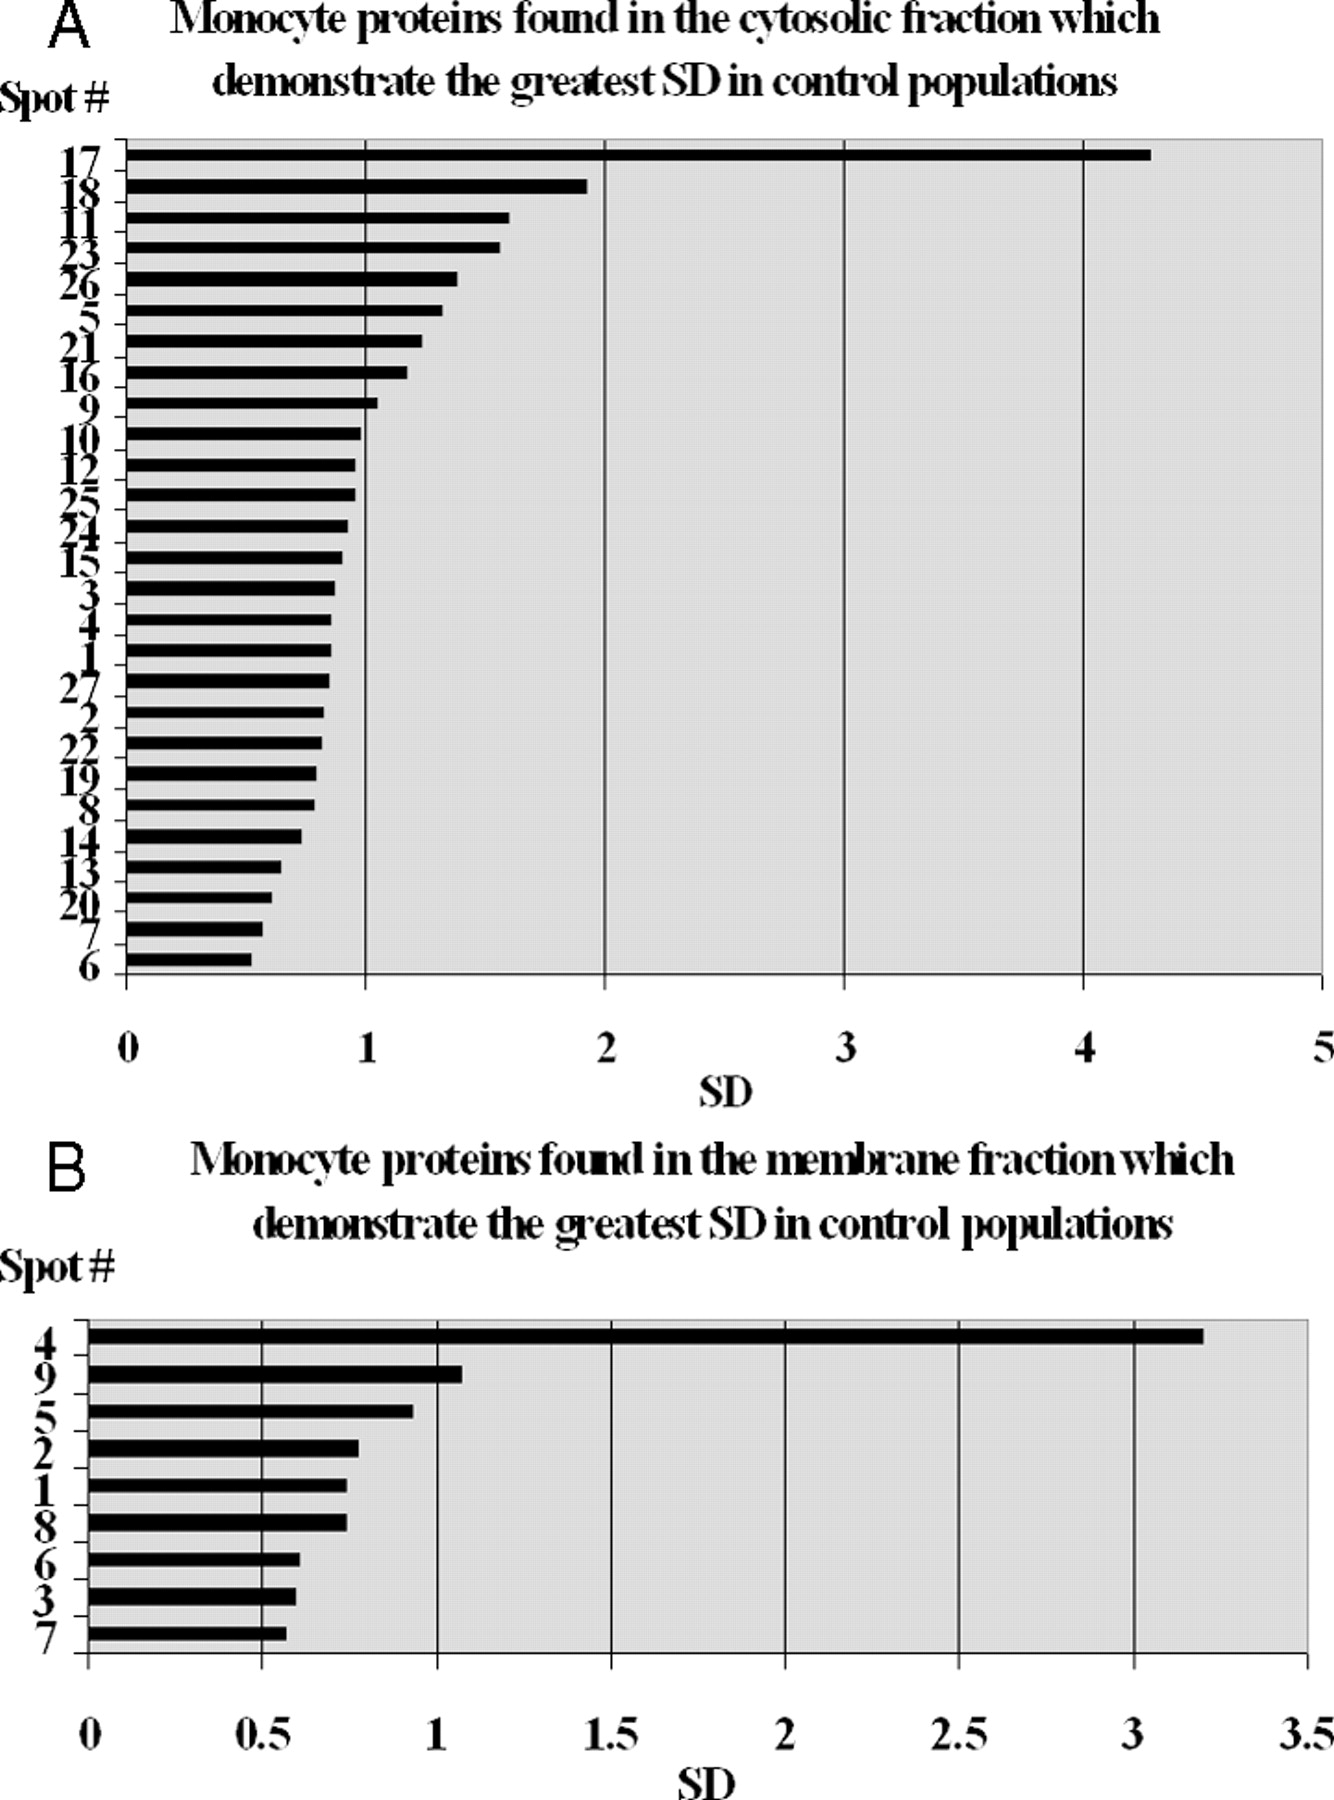
Proteins that demonstrate the greatest variation of content in monocytes. (A) SD was determined for each of 27 selected protein spots from the cytosolic fraction. (B) SD was determined for each of nine selected spots from the membrane fraction.
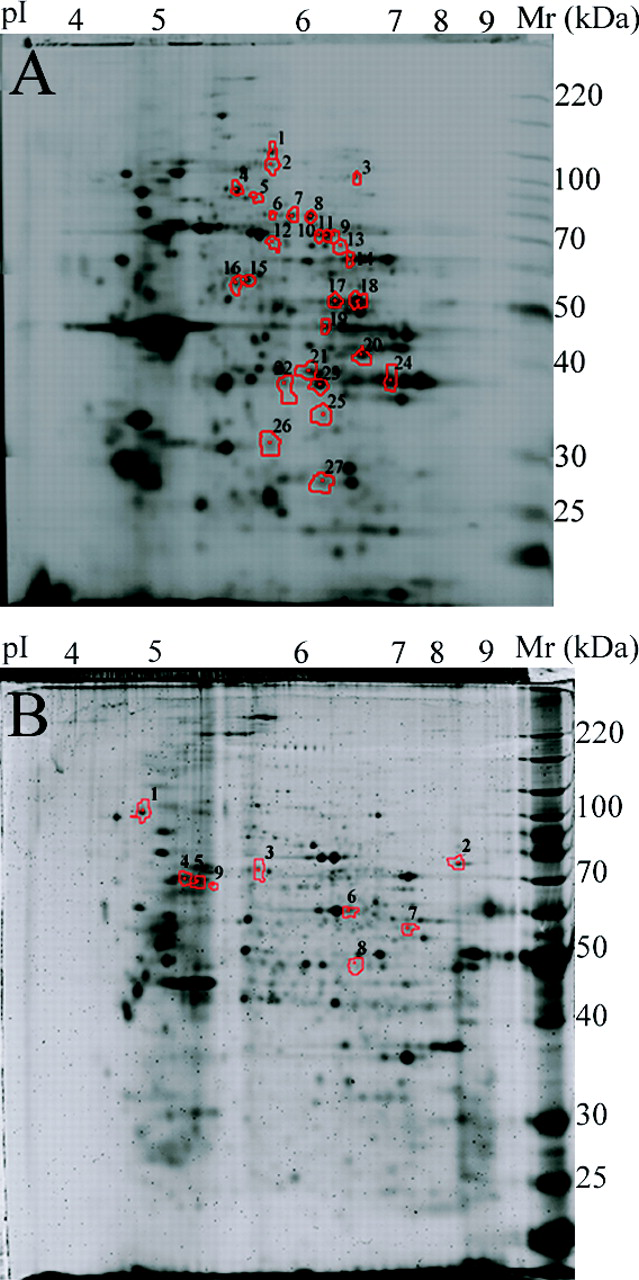
Monocyte proteins from the cytosolic fraction (A) and membrane fraction (B) were separated on a 2D IEF–SDS-PAGE gel, which was then stained with SyproRuby. The gel spots selected for protein identification by tandem mass spectrometry are indicated.
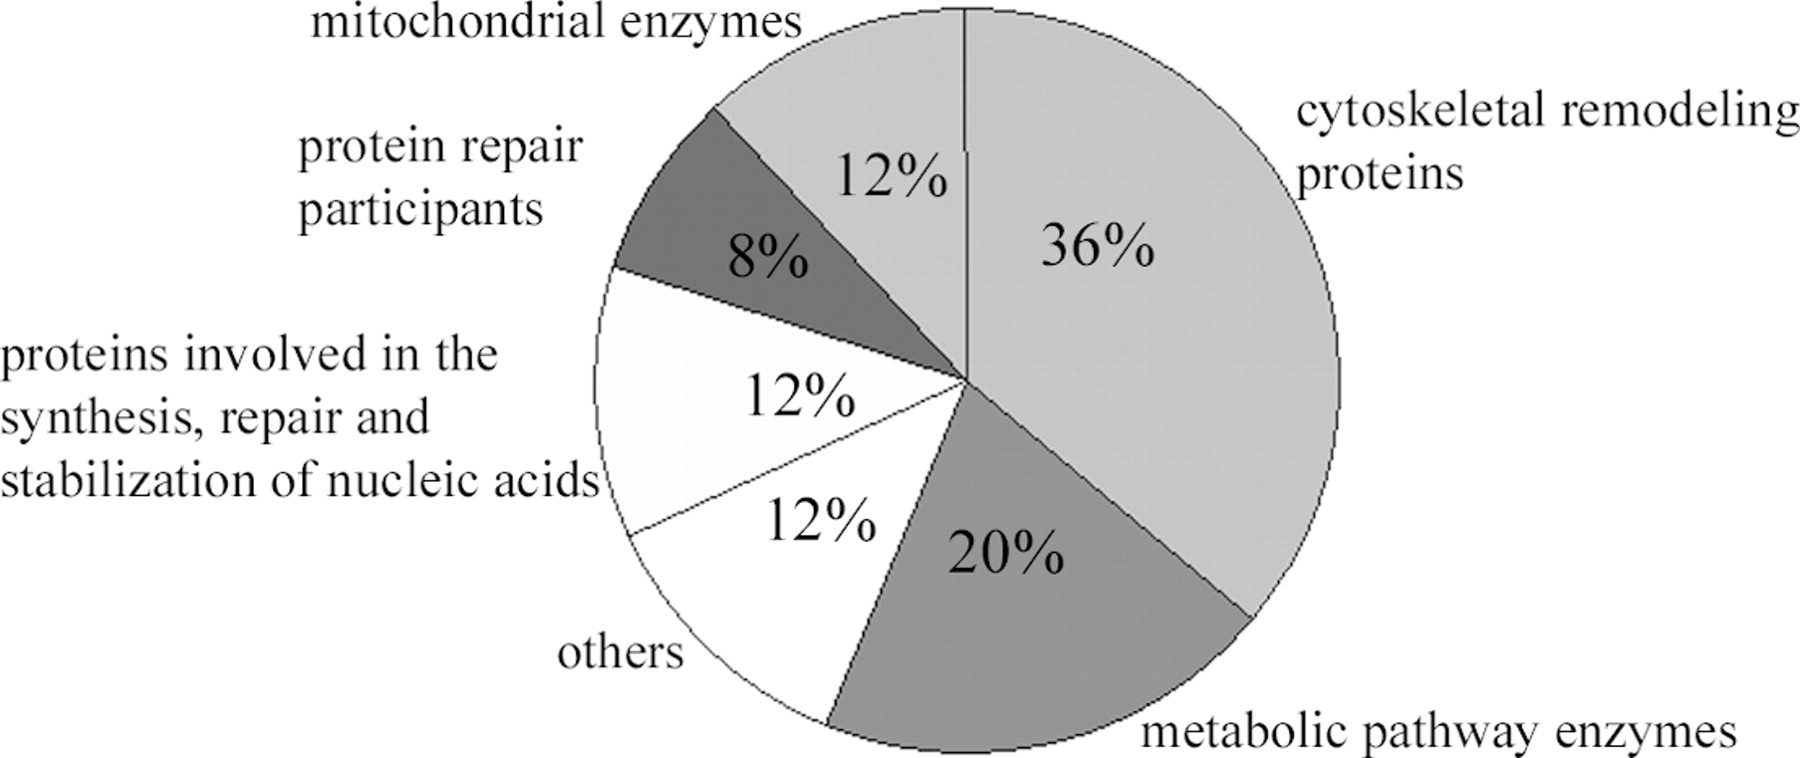
Functional categories of the 24 identified proteins. The percent of proteins included in each category is indicated.
Footnotes
This work was supported by grant HL070588, which was awarded to Steven R. Goodman, from the National Institutes of Health Sickle Cell Center.