



Abstract
We tested the hypothesis that transcription of novel organic cation transporters (OCTNs) is directly regulated by peroxisome proliferator–activated receptor (PPAR)-α. Therefore, wild-type mice and mice deficient in PPARα (PPARα−/−) were treated with the PPARα agonist WY 14,643. Wild-type mice treated with WY 14,643 had a greater abundance of OCTN2 mRNA in their liver, muscle, kidney, and small intestine and a greater abundance of OCTN3 mRNA in kidney and small intestine than did untreated wild-type mice (P < 0.05). Moreover, wild-type mice treated with WY 14,643 had greater mRNA abundances of enzymes involved in hepatic carnitine synthesis (4-N-trimethylaminobutyraldehyde dehydrogenase, γ-butyrobetaine dioxygenase) and increased carnitine concentrations in liver and muscle than did untreated wild-type mice (P < 0.05). Untreated PPARα−/− mice had a lower abundance of OCTN2 mRNA in liver, kidney, and small intestine and lower carnitine concentrations in plasma, liver, and kidney than did untreated wild-type mice (P < 0.05). In PPARα−/− mice, treatment with WY 14,643 did not influence mRNA abundance of OCTN2 and OCTN3 and carnitine concentrations in all tissues analyzed. The abundance of OCTN1 mRNA in all the tissues analyzed was not changed by treatment with WY 14,643 in wild-type or PPARα−/− mice. In conclusion, this study shows that transcriptional upregulation of OCTN2 and OCTN3 in tissues and of enzymes involved in hepatic carnitine biosynthesis are mediated by PPARα. It also shows that PPARα mediates changes of whole-body carnitine homeostasis in mice by upregulation of carnitine transporters and enzymes involved in carnitine synthesis.
Introduction
Carnitine (
Distribution of carnitine within the body and intra-cellular homeostasis of carnitine are controlled by novel organic cation transporters (OCTNs) that belong to the solute carrier 22A family, localized on the apical membrane of cells (8, 9). Three OCTNs have been identified so far: OCTN1, OCTN2, and OCTN3 (10–12). OCTNs are polyspecific; they transport several cations and
We have shown that treatment of rats or rat Fao hepatoma cells with clofibrate or WY 14,643, respectively, both synthetic agonists of peroxisome proliferator–activated receptor (PPAR)-α, causes an upregulation of OCTN2 and an increase in carnitine concentration in liver cells (18). We also have found that feeding oxidized fats to rats causes an upregulation of OCTN1 and OCTN2 and increases carnitine concentrations in the liver (19). As dietary oxidized fats are also able to activate PPARα in the liver (20–23), we hypothesize that transcriptional upregulation of OCTNs is mediated by PPARα, a transcription factor belonging to the nuclear hormone receptor superfamily (24). The present study aims to test this hypothesis. Therefore, we performed an experiment with mice deficient in PPARα (PPARα−/− mice) that were treated as wild-type mice with WY 14,643 and determined OCTN1 and OCTN2 mRNA abundance in the liver, skeletal muscle, kidney, small intestine, and testes. In the kidney, testes, and small intestine, we also analyzed OCTN3 mRNA abundance. To show the consequences of an alteration in OCTN gene expression on carnitine homeostasis, we also determined carnitine concentrations in these tissues. To elucidate whether the increased hepatic carnitine concentration observed in rats treated with PPARα agonists (18, 19, 25) could be due to increased carnitine biosynthesis in the liver, we also considered the mRNA abundance of enzymes involved in carnitine biosynthesis in the liver and tissue concentrations of TML and BB, which are precursors for carnitine synthesis in the liver.
Material and Methods
Materials.
WY 14,643, dimethylsulfoxide (DMSO), TRIZOL reagent and SYBR Green I were purchased from Sigma-Aldrich (Steinheim, Germany). Reverse transcriptase was supplied by MBI Fermentas (St. Leon-Rot, Germany) and Taq polymerase by Promega (Mannheim, Germany). All primers were purchased from Operon Biotechnologies (Cologne, Germany).
Animals, Diets, and Sample Collection.
For all experiments, we used male PPARα−/− mice (129S4/SvJae-Ppara tm1Gonz/J) and corresponding wild-type control mice (129S1/SvImJ) purchased from the Jackson Laboratory (Bar Harbor, ME, USA). The mice were 11–12 weeks old with an average initial body weight (±SD) of 24.3 ± 3.2 g. Mice of each genotype were randomly assigned to two groups and kept individually in Macrolon cages in a room with controlled temperature (22°C ± 2°C), relative humidity (50%–60%), and light (12:12-hr light:dark cycle). All experimental procedures described followed established guidelines for the care and handling of laboratory animals and were approved by the council of Saxony-Anhalt. Mice in the treatment groups (wild-type mice, n = 8; PPARα−/− mice, n = 8) received 40 mg/kg WY 14,643 once daily 2 hrs after the beginning of the light cycle for 4 days. WY 14,643 was dissolved in DMSO and sunflower oil (50:50, v/v) at a final concentration of 8 mg/ml as described (26). The daily dose of WY 14,643 (in 0.12 ml) was given by gavage. Control animals (wild-type mice, n =8; PPARα−/− mice, n = 8) were given the appropriate volume of the vehicle (DMSO and sunflower oil). All mice were fed a commercial, standard basal diet (“altromin 1324,” Altromin GmbH, Lage, Germany) with a low carnitine concentration of 22 μmol/kg. According to the declaration of the manufacturer, each kilogram of this feed contains 11.9 MJ metabolizable energy (ME), 190 g crude protein, 60 g crude fiber, 40 g crude fat, and 70 g crude ash. To standardize food intake, the mice were fed restricted amounts (4 g daily). The daily intake of ME derived from the diet and oil was 49.6 kJ. This energy intake is about 20% more than the ME requirement for maintenance, which is approximately 41 kJ ME per day (27). Water was available ad libitum from nipple drinkers during the entire experiment. On day 4 of treatment, mice received the last dose of WY 14,643 or vehicle alone and 1 g of the diet and were killed 4 hrs later by decapitation under light anesthesia with diethyl ether. Blood was collected into ethylenediaminetetraacetic acid–containing tubes, and plasma was obtained by centrifugation (1100 g, 10 mins, 4°C) and stored at −20°C. Samples of liver, kidney, skeletal muscle, and testes for RNA isolation and for determination of carnitine concentration were snap-frozen in liquid nitrogen and stored at −80°C. The small intestine was rapidly excised and washed with 0.9% NaCl (w/v), and mucosal scrapings were obtained, snap-frozen, and stored at − 80°C.
Reverse Transcriptase Polymerase Chain Reaction (RT-PCR) Analysis.
Total RNA was isolated from tissues by using TRIZOL reagent according to the manufacturer’s protocol. The cDNA synthesis was carried out as described (28). The mRNA expression of genes was measured by real-time detection PCR using SYBR Green I and the Rotor Gene 2000 system (Corbett Research, Mortlake, Australia) as described (29). Target genes with characteristics of specific primers used are listed in Table 1. Annealing temperature for all primer pairs was 60°C; the only exception was those for β-actin, and their annealing temperature was 66°C. For determination of mRNA abundance, a threshold cycle (Ct) and amplification efficiency were obtained from each amplification curve by using the software RotorGene 4.6 (Corbett Research). Calculation of relative mRNA abundance was made by using the ΔΔCt method as previously described (30). The housekeeping gene β-actin was used for normalization. The abundance of β-actin mRNA was not influenced by the treatment of mice with WY 14,643.
Carnitine Analysis.
Concentrations of free carnitine, acetyl carnitine, TML, and BB in plasma and tissues were determined by tandem mass spectrometry using deuterated carnitine-d3 (Larodane Fine Chemicals, Malmö, Sweden) as an internal standard (31). Fifty milligrams of freeze-dried tissues were extracted with 0.5 ml methanol:water (2:1, v/v) by homogenization (Tissue Lyzer, Qiagen, Hilden, Germany), followed by sonification for 20 mins and incubation at 50°C for 30 mins in a shaker. After centrifugation (13,000 g for 10 mins) 20 μl of the supernatant were added to 100 μl methanol containing the internal standard, and the two were mixed, incubated for 10 mins, and centrifuged (13,000 g) for 10 mins. Plasma samples were handled at 4°C in the same manner as the supernatant after tissue extraction. The final supernatants were used for quantitation of the compounds by a 1100-er series high performance-liquid chromatography (HPLC) (Agilent Technologies, Waldbronn, Germany) equipped with a Kromasil 100 column (125 mm × 2 mm, 5-μm particle size, CS-Chromatographie Service, Langerwehe, Germany) and an API 2000 liquid chromatography-tandem mass spectrometry (LC-MS/MS)-System (Applied Biosystems, Darmstadt, Germany). The analytes were ion-ized by positive ion (5500 V) electrospray. As eluents, methanol and a methanol:water:acetonitrile:acetic acid mixture (100:90:9:1, v/v/v/v) were used.
Statistical Analysis.
Data, including the factors treatment (WY 14,643 vs. control) and genotype (PPARα−/− vs. Wild-type) and the interactions between treatment and genotype, were subjected to analysis of variance (ANOVA) by using the Minitab Statistical Software (Minitab, State College, PA). When variances were heterogeneous, data were transformed into their logarithms before ANOVA. For statistically significant F values, individual means of the treatment groups were compared by Tukey’s test. Means were considered significantly different at P < 0.05.
Results
Body and Liver Weights.
Treatment with WY 14,643 did not influence the final body weights of the mice; there was also no effect of genotype and treatment × genotype interaction on final body weights (mean ± SD; n = 8 per group; wild-type control, 25.1 ± 2.7 g; wild-type treated with WY 14,643, 25.2 ± 1.9 g; PPARα−/− control, 23.9 ± 3.1 g; PPARα−/− treated with WY 14,643, 23.2 ± 4.3 g). Liver weights of the mice were influenced by WY 14,643 treatment (P < 0.05) and genotype (P < 0.05), and there was a significant interaction between both factors (P < 0.05). In PPARα−/− mice, liver weight was not influenced by treatment with WY 14,643; in wild-type mice, treatment with WY 14,643 significantly (P < 0.05) increased liver weight: the mean liver weight (±SD) per 100 g body weight was 4.02 ± 0.42 g for the wild-type control group (n = 8), 5.63 ± 0.35 g for the wild-type group treated with WY 14,643 (n = 8), 3.93 ± 0.22 g for the PPARα−/− control group (n = 8), and 3.98 ± 0.42 g for the PPARα−/− group treated with WY 14,643 (n = 8).
Abundance of ACO and OCTN mRNA in Tissues.
To study the effect of WY 14,643 on the activation of PPARα, we determined the mRNA abundance of ACO, a PPARα target gene, in liver, skeletal muscle, kidney, testes, and small intestine. In the liver, kidney, and small intestine of wild-type mice, treatment with WY 14,643 increased the abundance of ACO mRNA (P < 0.05; Fig. 1). Untreated PPARα−/− mice had less ACO mRNA in their liver and small intestine than did untreated wild-type mice (P < 0.05); the abundance of ACO mRNA in skeletal muscle, testes, and kidney did not differ between these two groups of mice (Fig. 1). In PPARα−/− mice, treatment with WY 14,643 did not increase ACO mRNA abundance in any of the tissues analyzed (Fig. 1).
In wild-type mice, OCTN2 mRNA was increased by WY 14,643 treatment in the liver, skeletal muscle, kidney, and small intestine, whereas it remained unchanged in testes (Fig. 2). OCTN2 mRNA in the liver, kidney, and small intestine was less in untreated PPARα−/− mice than in untreated wild-type mice (P < 0.05; Fig. 2). In PPARα−/− mice, treatment with WY 14,643 did not increase OCTN2 mRNA abundance in any of the tissues analyzed (Fig. 2).
The abundance of OCTN1 mRNA in the liver, skeletal muscle, kidney, small intestine, and testes was not influenced by WY 14,643 treatment in either genotype (Fig. 3). Moreover, OCTN1 mRNA abundance in all tissues was similar in both genotypes (Fig. 3).
OCTN3 mRNA abundance was determined in the testes, kidney, and small intestine. The abundance of OCTN3 mRNA in the kidney and testes did not differ between untreated wild-type and untreated PPARα−/− mice (Fig. 4). In contrast, the abundance of OCTN3 mRNA in the small intestine was less in untreated PPARα−/− mice than in untreated wild-type mice (P < 0.05; Fig. 4). In wild-type mice, expression of OCTN3 in the kidney and small intestine was increased by WY 14,643 (P < 0.05), whereas it remained unchanged in PPARα−/− mice (Fig. 4). Expression of OCTN3 in the testes was not altered by WY 14,643 treatment in either genotype (Fig. 4).
mRNA Abundance of Hepatic Enzymes Involved in Carnitine Biosynthesis.
Untreated wild-type mice had more TMABA-DH mRNA in their liver than did untreated PPARα−/− mice (P < 0.05); the abundance of TMLD and BBD mRNAs did not differ between these two groups of mice (Fig. 5). In wild-type mice, treatment with WY 14,643 increased the abundance of TMLD and BBD mRNA in the liver (P < 0.05), whereas the abundance of TMABA-DH mRNA remained unchanged (Fig. 5). In contrast, the mRNA abundance of all these enzymes in PPARα−/− mice was not influenced by WY 14,643 treatment (Fig. 5).
Concentrations of Carnitine, BB, and TML in Plasma and Tissues.
Concentrations of carnitine, BB, and TML were determined in plasma, liver, kidney, skeletal muscle, and small intestine but not in testes (sufficient sample was not available from this tissue).
Wild-type mice treated with WY 14,643 had higher concentrations of free carnitine and acetyl carnitine in the liver and a higher concentration of free carnitine in skeletal muscle than did untreated wild-type mice. In the small intestine of wild-type mice, the concentration of free carnitine was increased by WY 14,643 treatment, whereas the concentration of acetyl carnitine was reduced (P < 0.05; Table 2). Concentrations of free carnitine and acetyl carnitine in the plasma and kidney of wild-type mice were reduced by WY 14,643 treatment. In untreated PPARα−/− mice, concentrations of free carnitine in plasma, liver, and kidney and those of acetyl carnitine in the liver and small intestine were lower than those in untreated wild-type mice (P < 0.05); concentrations of free carnitine in skeletal muscle and small intestine and concentrations of acetyl carnitine in plasma, kidney, and skeletal muscle were similar in those two groups (Table 2). Moreover, treatment of PPARα−/− mice with WY 14,643 did not cause any alteration in plasma and tissue carnitine concentrations.
Wild-type mice treated with WY 14,643 had lower concentrations of BB, the precursor of carnitine, in plasma, liver, and kidney than did untreated wild-type mice (P < 0.05; Table 2). In contrast, BB concentrations in skeletal muscle and small intestine did not differ between treated and untreated wild-type mice (Table 2). In PPARα−/− mice, treatment with WY 14,643 did not change plasma and tissue BB concentrations (Table 2). In untreated PPARα−/− mice, concentrations of BB in the liver, kidney, and small intestine were similar to those in untreated wild-type mice; in contrast, BB concentrations in plasma and skeletal muscle were higher in untreated PPARα−/− mice than in untreated wild-type mice (P < 0.05; Table 2).
Concentrations of TML in plasma and tissues were not different between wild-type mice and PPARα−/− mice, and they were not influenced by WY 14,643 treatment (Table 2).
Discussion
To investigate the hypothesis that transcription of OCTNs is controlled by PPARα, we treated wild-type and PPARα−/− mice with WY 14,643. To demonstrate PPARα activation, we determined the mRNA abundance of ACO, a gene that possesses a PPAR response element (32). The finding that ACO mRNA was increased in the liver, kidney, and small intestine is therefore indirect proof of PPARα activation in these tissues of wild-type mice treated with WY 14,643. The fact that there was no upregulation of ACO in the testes and skeletal muscle by WY 14,643 may be due to the low expression of PPARα in these tissues (33). ACO mRNA abundance was not influenced in any tissue of PPARα−/− mice by WY 14,643; this result confirms that there was no activation of PPARα because of the lack of expression in those mice. Similarly, hepatomegaly indicative of peroxisome proliferation (34) was observed in wild-type mice treated with WY 14,643 but not in PPARα−/− mice treated with WY 14,643.
The finding that treatment with WY 14,643 increased OCTN2 mRNA in the liver, muscle, kidney, and small intestine of wild-type mice but not of PPARα−/− mice demonstrates that transcriptional upregulation of OCTN2 is mediated by PPARα. The observation that OCTN2 was not upregulated in the testes may be due to the fact that WY 14,643 caused no activation of PPARα in this tissue as assessed by the response of ACO mRNA abundance. It is furthermore shown that OCTN3 mRNA in the kidney and small intestine is increased by WY 14,643 in wild-type mice but not in PPARα−/− mice; this result demonstrates that transcriptional upregulation of OCTN3 is also mediated by PPARα. The finding that OCTN3 was not upregulated in the testes of wild-type mice treated with WY 14,643 may be due to the lack of PPARα activation in that tissue. In contrast, OCTN1 was not upregulated in any tissue of wild-type mice; this finding indicates that its transcription is not influenced by PPARα activation. The observation that OCTN1 was not upregulated by WY 14,643 in wild-type mice is in accordance with our previous study in which treatment of Fao rat hepatoma cells with WY 14,643 did not influence OCTN1 mRNA abundance (18).
The present study moreover shows that WY 14,643 treatment upregulates the transcription of enzymes involved in hepatic biosynthesis, TMABA-DH and BBD, in wild-type mice but not in PPARα−/− mice. This result shows that transcriptional upregulation of enzymes involved in hepatic carnitine synthesis is also mediated by PPARα.
The present study confirms results of recent studies (18, 19, 25, 35) in showing that treatment with PPARα agonists increases the carnitine concentration in the liver of rodents. The present study moreover shows that treatment with a PPARα agonist increases carnitine concentration in skeletal muscle, which serves as a carnitine storage site in the body. The reason for increased carnitine concentrations in tissue cannot be clarified by this study. The liver has a very high capacity to convert BB to carnitine. Therefore, the availability of the carnitine precursors TML and BB is considered to be rate-limiting for carnitine biosynthesis (36). Paul et al. (27) proposed that clofibrate treatment stimulates hepatic carnitine biosynthesis by increasing the availability of TML. In contrast to that study, TML concentrations in the liver and other tissues remained completely unchanged by treatment with WY 14,643. The finding that the concentration of BB in the liver of wild-type mice was reduced by WY 14,643 despite unchanged TML concentrations could however indicate that more BB was converted to carnitine in the liver of these animals. In the present study we did not determine protein concentrations or transport activities of OCTN2. However, the finding that the transcription of OCTN2 was strongly enhanced in the liver of wild-type mice treated with WY 14,643 suggests that increased delivery of carnitine from blood to the liver may contribute to increased hepatic carnitine concentrations in these mice. As muscle is not able to produce carnitine (7), the increased carnitine concentration in skeletal muscle may be primarily the result of an increased uptake of carnitine from the blood by OCTN2. Reduced concentrations of carnitine in plasma of wild-type mice treated with WY 14,643 may be the result of increased uptake of carnitine into tissues. The reduced carnitine concentration in the kidney of wild-type mice treated with WY 14,643 cannot be explained by the data of this study. OCTNs in the kidney have the ability to reabsorb carnitine from urine (12). As OCTN2 and OCTN3 were upregulated in the kidney, it is assumed that reabsorption of carnitine in the kidney is stimulated by PPARα activation. However, as the tubular reabsorption rate of carnitine in humans and rodents is normally in excess of 90% (37–39), there is less potential for increasing the amount of carnitine reabsorbed from the tubules by PPARα activation. Therefore, increased expression of OCTNs in the kidney probably contributed less to increased tissue carnitine concentrations. Intestinal OCTN2 and OCTN3 are involved in the absorption of carnitine from the diet (17, 40). The observation that the abundance of these carnitine transporter mRNAs in the small intestine was increased in wild-type mice by WY 14,643 treatment suggests that dietary absorption of carnitine may have improved. However, because the carnitine concentration of the diet used in this study was very low, we assume that an increase in the rate of intestinal carnitine absorption should have had less effect on whole-body carnitine homeostasis in this study.
During the preparation of the revised version of this manuscript, a study by van Vlies et al. (41) was published, and in this study they also investigated the effect of WY 14,643 on activities of enzymes involved in hepatic carnitine synthesis, expression of OCTN2, and concentrations of TML, BB, and carnitine in plasma and various tissues of wild-type and PPARα−/− mice. Their study showed that WY 14,643 increases hepatic activity of BBD and OCTN2 mRNA abundance in the liver of wild-type mice but not of PPARα−/− mice. It furthermore revealed that carnitine concentrations in plasma, liver, kidney, and heart are increased by WY 14,643 in wild-type mice but not in PPARα−/− mice. The authors of that study concluded that WY 14,643 treatment increases carnitine concentrations by enhanced carnitine biosynthesis and enhanced import of carnitine into cells. In the study by van Vlies et al. (41), it was also shown that similar effects occur in rats during fasting. The findings of that study agree well with those of the present study and support the hypothesis that transcription of OCTN2 and enzymes of hepatic carnitine biosynthesis is regulated by PPARα.
The observed upregulation of OCTN2 in tissues due to activation of PPARα may be relevant not only to carnitine homeostasis but also to tissue distribution and intestinal absorption of other compounds. OCTN2 is polyspecific and is able to bind other monovalent cations and various drugs such as verapamil, spironolactone, and mildronate (15, 42–46). The effect of PPARα activation on such compounds therefore deserves further investigation.
In conclusion, the present study shows that transcriptional upregulation of OCTN2 and OCTN3 as well as hepatic enzymes of carnitine synthesis is mediated by PPARα in mice. Through regulation of these enzymes and transporters, PPARα is involved in the regulation of carnitine homeostasis.
Characteristics of the Specific Primers Used for RT-PCR Analysis
Effect of WY 14,643 on Concentrations of Free Carnitine, Acetyl Carnitine, TML, and BB in Plasma, Liver, Kidney, Skeletal Muscle, and Small Intestine of Wild-Type (+/+) and PPARα−/− Mice a
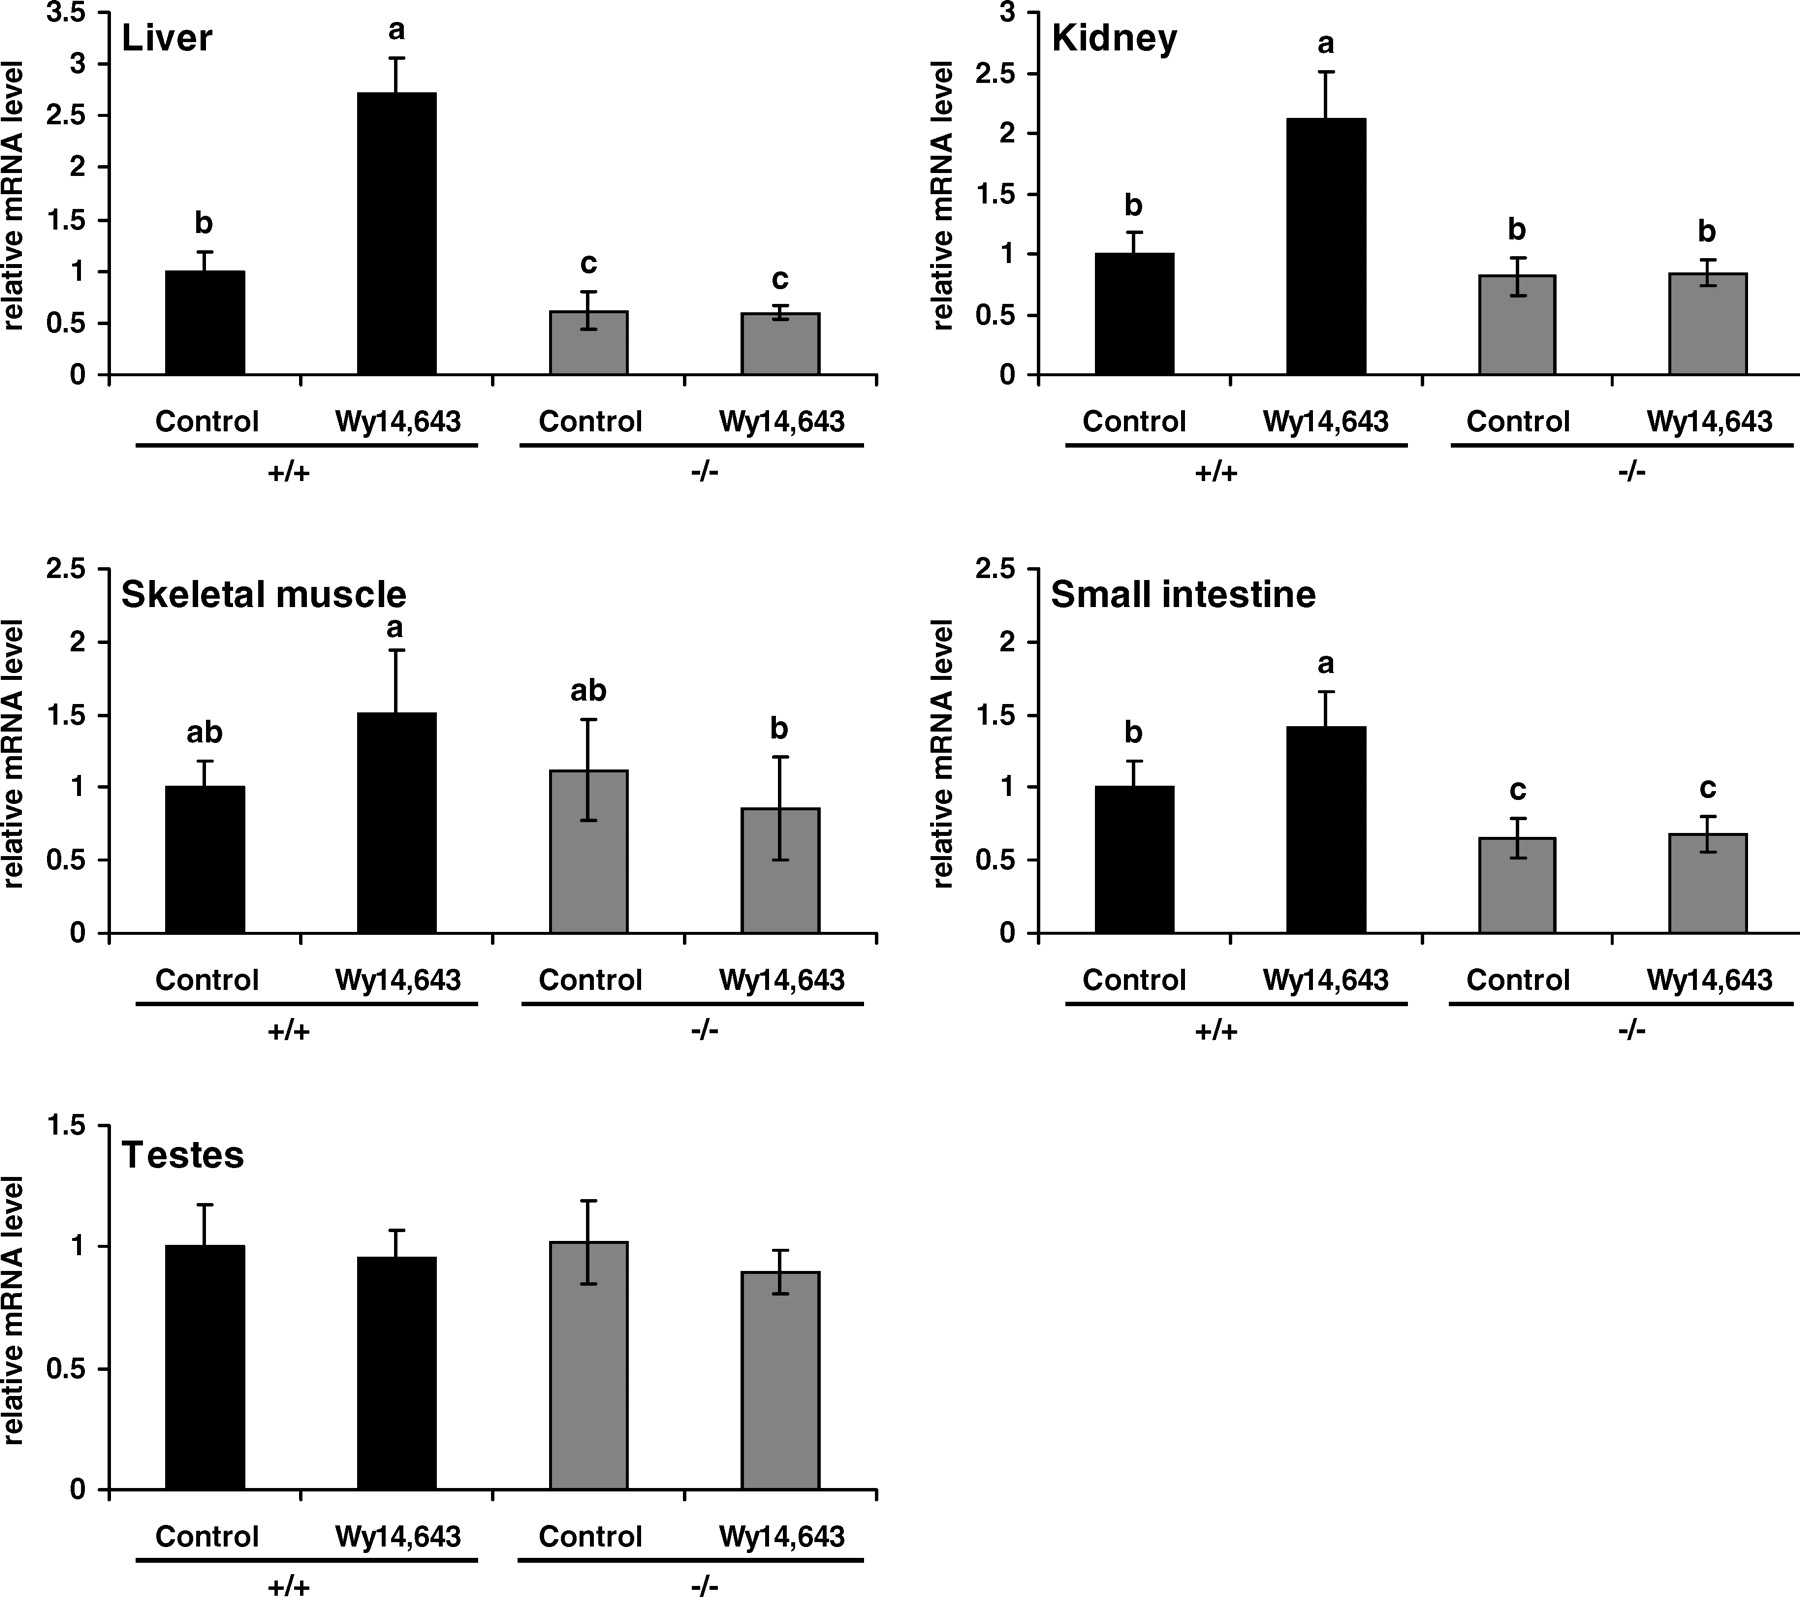
Effect of WY 14,643 on the relative ACO mRNA abundance in the liver, kidney, skeletal muscle, small intestine, and testes of wild-type (+/+) and PPARα−/− mice. Mice were treated orally with 40 mg/kg of WY 14,643 for 4 days. Control mice received the appropriate volume of the vehicle (sunflower oil and DMSO). Total RNA was extracted from tissues, and relative mRNA abundance was determined by real-time detection RT-PCR analysis using β-actin mRNA abundance for normalization. Values are the means ± SD (n = 8). Means with unlike letters differ (P < 0.05). The significance of factors for particular tissues was the following: liver, for treatment P < 0.05,for genotype P < 0.05, and for treatment × genotype P < 0.05; kidney, for treatment P < 0.05, for genotype P < 0.05, and for treatment × genotype P < 0.05; skeletal muscle, for treatment × genotype P < 0.05; small intestine, for treatment P < 0.05, for genotype P < 0.05, and for treatment × genotype P < 0.05. The P values for treatment and genotype in the skeletal muscle and the P values for treatment, genotype, and treatment × genotype in the testes did not reach significance.
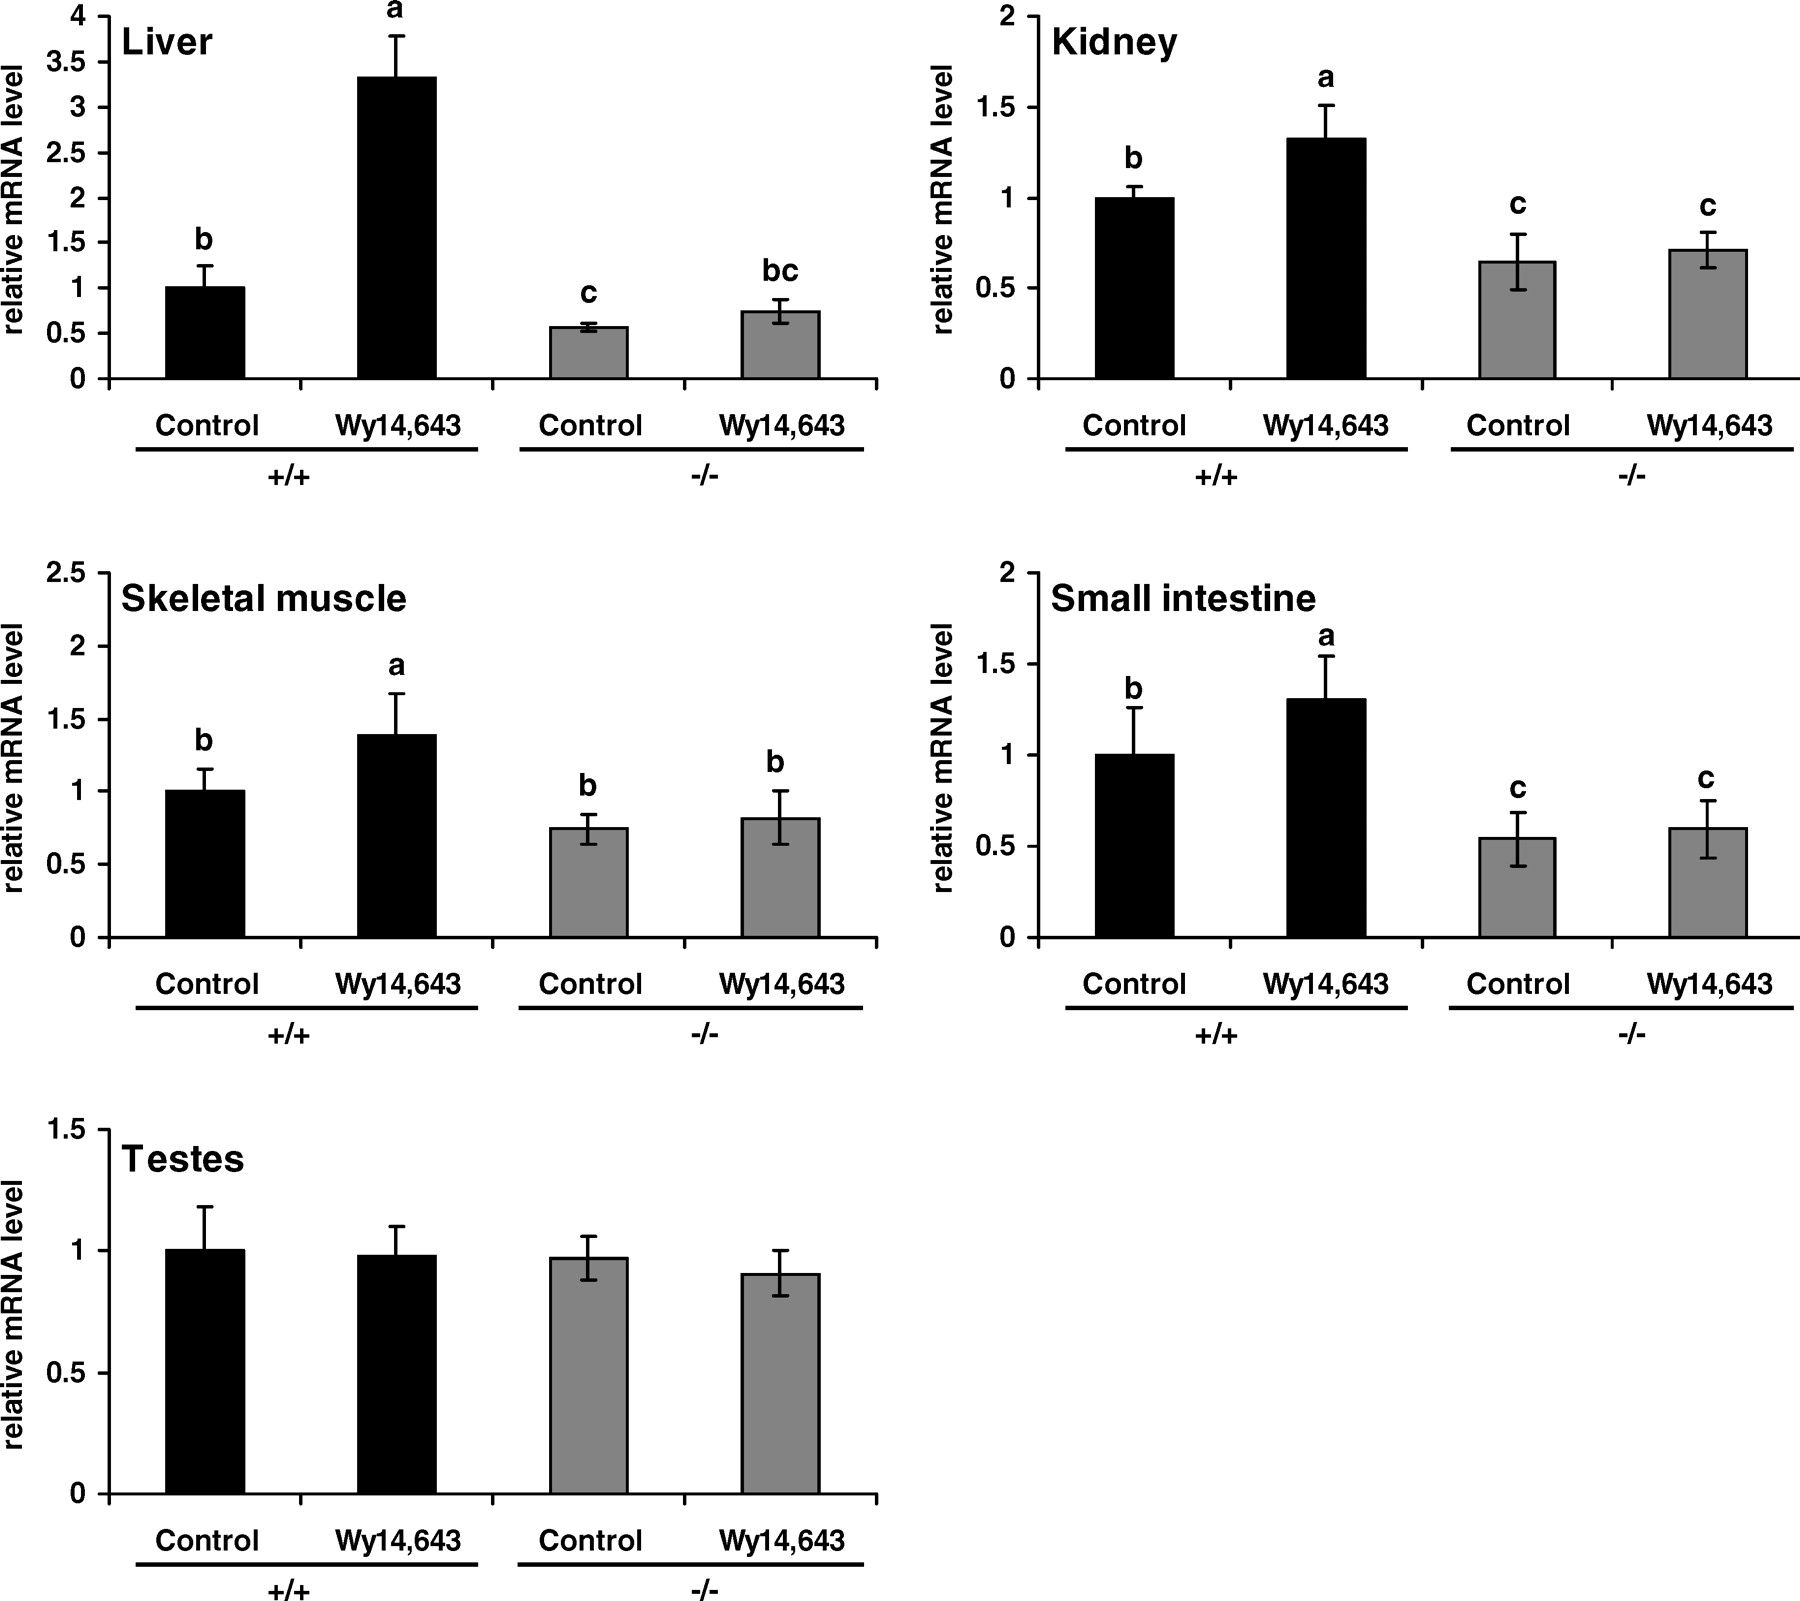
Effect of WY 14,643 on OCTN2 mRNA in the liver, kidney, skeletal muscle, small intestine, and testes of wild-type (+/+) and PPARα−/− mice. Mice were treated orally with 40 mg/kg of WY 14,643 for 4 days. Control mice received the appropriate volume of vehicle (sunflower oil and DMSO). Total RNA was extracted from tissues, and relative mRNA abundance was determined by real-time detection RT-PCR analysis using β-actin mRNA abundance for normalization. Values are the means ± SD (n = 8). Means with unlike letters differ (P < 0.05). The significance of factors for particular tissues was the following: liver, for treatment P < 0.05, for genotype P < 0.05, and for treatment × genotype P < 0.05; kidney, for treatment P < 0.05, for genotype P < 0.05, and for treatment × genotype P < 0.05; skeletal muscle, for treatment P < 0.05 and for genotype P < 0.05; small intestine, for treatment P < 0.05 and for genotype P < 0.05. The P values for treatment and for genotype in the testes and for treatment × genotype in the skeletal muscle, small intestine, and testes did not reach significance.
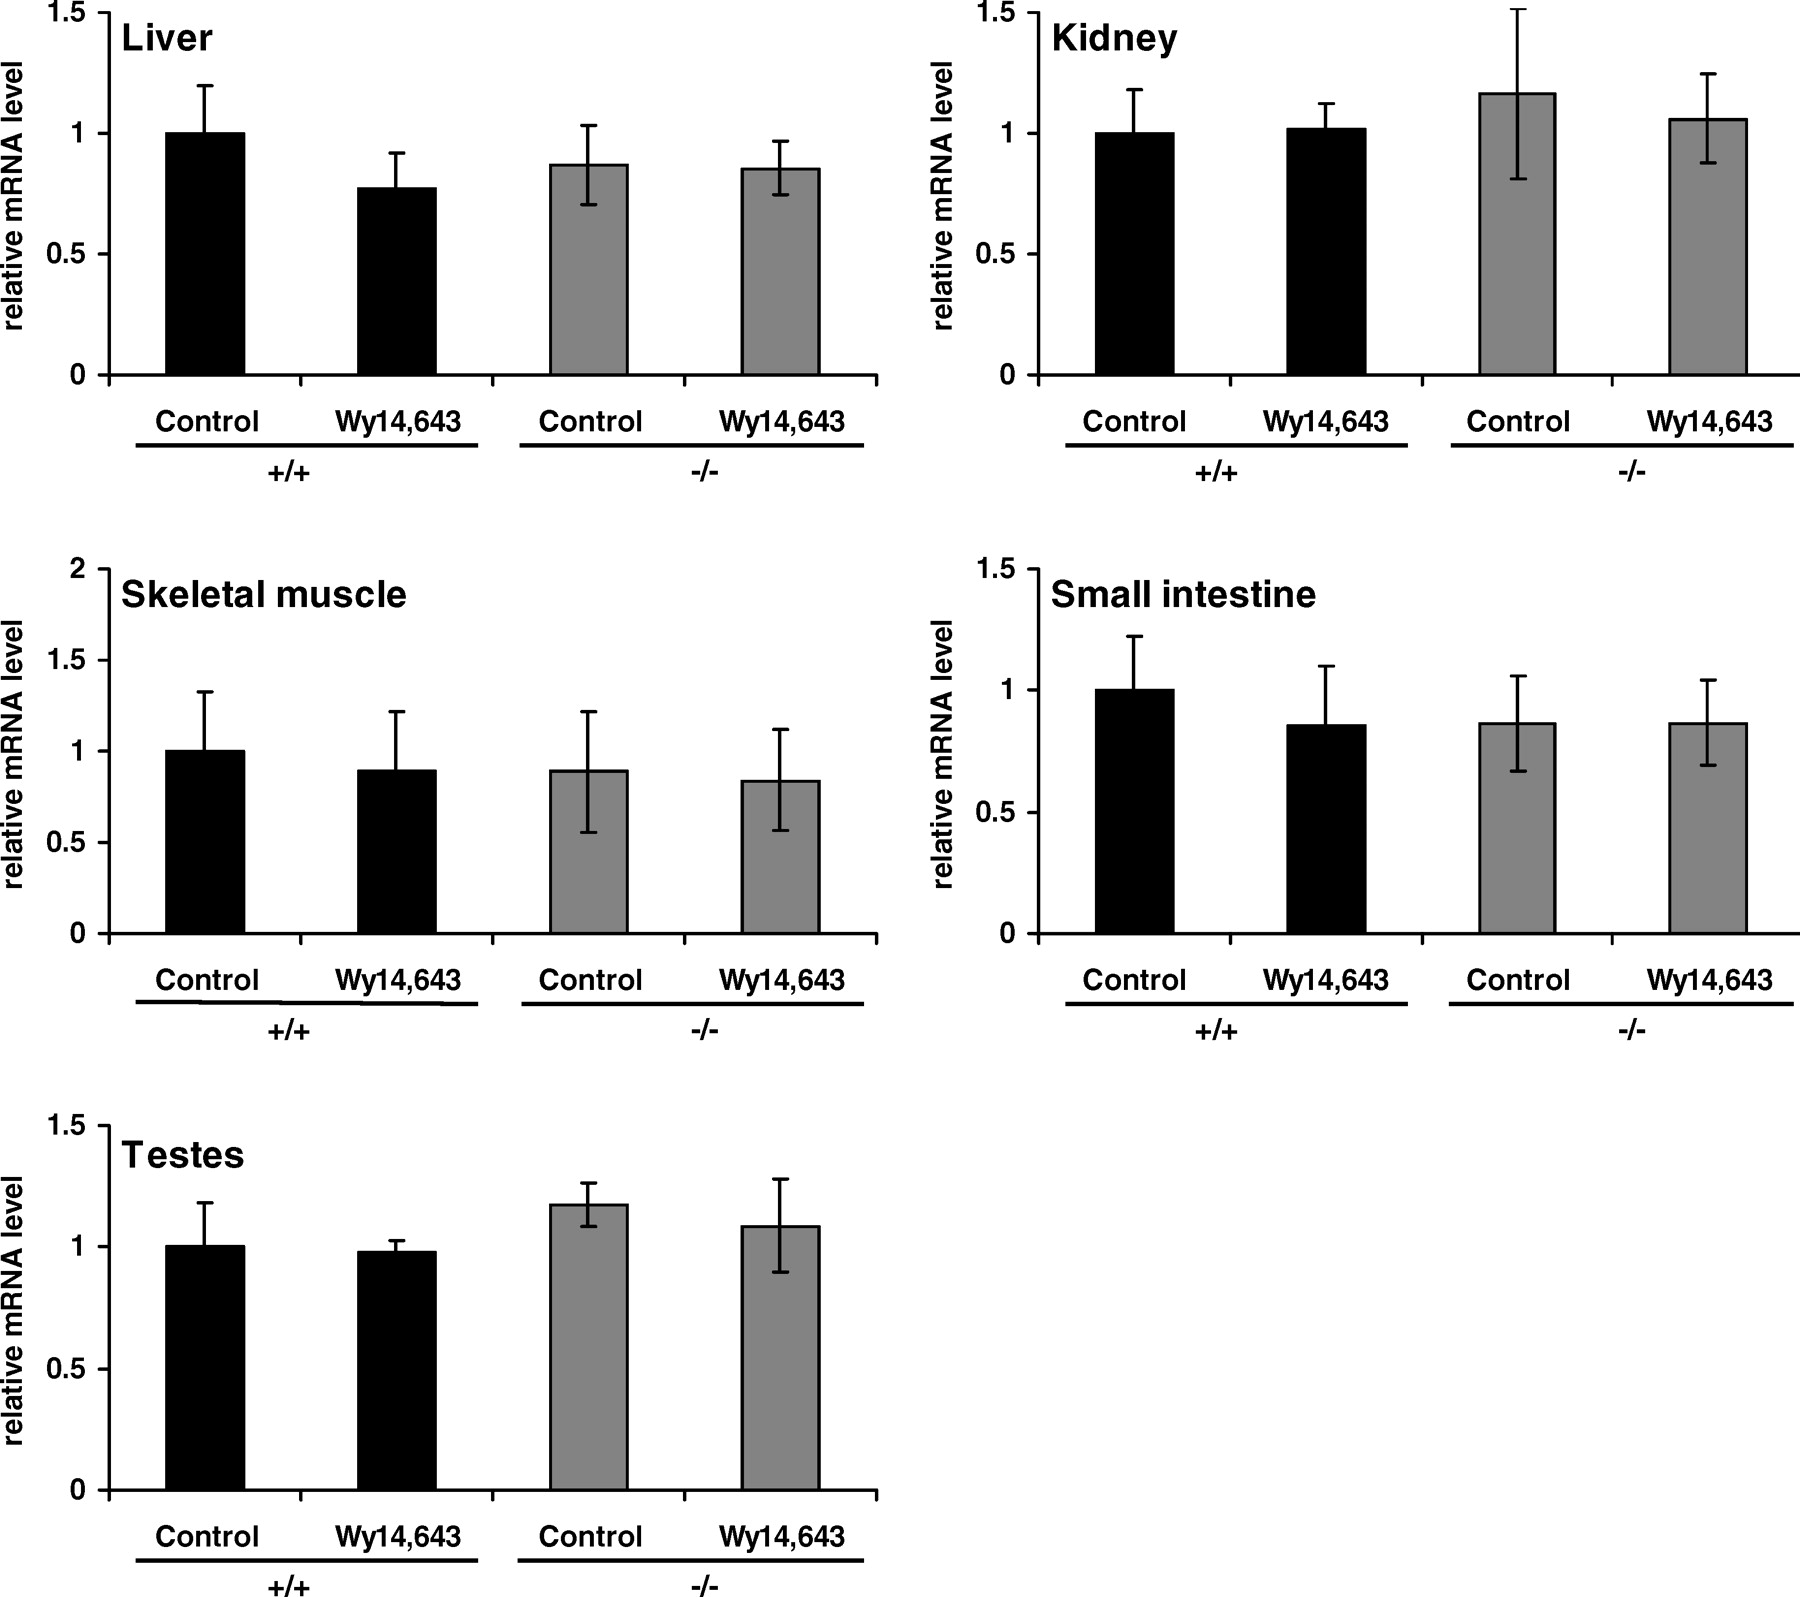
Effect of WY 14,643 on OCTN1 mRNA abundance in the liver, kidney, skeletal muscle, small intestine, and testes of wild-type (+/+) and PPARα−/− mice. Mice were treated orally with 40 mg/kg of WY 14,643 for 4 days. Control mice received the appropriate volume of vehicle (sunflower oil and DMSO). Total RNA was extracted from tissues, and relative mRNA abundance was determined by real-time detection RT-PCR analysis using β-actin mRNA abundance for normalization. Values are the means ± SD (n =8). Means with unlike letters differ (P < 0.05). There was no significant effect of treatment, genotype, and treatment × genotype interaction in any tissue.
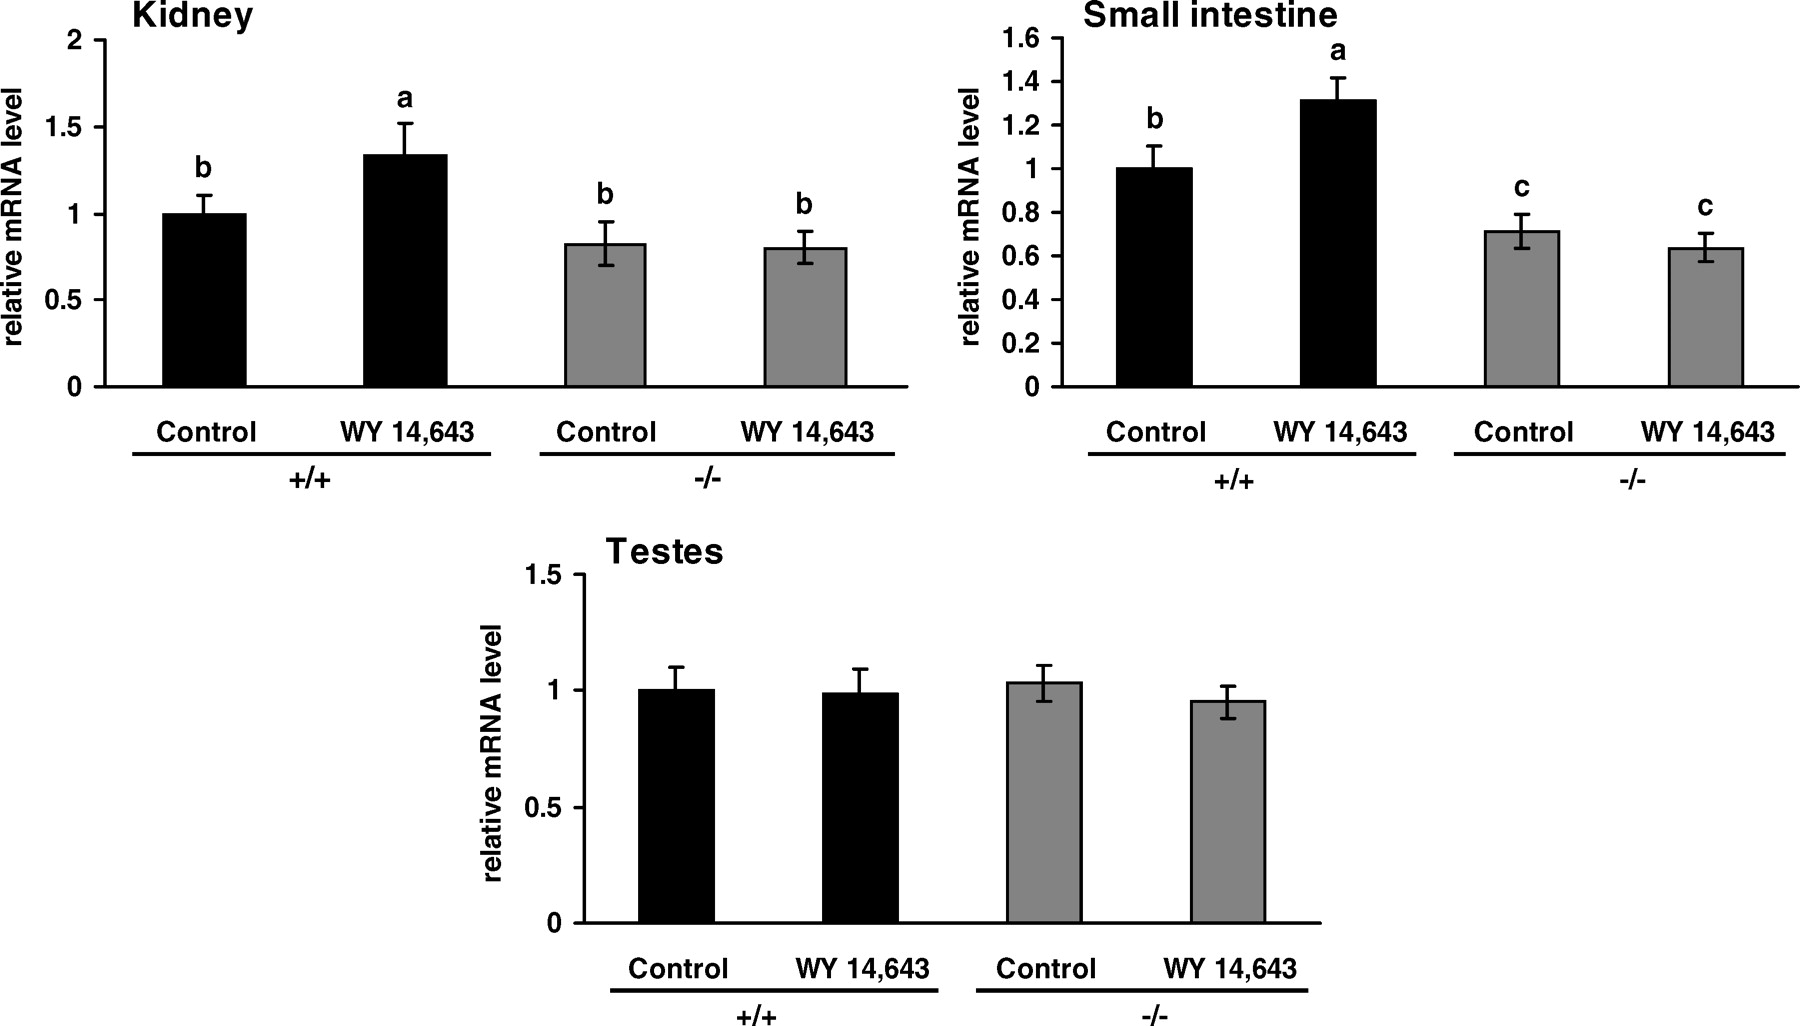
Effect of WY 14,643 on OCTN3 mRNA abundance in the kidney, small intestine, and testes of wild-type (+/+) and PPARα−/− mice. Mice were treated orally with 40 mg/kg of WY 14,643 for 4 days. Control mice received the appropriate volume of vehicle (sunflower oil and DMSO). Total RNA was extracted from tissues, and relative mRNA abundance was determined by real-time detection RT-PCR analysis using β-actin mRNA abundance for normalization. Values are the means ± SD (n = 8). Means with unlike letters differ (P < 0.05). The significance of factors for particular tissues was the following: kidney, for treatment P < 0.05, for genotype P < 0.05, and for treatment × genotype P < 0.05; and small intestine, for treatment P < 0.05, for genotype P < 0.05, and for treatment × genotype P < 0.05. The P values for treatment, genotype, and treatment × genotype in the testes did not reach significance.

Effect of WY 14,643 on mRNA abundance of enzymes involved in carnitine biosynthesis in the liver of wild-type (+/+) and PPARα−/− mice. Mice were treated orally with 40 mg/kg of WY 14,643 for 4 days. Control mice received the appropriate volume of vehicle (sunflower oil and DMSO). Total RNA was extracted from the liver, and relative mRNA abundance was determined by real-time detection RT-PCR analysis using β-actin mRNA abundance for normalization. Values are the means ± SD (n =8). Means with unlike letters differ (P < 0.05). The significance of factors for particular mRNAs was the following: TMLD, for genotype P < 0.05 and for treatment × genotype P < 0.05; TMABA-DH, for treatment P < 0.05, for genotype P < 0.05, and for treatment × genotype P < 0.05; BBD, for treatment P < 0.05, for genotype P < 0.05, and for treatment × genotype P < 0.05. The P value for treatment and TMLD mRNA abundance did not reach significance.
Footnotes
Acknowledgements
We thank F. Hirche for technical support in the measurement of carnitine concentrations.