



Abstract
The ability to sense intracellular or intraorganellar reduction/oxidation conditions would provide a powerful tool for studying normal cell proliferation, differentiation, and apoptosis. Genetically encoded biosensors enable monitoring of the intracellular redox environment. We report the development of chimeric polypeptides useful as redox-sensitive linkers in conjunction with Förster resonance energy transfer (FRET). α-helical linkers differing in length were combined with motifs that are sensitive to the redox state of the environment. The first category of linkers included a redox motif found in the thioredoxin family of oxidoreductases. This motif was flanked by two α-helices of equal length. The second and third categories of redox linkers were composed of α-helices with embedded adjacent and dispersed vicinal cysteine residues, respectively. The linkers containing redox switches were placed between a FRET pair of enhanced cyan and yellow fluorescent proteins and these constructs were tested subsequently for their efficacy. A robust method of FRET analysis, the (ratio) A method, was used. This method uses two fluorescence spectra performed directly on the FRET construct without physical separation of the fluorophores. The cyan/yellow construct carrying one of the designed redox linkers, RL5, exhibited a 92% increase in FRET efficiency from its reduced to oxidized states. Responsiveness of the cyan-RL5-yellow construct to changes in the intracellular redox environment was confirmed in mammalian cells by flow cytometry.
Introduction
The overall intracellular reduction/oxidation (redox) environment including organellar redox status exerts a profound influence on the normal cellular processes of DNA synthesis, enzyme activation, selective gene expression, cell cycle progression, proliferation, differentiation, and apoptosis (1–4). Thus, the ability to sense the redox environment in living cells and organisms has far reaching implications for understanding and manipulating basic cellular processes that underlie complex biomedical problems (5–8). Genetically encoded biosensors enable real-time and extended assessment of alterations in intracellular metabolism without cellular disruption (9–12).
A major advance for monitoring thiol redox potentials in live cells has resulted from the development of redox-sensitive forms of the green fluorescent protein (roGFPs) and the yellow fluorescent protein (rxYFP) (13–16). These redox biosensors have been characterized biochemically. Their spectroscopic and redox properties are quite different, and pitfalls of intracellular redox sensing using single spectroscopic probes have been comprehensively discussed recently (16).
Förster resonance energy transfer (FRET) is an optical technique whereby the excited state energy of a fluorescent donor molecule is transferred non-radiatively to a ground state acceptor molecule by means of long-range resonance coupling between the donor and acceptor transition dipoles (17). The distance (between 1 and 10 nm) and orientation between the donor and acceptor transition dipoles governs the efficiency of energy transfer. Because of this spatial sensitivity and signal specificity, FRET often provides an advantage over measurements with single fluorophores (18). Recently, the development of an extensive family of genetically encoded fluorescent proteins has led to several FRET metabolite biosensors (18–20). These sensors exploit FRET between two GFP variants (21).
Currently available redox biosensors employ single GFP variants, but do not employ FRET (15). In a FRET-based biosensor, a redox event induces a molecular conformational change in the redox sensor altering the distance between the FRET donor-acceptor pair, which in turn causes a detectable change in FRET efficiency as measured by changes in the emission spectra profiles (Fig. 1). The lack of linkers capable of both separating donor from acceptor and conferring redox sensitivity is a major drawback in engineering FRET-based redox biosensors. Current progress in the development of redox polypeptide switches makes this task achievable (22–26). In addition, the ability of helical linkers to control the distance and reduce the interference between GFP variants has been demonstrated recently (27–29).
Redox sensitivity in biological molecules is often mediated by thiol-containing cysteines, which can interact with vicinal thiols forming inter-or intramolecular disulfide bonds. For example, cysteine residues functionally involved in intracellular redox states via glutathione and thioredoxin pathways play a central role in mediating cellular responses to redox changes (9, 10). Formation and dissociation of disulfide bonds can significantly alter protein structure. Redox labile cysteine residues can form molecular switches by conferring functionality in one redox state (e.g., in the on-position) and attenuating the function in the opposite state (e.g., in the off-position).
In an attempt to build FRET-based redox biosensors, we present our first steps toward developing chimeric peptides serving as redox-sensitive linkers between donor and acceptor molecules. The linkers between the donor and acceptor molecules consist of α-helical structures in conjunction with different types of redox switches. The first switch represents the hexapeptide -WCGPCK- redox motif found in the thioredoxin family of oxidoreductases (30). The second and third switches consist of adjacent and dispersed cysteines embedded in an α-helical structure, respectively. The separation between donor and acceptor is varied by inserting helix-forming peptides of the general sequence A(EAAAK)NA (N=2–8) (27, 28, 31).
In this report, we explored the use of redox-sensitive linkers as a tool for engineering FRET-based genetically encoded biosensors. The common FRET-compatible pair of GFP variants, enhanced cyan fluorescent protein (ECFP) and enhanced yellow fluorescent protein (EYFP), was attached to various forms of designed redox linkers. The utility of the linkers was validated: (i) in vitro—through the constructs’ response to reduction with various concentrations of dithiothreitol (DTT) and ratios of oxidized and reduced forms of glutathione (GSSG/GSH); and (ii) in mammalian cell culture through oxidation and reduction with diamide and DTT. Finally, a convenient and robust method of measuring FRET efficiency is proposed for fusion fluorescent proteins. The high accuracy of the (ratio) A method of analysis allowed simple and straightforward comparisons of linker designs.
Materials and Methods
Experimental Strategy.
Three categories of redox linkers were designed and inserted between the GFP variants, ECFP and EYFP, using the two cloning strategies shown in Figure 2. In total, seven FRET-based constructs were built and tested for redox sensitivity.
The first category redox linkers (RL), RL1–RL3, included the redox-sensitive switch -WCGPCK- and a varying number of α-helical sequences (EAAAK)N (Table 1). This type of linker was designed to presumably have an open conformation when reduced and a low or baseline FRET signal. When oxidized the linker was expected to assume a more closed conformation, which would increase the FRET efficiency. The second category linker, RL4, had two pairs of adjacent cysteine residues introduced into the rigid α-helical structure. It was suggested recently that adjacent disulfides may be employed as a ‘redox-activated’ conformational switch based on the constrained nature of the disulfide turn and the pronounced difference observed between the oxidized and reduced states (32). In the third category, RL5 and RL6, four vicinal cysteines were rationally embedded into the α-helical structure. They presumably confer redox sensitivity by affecting a reversible helix-coil transition that can be monitored by a change in FRET signal. Finally, a rigid linker composed of proline residues, P14, was engineered as a conformational control. The FRET level of this molecule should not change under the varied redox conditions (i.e., oxidized and reduced).
Materials.
Enzymes for the modification of DNA and Lipofectamine 2000 were from Invitrogen (Carlsbad, CA) and oligonucleotides were obtained from Integrated DNA Technologies (Coralville, IA). pECFP-C1, pEYFP, pEYFP-N1, tryptone, yeast extract, and agar were purchased from BD Biosciences (Palo Alto, CA). Chinese hamster ovary (CHO) K1 fibroblasts were from ATCC (Manassas, VA). Agarose and acrylamide were from Fisher Scientific (Pittsburgh, PA). Ni-NTA agarose, QIAprep spin miniprep and QIAquick PCR purification kits were from Qiagen (Valencia, CA), the BSA kit was from Pierce (Rockford, IL), and Taq polymerase was from Eppendorf (Westbury, NY). HBSS, PBS, streptomycin, penicillin, Trypan blue, and trypsin were from GIBCO (Grand Island, NY). DTT, diamide, G418 sulfate, GSH, GSSG, and all other chemicals were purchased from Sigma (St. Louis, MO).
Genetic Constructs.
FRET constructs were based on pECFP-C1 to which various linkers and PCR amplicons of EYFP with an added C-terminal His-tag were introduced. The DNA fragments encoding the designed linkers shown in Table 1 were prepared by annealing and extending the appropriate oligonucleotide primer pairs with the cleavage sites for BglII/EcoRI (Table 2). Linkers were purified by QIAquick PCR purification or QIAquick gel extraction kits (Qiagen) and cloned into corresponding restriction sites of pECFP-C1. After cloning, the linkers were verified by sequencing from a specially designed primer ECFP-mcsRev (5′-CTCTACAAATGTGGTATGGCT-3′). The EYFP coding sequence for constructs carrying redox linkers RL1–RL3 and linker P14 was PCR amplified from pEYFP using primer set YFP1, which added a C-terminal His-tag, a BamHI site and a stop codon (Table 2). For constructs carrying RL4–RL6, the EYFP coding sequence was PCR amplified from pEYFP using another primer set, YFP4, which eliminated the KpnI and NcoI sites directly upstream of the EYFP gene making a single step subcloning of full NcoI/BamHI ECFP-linker-EYFP construct from the initial construct in the mammalian vector (pECFP-C1) to the prokaryotic vector (pET19b) possible, therefore, allowing E. coli expression (Fig. 2). PCR amplicons of the EYFP gene, EYFP1 and EYFP4, were purified, digested with KpnI/BamHI and EcoRI/BamHI, respectively, and cloned downstream of the linker sequence in pECFP-C1-Linker recombinants. The resultant fusion constructs were verified by restriction analysis and automated sequencing with the ECFP-mcsRev primer.
Cell Culture and Cell Sorting.
CHO fibroblasts were cultured in Dulbecco’s modified eagle medium (DMEM; Cell Media Facility, University of Illinois at Urbana-Champaign, Urbana, IL) supplemented with 10% fetal bovine serum (FBS), penicillin (50 U/ml), streptomycin (50 μg/ml) and Fungizone (0.25 μg/ml) at 37 °C in a humidified atmosphere of 5% CO2· CHO cells were transfected with pECFP-C1, pEYFP-N1 and engineered constructs in pECFP-C1 using Lipofectamine 2000 according to the manufacturer’s protocol. Successful transfection was determined by fluorescence microscopy using a Nicon EFD-3 with CCD camera C5985 (Hamamatsu Photonics, Hamamatsu City, Japan). For visualization, cells were seeded on glass cover slips or SonicSeal 4-well slides (Nalge Nunc, Rochester, NY). After one week of growth in the presence of 600 μg/ml G-418 sulfate, stable clonal cell lines were derived by fluorescence activated cell sorting using a MoFloTM MLS high speed flow cytometry instrument (Cytomation, Fort Collins, CO). CHO cells were gated by scatter properties to exclude debris and by fluorescence signals using 457 nm and 514 nm lasers to activate ECFP and EYFP, respectively. Stable transformants were derived by sorting one cell per well into a 96-well plate. Five or more different fluorescence intensity gates were used for cell sorting. FRET constructs CY-RL2 and CY-RL4 were not sorted.
Expression of Fusion Proteins in Mammalian Cells.
Clonal CHO cell lines expressing cyan-yellow constructs CY-RL1, CY-RL3, CY-P14 and unsorted cells with CY-RL2 were used for sample preparation. Cells cultured to confluence in 75 cm2 flasks (Corning, Corning, NY) were lifted, centrifuged, suspended in 2 ml of PBS, and lysed by sonication using a Tekmar Sonic Disruptor (Tekmar, Cincinnati, OH) set at 50% power in 6 cycles (20 s pulse/20 s rest per cycle). Crude extracts were clarified by centrifugation and stored at −20 °C until use.
Expression and Purification of Fusion Proteins in Prokaryotic Cells.
CY-RL4, CY-RL5 and CY-RL6 constructs were subcloned from pECFP-C1 recombinants into NcoI/BamHI sites of pET19b (Novagen, San Diego, CA). LB medium used for culturing cells was supplemented with 50 μg/ml ampicillin. E. coli BL21 (DE3) chemically competent cells (Novagen) were transformed with the resulting recombinant plasmids and plated on LB agar plates. Single colonies were used to inoculate 5 ml of LB medium and grown overnight at 37 °C. Overnight cultures were diluted 1:200 and grown in 200 ml LB medium to an optical density (600 nm) of 0.5. After protein expression induction with 1 mM IPTG, the cells were grown for 3 hrs at 37 °C and harvested by centrifugation. The cells were suspended in 5 ml of lysis buffer consisting of 50 mM NaH2PO4, 300 mM NaCl, 10 mM imidazole, pH 8.0, and lysed by sonication followed by centrifugation. Proteins were batch purified on Ni-NTA resins (Qiagen) following manufacturer’s protocol. Samples were desalted by repeated filtration through centrifugal concentrators Centricon-30 (Millipore, Billerica, MA) and diluted with buffer comprised of 50 mM NaH2PO4, 100 mM NaCl, pH 8.0. Protein content was determined by the BSA method (33).
Steady-state Fluorescence Spectroscopy.
All fluorescence measurements were carried out at 20 °C on a modified photon-counting fluorometer, ISS-PC (ISS, Champaign, IL). The magic angle condition (a 54.7° offset between the excitation and emission polarizer) was used to avoid polarization artifacts in the emission spectra. A 160 μl aliquot of diluted crude extract or 0.5 μM of purified construct was placed in a cylindrical microcell (3 mm diameter). To account for differences in the level of expression of FRET constructs in crude extracts, a direct correlation between levels of expression of GFP variants and their fluorescence intensity was used. For this purpose, samples were excited at 500 nm and prerecorded from 520 nm to 540 nm followed by dilution with a buffer consisting of 50 mM NaH2PO4, 100 mM NaCl, pH 8.0. Protein samples were pretreated with various concentrations of DTT or diamide for 5 min at room temperature. Subsequently, fluorescence emission spectra were acquired from 460 nm to 750 nm during excitation of ECFP at 440 nm and from 520 nm to 750 nm during excitation of EYFP with 500 nm light. The start of the emission wavelength scan was spaced by 20 nm from the excitation wavelength for all samples to avoid scattered light in the emission spectra.
All spectra were corrected for the wavelength dependent response of the emission monochromator and detector. All spectra were baselined by subtracting the mean value of the measured intensity from 730 nm to 750 nm, where the fluorescence intensity is zero. Fluctuations in lamp intensity were corrected automatically with a standard quantum counter. Routines in IgorPro (WaveMetrics, Lake Oswego, OR) software were written for data analysis and calculations using the fluorescence spectra.
(ratio)A Method for Determination of FRET Efficiencies In Vitro.
Steady-state fluorescence emission spectra were measured for the determination of the FRET efficiency. The (ratio) A method is a ratiometric method, which provides a sensitive, reproducible determination of FRET efficiencies (34). The (ratio) A is the ratio of the acceptor fluorescence due to energy transfer (from excited donor (D) fluorophores to acceptor (A)) to the directly excited acceptor fluorescence. The more efficient the energy transfer, the greater the acceptor molecules’ emission intensity, and the larger the value of the (ratio) A .
Three fluorescence emission spectra, as shown in Figure 3, are needed to measure the extent of energy transfer from donor to acceptor fluorophores by the (ratio) A method: (1) the emission spectrum of donor and acceptor molecules during selective excitation of the donor molecules, F DA ; (2) the emission spectrum of the acceptor molecules directly excited at the maximal absorption wavelength of the acceptor fluorophore, F A ; and (3) the emission spectrum of the donor fluorophore alone, in the absence of acceptor fluorophores, under the same solvent conditions, F D . The (ratio) A is calculated from these spectra as follows (35):
The excitation wavelengths λ exc D and λ exc a indicate the wavelengths for selective excitation of the donor or acceptor molecules. Doubly labeled F DA (λ exc D ) is composed of the fluorescence emission from both donor and acceptor molecules. The spectrum F DA (λ exc D ) is linearly decomposed with weighted components of previously recorded normalized F̂ D (λ exc D ) and F̂ A (λ exc A ) spectra. The weighted contribution of the donor, F D (λ exc D ), is then subtracted from F DA (λ exc D ) to give the contribution of F A (λ exc A )to the F DA (λ exc D ) spectrum (Fig. 3a). Thus, the numerator of Eq. (1) is the acceptor molecules’ fluorescence emission excited at λ exc D The magnitude of the numerator is determined by the efficiency of energy transfer from donor to acceptor molecules, with a small contribution of the direct excitation of the acceptor at λ exc D (some acceptor fluorescence that results from direct excitation of the acceptor is also present in F DA (λ exc D )). This contribution of directly excited acceptor (at λ exc D ) is subtracted from (ratio) A when calculating the FRET efficiency (see equation 2). The F̂ A (λ exc A )spectrum is measured directly on the D-A sample, so the denominator of Eq. (1) normalizes the FRET signal for sample-to-sample variation in concentration and fluorescence quantum yield of the acceptor molecules.
The FRET efficiency is then calculated according to Eq. (2),
where ε D and ε A are the extinction coefficients of the donor and acceptor at the relevant excitation wavelengths. Note that the extinction coefficients of the donor and acceptor molecules are needed for the relevant excitation wavelengths to calculate the FRET efficiency. The extinction coefficient ratio ε A (λ exc D )/ε A (λ exc A ) of Eq. (2) removes the fluorescence component of F DA (λ exc D ) resulting from direct excitation of the acceptor molecules at the donor excitation wavelength. A second extinction coefficient ratio, ε A (λ exc A )/ε D (λ exc D ), accounts for the different efficiencies of light absorption of the donor and acceptor molecules.
The (ratio) A values were calculated by measuring two fluorescence emission spectra per sample, as shown in Figure 3: the emission spectrum of ECFP and EYFP during excitation at 440 nm, where the absorbance of ECFP is dominant; and the emission spectrum of EYFP by excitation at 500 nm, where only EYFP absorbs. A third spectrum, the emission spectrum of pure ECFP (expressed without EYFP) excited at 440 nm, was recorded once for calculation of the (ratio) A values for all samples. FRET efficiencies, E, were calculated from the (ratio) A values as:
where the extinction coefficient ratios ε A (500 nm)/ε D (440 nm) = 1.8 and ε A (440 nm)/ε A (500 nm) = 0.076 have been substituted into Eq. (3). The extinction coefficients ratios were obtained using the extinction coefficients at the absorbance maxima reported in the literature: ε D (433 nm) = 26,000 cm−1M−1 and ε A (513 nm) = 84,000 cm−1M−1 (36, 37). Extinction coefficient spectra were calculated by multiplication of normalized fluorescence excitation spectra (provided by Clontech, Palo Alto, CA) for ECFP and EYFP by ε D (433 nm) and ε A (513 nm), respectively: ε D (440 nm) = 25,000 cm−1M−1, ε A (440 nm) = 3,300 cm−1M−1, and ε A (500 nm) = 44,000 cm−1M−1.
Caution should be taken in interpreting the (ratio) A if the absorption of the chromophore is sensitive to conditions such as ionic strength, pH, temperature, conformation changes, etc. For such cases, the extinction coefficients should be measured under all relevant experimental conditions. For our in vitro measurements (pH 8, constant temperature, and constant salt concentration), the absorption properties are expected to be stable.
GSH/GSSG Treatment.
Oxidized protein (≈0.5 μM) was incubated in buffer consisting of 50 mM NaH2PO4, 100 mM NaCl, pH 8.0, to which varying concentrations of oxidized (GSSG) and reduced (GSH) glutathione were added. Total concentration of glutathione was kept 10 mM. Treatment was performed for 10 min at 20 °C and spectra were collected as described above. Reduction potentials in millivolts for varying ratios of [GSH]2/[GSSG] were calculated from the Nernst equation (38).
Intracellular Analysis by Flow Cytometry.
CHO cells were cultured in 75 cm2 tissue culture flasks (Corning) to confluence and then trypsinized, centrifuged, and resuspended in 1X Hank’s buffered saline solution (HBSS) to 1.0 × 10⁶ cells/ml. Cells were treated with either 2 mM diamide or 2 mM DTT for 5 min at room temperature before data collection. To test for linker reversibility, the cells oxidized with 2 mM diamide were reduced with 2 mM DTT. FRET measurements were taken after each treatment.
All flow cytometric data were collected using a BD LSR II (Becton Dickson, San Jose, CA) instrument. In each experiment at least 10,000 cells were analyzed. The solid state Coherent Sapphire blue 488 nm laser line at 20 mW and the Coherent VioFlame PLUS violet 405 nm laser line at 25 mW were used to excite EYFP and ECFP, respectively. EYFP signals were collected using a 530/30 bandpass filter in the primary laser pathway. The ECFP and FRET signals were collected using 450/50 and 525/50 bandpass filters, respectively, along with a 505 long-pass dichroic splitter filter inserted into the 405-nm violet laser pathway. All data were analyzed using FACS Express Version 3 (De Novo Software, Thornhill, Ontario, Canada).
Results
The Redox Linker Comprised of the Hexapeptide -WCGPCK-.
The well-known, conserved peptide sequence -WCGPCK- has been introduced recently as a redox-active peptide probe to monitor both oxidation and reduction reactions (24). We hypothesized that the opening and closing of small disulfide loops between vicinal cysteines may also be employed in the linker design of FRET-based biosensors (39). To test this hypothesis, the redox-sensitive switch -WCGPCK- was introduced into a rigid polypeptide linker capable of separating GFP variants (27, 28). We developed three redox linkers (RL1–RL3) distinguished only by the number of α-helical units EAAAK to study the relationship between linker length and the dynamic range of FRET constructs (Table 1). Linkers were fused to ECFP and EYFP proteins as shown in Figure 2a. Chimeric protein constructs were expressed in CHO cells and validated in vitro by pretreatment with various concentrations of DTT. The typical profiles of emission spectra of FRET constructs before and after DTT treatment and their corresponding sensitized emissions are shown in Figures 4a and 4b, respectively.
Upon reduction by DTT, all three constructs exhibited a decrease in FRET efficiency (Fig. 4c). Pretreatment with 1–5 mM of the oxidant diamide before DTT addition did not change the FRET efficiency as precautions were not taken to protect the FRET proteins from oxidation during cell lysis (data not shown); this provided evidence that the linkers were oxidized during preparation of crude extracts. The largest change in FRET efficiency ΔE of 57.1% was observed with the cyan-RL1-yellow (CY-RL1) construct. Additionally, the effect of α-helix length on responsiveness of the construct to redox state was explored by decreasing the number of EAAAK units from both sides of the hexapeptide (Table 1). The shorter linkers exhibited a greater FRET efficiency indicating that donor/acceptor distance is controlled by a rigid α-helical component of designed linkers. However, the higher value of FRET efficiency for linker RL3 compared to RL1 did not necessarily correspond to a greater response of the FRET signal to the DTT treatment, as the FRET efficiency response was better for RL1 (Fig. 4c).
To demonstrate that changes in FRET during pretreatment with DTT were caused by the linker only and not by environmental sensitivity of EYFP, the FRET construct CY-P14 was used as a control (Fig. 4c).
Redox Linkers Comprised of Adjacent and Dispersed Cysteines.
The efficacy of adjacent cysteine residues to function as a redox switch in a FRET-based sensor was studied in linker RL4 (Table 1). Two pairs of adjacent Cys were introduced into an α-helical linker comprised of five EAAAK repeats separating ECFP and EYFP in the construct CY-RL4. Alternatively, two linkers RL5 and RL6 were designed with four cysteines dispersed throughout the α-helical structure used for RL4. Additionally, a helix-stabilizing N-cap Ser-Pro-Glu was introduced to the N-terminal end of linker RL5 (Table 1) (40).
The Molecular Operating Environment (MOE) software was used to choose the spatial locations of the cysteines and to visualize the different connectivity patterns of disulfide bonds in order to estimate their effect on the helix-coil transition (41). The disulfide bonding patterns that were implemented into linkers RL5 and RL6, and which led to the greatest transition, were observed with bonds between cysteines 1–4 and 2–3, and to a lesser degree 1–3 and 2–4, respectively. The precise placements of the cysteines in the linker to obtain the desired bonding pattern were further determined with the aid of disulfide connectivity prediction tools (42, 43).
In contrast to crude cell lysates of CHO cells harboring expressed CY-RL1, CY-RL2, and CY-RL3 constructs, the linkers comprised of adjacent and dispersed cysteines were tested on purified FRET constructs expressed in E. coli. The typical profiles of emission spectra for these constructs and their sensitized emissions are shown in Figures 5a and 5b, respectively. The response of CY-RL4, CY-RL5, and CY-RL6 constructs to DTT reduction followed similar patterns, with the largest change for CY-RL5 (Fig. 5c). Meanwhile, oxidation of constructs with diamide did not significantly affect FRET as mentioned above for constructs in crude cell lysates (data not shown).
The response of the linkers to changes in the redox environment from treatment by GSH/GSSG was demonstrated for linkers RL5 and RL6 (Table 3). However, the DTT treatment elicited a greater response than did the GSH/GSSG pretreatment.
Intracellular Analysis by Flow Cytometry.
To determine whether RL5 and RL6 were useful linkers for redox measurements in live cells, flow cytometric analysis was used to measure changes in FRET signal under oxidative and reductive insults provided by diamide and DTT, respectively.
The flow cytometric data show that both constructs exhibited an increased FRET signal when pretreated with diamide (Fig. 6a). After pretreatment with DTT, neither construct exhibited a significant response implying that the linkers were already in a reduced state. To test the reversibility of the linkers, CHO cells were pretreated with 2 mM diamide, the FRET signal was measured, and the same sample was then treated with 2 mM DTT. After the initial treatment with 2 mM diamide, FRET increased, indicating that linker RL5 went through helix-coil transition. Following the treatment with DTT, the FRET signal dropped to a level of untreated cells, indicating that the linker returned to its initial conformation (Fig. 6b). The same data were obtained for linker RL6 (data not shown). Altogether, these FRET data indicate that both linkers undergo reversible changes, depending on the redox state.
Discussion
We integrated recent advances in redox switch design (23, 25) with α-helical structures capable of separating GFP variants (27, 28) in order to create redox-sensitive linkers for FRET-based genetically encoded biosensors. We have demonstrated that redox-sensitive switches embedded into a polypeptide with a strong helix propensity enable monitoring of redox status under oxidized and reduced conditions both in vitro and in live cells. Further, we observed that the thioredoxin redox-sensitive hexapeptide, as well as adjacent and vicinal cysteines respond to changes in redox state although the dynamics of the linkers function differently. For instance, for the -WCGPCK- redox motif, the dynamics of the formation of the loop may lead to a more pronounced internal linker bend (39), increasing the efficiency of FRET. This is consistent with higher FRET efficiencies in constructs with shorter linkers in their reductive states. Remarkably, the FRET efficiency of RL3 ((EAAAK)N, N=2)) significantly exceeded that of RL2 ((EAAAK)N, N=4)), even though RL2 exhibited only a moderate superiority over RL1 ((EAAAK)N, N=8)) (Table 4). This is in spite of the fact that the number of EAAAK repeats deleted from RL1 to RL2 is twice than that from RL2 to RL3. These data indicate that FRET efficiency could be influenced by both the length of the linker and the orientation factor of the GFP variants (19, 44, 45). Furthermore, the presence of 11 additional amino acid residues between the designed redox linkers and EYFP in constructs CY-RL1–CY-RL3 should be taken into account when considering the distance between the ECFP/EYFP pair (Fig. 2a).
For the second category of redox linker, RL4, a disulfide bond is formed between adjacent cysteine residues, introducing a tight turn into the protein backbone. Polypeptide segments containing an oxidized Cys-Cys pair have been shown to bend when the two cysteine side chains protrude from the same side of the peptide backbone (32). Furthermore, a short peptide capable of undergoing a helix-coil transition suggested to be sufficient for the engineering of a FRET based biosensor was employed in the construction of the third category redox polypeptide (46). Thus, to achieve helical destabilization caused by a varying redox potential, four cysteine residues were introduced into the α-helix of RL5 and RL6. Although the α-helical structures for RL4, RL5, and RL6 are similar, we observed significant differences in the decreases in the FRET efficiencies when transitioning from oxidized (0 mM DTT) to reduced (10 mM DTT) states (41.8%, 92.4% and 70.8% for RL4, RL5 and RL6) (Table 4). These data may indicate that peptides undergoing helix destabilization upon a change in redox status provide more flexibility than those that respond with a turn in the protein backbone, allowing the two fluorophores to come closer together and increasing the FRET signal. Surprisingly, the FRET efficiency of reduced linkers is the same independent of the location of the reactive cysteines. This confirms that they are fairly rigid and that linker length is an important factor in defining FRET efficiency (Table 4). To facilitate the linker’s coil-to-helix transition and subsequently improve its reversibility, we introduced the Ser-Pro-Glu motif into RL5. This short sequence has been found to induce the formation of a local helical conformation in 90% of its occurrences (40). The cysteine residues in RL5 were arranged differently than in RL6 in order to retain optimal disulfide bonding patterns based on disulfide connectivity prediction tools (29, 30). Cell culture assays of RL5 and RL6 resulted in similar 49.2% FRET changes. However, this change was lower than in the in vitro assay (defined as [(FRET of oxidized cells-FRET of reduced cells)/FRET of reduced cells] × 100%).
All redox linkers tested herein respond reversibly to alterations in redox status by forming disulfide bonds causing conformational changes in the peptides, which translate into changes in FRET efficiency. This conclusion is supported by the absence of (i) redox sensitivity in construct CY-P14 with a polyproline linker and (ii) intermolecular interactions for the CY-RL1 construct containing the thioredoxin redox motif demonstrated by non-denaturing PAGE and Western blot analysis (47).
Additionally, this study demonstrates the utility of the (ratio) A method for linked GFP variants. This self normalizing analysis is convenient, reproducible, and accurate. We recommend the (ratio) A analysis as a convenient method for characterizing FRET biosensors, especially as they are developed towards optimal dynamic ranges suitable for microscopy.
FRET measurements using GFP variants linked by a polypeptide are often based on hydrolytic cleavage of the linker by incorporating a site for peptidases. The required digestion steps and repeated spectral measurements (before and after digestion of the linker) are time consuming. The (ratio) A method for determining FRET efficiencies does not require such an intermediate step. Only two fluorescence spectra are recorded per sample. The digestion step is not needed for the (ratio) A method since the (ratio) A unambiguously identifies FRET.
The (ratio) A method has been used extensively for accurate determination of FRET efficiency (35, 48–51). It is demonstrably reproducible since: (i) sample-to-sample variations in fluorophore concentration are automatically corrected; and (ii) changes in the acceptor fluorophores’ fluorescence quantum yield, induced by changes in the microenvironment of the acceptor chromophores, are automatically canceled. Therefore, the (ratio) A method allows a global comparison of the FRET efficiencies for many samples. Figure 7 illustrates the power of the (ratio) A to discriminate the sensitivities of the various linkers. For comparison, the peak intensity ratios of EYFP and ECFP fluorescence (EYFP/ECFP) for the oxidized and reduced forms of the linkers were calculated using the fluorescence emission spectra collected with selective excitation of ECFP, F DA (λexc D = 440 nm). The EYFP/ECFP intensity ratio is inherently much nosier than the (ratio) A and performs poorly in detecting subtle changes in FRET.
For the experiments reported here, the (ratio) A conveniently corrected for variations in the fluorescence intensity of EYFP during titrations of reducing and oxidizing agents. Since the method is simple and does not require instrumentation beyond a fluorometer, the (ratio) A is applicable for in vitro studies of GFP-based biosensors.
In summary, the present investigation demonstrates the utility of engineered redox-sensitive linkers for development of genetically encoded FRET-based redox biosensors. Their effective performance in vitro was reliably determined by the (ratio)A method. Further studies are warranted to improve dynamic range and characterize redox properties, which will define the practical range of the linkers. Finally, based on the findings presented herein, redox-sensitive biosensors should provide a suitable means of probing intracellular or intraorganellar redox conditions, and thereby enhance understanding of normal and aberrant cell growth and metabolism.
Structure of Redox-Sensitive Linkers a
Primer Sets Used for Construction of Linkers (5′–3′)
FRET Efficiency Response of Constructs to GSH/GSSG Treatment a
FRET of ECFP-Linker-EYFP Constructs at Oxidized and Reduced States
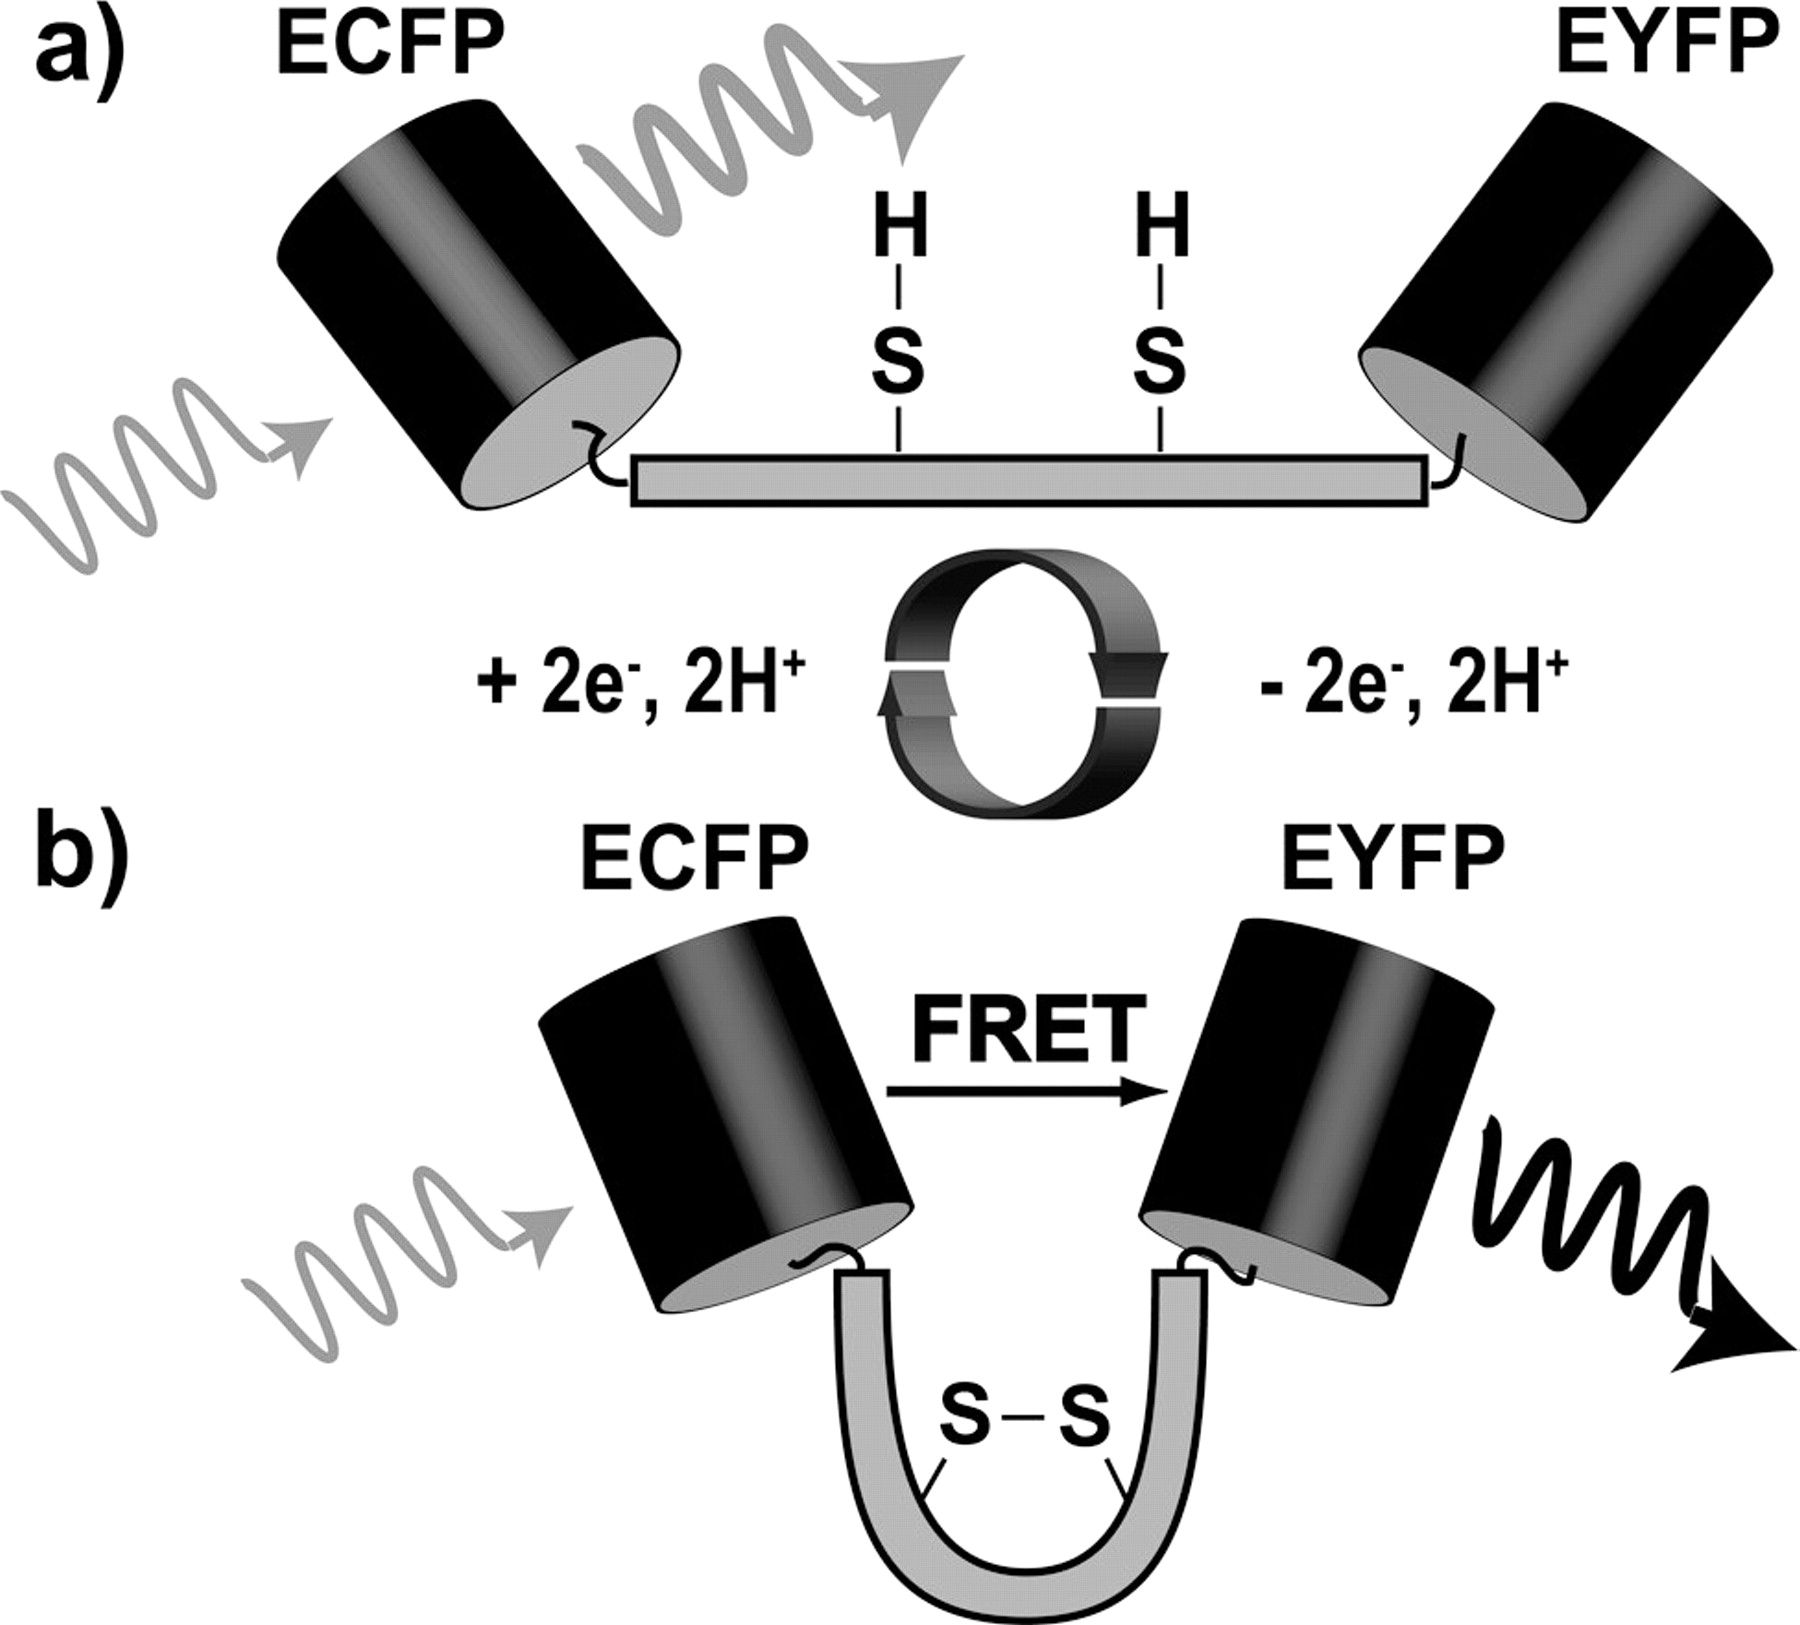
Schematic of the redox sensitive “switching” mechanism for a single molecule. (a) Because the donor and acceptor are separated by an α-helical structure, FRET is unlikely in the reduced state of the construct and photon emission from the donor (ECFP) is highly probable (gray arrow); (b) in the oxidized state, a disulfide bond forms causing the linker to bend such that the probability for a FRET response increases. The high FRET state may be detected by monitoring the fluorescence emission (black arrow) of the acceptor (EYFP). Reduction of the disulfide bond switches the linker back to the low FRET state, as shown in (a).

Diagram of the FRET constructs with linker designs ordered chronologically: (a) linkers RL1–RL3 and P14; and (b) linkers RL4 - RL6.

Typical fluorescence emission spectra used for calculating the (ratio) A . The vertical axes are emission intensities normalized by the lamp intensity and horizontal axes are the emission wavelengths. (a) The fluorescence spectra needed to calculate the (ratio) A are as follows: the FRET construct emission during excitation at 440 nm (circle markers); the acceptor emission for the construct directly excited at 500 nm (dashed line); and the normalized donor emission for the ECFP-only sample excited at 440 nm (solid line). (b) The extracted acceptor emission obtained by subtracting the solid line from the circle marker spectrum. The amplitude of the extracted acceptor emission is indicative of the amount of energy transfer. Normalization to EYFP intensity (dashed line) corrects for sample-to-sample variations in concentration and fluorescence quantum yield for global comparison of (ratio) A values.

(a) Fluorescence emission spectra of the CY-RL1 construct at 20 °C, where the solid line corresponds to an untreated construct and the dashed line to construct pretreated with 10 mM DTT. Crude cell lysate was excited at 440 nm and spectra were normalized to the intensity of the ECFP peak (475 nm). (b) Sensitized emissions from the EYFP (extracted acceptor fluorescence) for the construct CY-RL1 in correspondence with DTT treatment. DTT treatment decreases the acceptor fluorescence due to reduced FRET. (c) FRET response to DTT treatment for constructs CY-RL1–CY-RL3 and CY-P14. Values given are the average of four replicates ±SD. Differences of calculated FRET efficiencies between untreated (0 mM DTT) and DTT treated constructs CY-RL1, CY-RL2, and CY-RL3 were statistically significant (p < 0.05, ANOVA) except for 1 mM DTT. Significant differences were not observed for the polyproline P14 linker (white bars; p > 0.05, ANOVA).

(a) Fluorescence emission spectra of purified CY-RL5 construct pretreated as defined in Figure 4. (b) Sensitized emissions for the construct CY-RL5 in correspondence with DTT treatment. (c) FRET response to DTT treatment for constructs CY-RL4–CY-RL6. Values given are the average of five replicates ±SD. Differences of calculated FRET efficiencies between untreated and DTT treated constructs were statistically significant (p < 0.05, ANOVA) except for 1 mM DTT for CY-RL4 (p > 0.05, ANOVA).

(a) Histogram of flow cytometric data for construct CY-RL5 in CHO cells showing a change in the FRET signal. The dashed and the solid lines correspond to 2 mM diamide treatment and untreated cells, respectively. The ordinate (“Count”) is the number of cells counted, and the abscissa (“FRET intensity”) is the fluorescence intensity excited at 405 nm and collected through a 525 nm filter with halfwidth of 25 nm. (b) A bar graph demonstrating the response of CY-RL5 in CHO cells to oxidation/reduction. The bar graph represents the geometric mean of each histogram averaged over three cell counting histograms ±SD. Cells were pretreated with either 2 mM diamide or 2 mM DTT. The untreated cells are marked as “–”. “+/+” indicates that the cells were initially oxidized with 2 mM diamide followed by a reduction with 2 mM DTT in order to show that the disulfide bonding is fully reversible. Significant differences were not observed among control untreated cells and those treated with DTT only or with both DTT and diamide (p > 0.05, paired t-Test). However, cells treated with diamide were significantly different from those subjected to the other treatments (p > 0.05, paired t-Test).

Dynamic ranges† of the (ratio) A and of the peak intensity ratio EYFP/ECFP provide a direct comparison of the (ratio) A to the fluorescence intensity ratio method used by earlier studies for evaluating FRET sensors (i.e., the ratio of EYFP to ECFP peak fluorescence emission intensities by excitation at ECFP’s peak absorption wavelength – “EYFP/ECFP”).
Footnotes
This work was supported by National Institutes of Health (NIH) Grant: R21-EB-004513 to PJA Kenis and HR Gaskins and National Science Foundation (NSF) Grant: DBI 03–52678 to RM Clegg.
2
Current address: McCracken & Frank LLP, Chicago, IL 60606
Acknowledgements
We thank Barbara Pilas and Ben Montez at the Flow Cytometry Facility of the University of Illinois Biotechnology Center as well as Jerome Baudry, School of Chemical Sciences for assistance with the MOE program.