



Abstract
High glucose (HG) increases angiotensin II (AngII) generation in mesangial cells (MC). Chymase, an alternative AngII-generating enzyme, is upregulated in the glomeruli of diabetic kidneys. In this study, we examined AngII synthesis by human MC via angiotensin-converting enzyme (ACE)-dependent and chymase-dependent pathways under normal glucose (NG, 5 mM) and HG (30 mM) conditions. NG cells expressed ACE and chymase mRNA. Under NG conditions the chymase inhibitor chymostatin reduced AngII levels in cell lysates and in the culture medium, and the ACE inhibitor captopril had no effect. HG induced a 3-fold increase in chymase mRNA and protein but not in ACE mRNA; however, HG induced a 10-fold increase in intracellular ACE activity. The increase in AngII generation induced by HG was found in the cell lysate but not in the culture medium. The rise in intracellular AngII was not prevented by captopril or by chymostatin. Moreover, captopril inhibited extracellular ACE activity but failed to block intracellular ACE activity; these results suggested that captopril was unable to reach intra-cellular ACE. Losartan did not change the intracellular AngII content in either NG or HG conditions, and this lack of change suggested that the increase in AngII was due to intracellular generation. Together these results suggest that chymase may be active in human MC and that both ACE and chymase are involved in increased AngII generation during the HG stimulus by different mechanisms, including an upregulation of chymase mRNA and a rise in intracellular ACE activity, favoring the generation and accumulation of intracellular AngII.
Introduction
The octapeptide angiotensin II (AngII) exerts a wide range of physiologic and pathophysiologic effects on the cardiovascular, renal, endocrine, and nervous systems. Intrarenal AngII has significant effects on renal function and urinary sodium excretion (1). Mesangial cells (MC) express all components of the renin-angiotensin system (RAS) and are able to generate AngII locally (2). In addition, intrarenal synthesized AngII appears to be involved in the renal dysfunction observed in many progressive renal diseases, including diabetic nephropathy (3).
Classic angiotensin-converting enzyme (ACE)-dependent AngII formation has been well characterized. However, there is growing evidence that some mechanisms of AngII generation in the tissue RAS are ACE-independent. It has been reported that chymase, a serine protease, also converts AngI to AngII (4, 5). Chymase is present in many tissues, including heart muscle and blood vessels, although, unlike ACE, chymase is not found in plasma (4). It has been demonstrated that the most important function of this alternative pathway is in the cardiovascular system, where AngII generation is predominantly chymase-dependent (5, 6), as evidenced by the fact that AngII formation is substantially blocked by chymase inhibitors such as chymostatin, NK3201, and CD41 (7–9).
Chymase is also expressed in normal human kidneys. In a recent immunohistochemical study using human kidney tissue, Huang et al. found that chymase expression was faint in glomeruli and vascular smooth muscle cells of normal kidneys, whereas it was markedly upregulated in diabetic kidneys (10). Indeed, Urata et al., employing Western blot and enzymatic assays, achieved the same conclusion: chymase is expressed at very low levels in total human kidneys but presents moderate activity in the kidney cortex (11). However, it has been shown that intracellular AngII generation is unchanged in ACE-knockout mice, a phenomenon attributed to the impressive increase in chymase activity in this model (12). These findings suggest that chymase-dependent AngII generation is less relevant than the ACE pathway in the normal kidney, although chymase expression and activity might be regulated by mechanisms that are activated under certain pathophysiologic conditions and when ACE is inhibited or absent.
The relative contributions of ACE and chymase to AngII generation in kidney tissue remain controversial, and the chymase contribution to AngII synthesis in MC is unknown. Therefore, this study was designed to evaluate the differential roles that ACE and chymase play in AngII synthesis in human MC (HMC). The generation of AngII was analyzed in the presence and absence of ACE and chymase inhibitors (captopril and chymostatin, respectively). In addition, because local synthesis of AngII by MC is stimulated under high-glucose (HG) conditions (2, 13), we evaluated the participation of chymase and ACE in this phenomenon. We found that HMC are able to synthesize AngII by using ACE-dependent and chymase-dependent pathways. HG levels induced upregulation of chymase but not ACE gene expression. In contrast, HG induced an impressive increase in intracellular ACE activity. Despite the activation of both pathways, neither chymase nor ACE inhibition was efficient in reducing intracellular AngII formation under HG conditions.
Methods
HMC Culture and Experimental Conditions.
Immortalized HMC, kindly supplied by Dr. Berhard Banas (Munich, Germany), were cultured in Dulbecco’s modified Eagle’s medium (DMEM) containing 10% fetal bovine serum (FBS), 5 mM glucose, and antibiotics (50 U/ml penicillin and 50 mg/l streptomycin). Culture flasks were stored in a humidified environment at 37°C in an atmosphere of 95% O2 and 5% CO2. The medium was replaced every 36 hrs. At semiconfluence, cells were rinsed twice with phosphate-buffered saline, divided into groups, and immersed in fresh culture medium containing no FBS.
To evaluate the roles that chymase and ACE play in AngII generation in HMC under normal glucose (NG) and HG conditions, chymase and ACE mRNAs and AngII generation were analyzed in HMC under pharmacologic inhibition of ACE and chymase activities. The following cell groups were analyzed: NG (DMEM containing 5 mM
Expression Levels of ACE and Chymase mRNAs.
ACE and chymase mRNA expression in HMC was first determined by classic reverse transcriptase polymerase chain reaction (RT-PCR), and the levels of that expression were estimated by quantitative real-time polymerase chain reaction (PCR) analysis. Total RNA was purified by using the phenol and guanidine isothiocyanate–cesium chloride method (TRIzol kit; GIBCO-BRL Life Technologies, Carlsbad, CA). The RNA pellet was resuspended in RNase-free water. Two micrograms of total RNA were pretreated with DNase and then reverse transcribed into cDNA by the addition of a mix containing 0.5 mg/ml oligo-dT, 10 mM dithiothreitol, 0.5 mM dNTPs (Pharmacia Biotech, Pittsburgh, PA), and 200 U of reverse transcriptase (Superscript RT; GIBCO BRL). The mixture was incubated at 37°C for 1 hr and then at 95°C for 5 mins. Primer sequences for amplification of ACE and chymase were based on cDNA sequences obtained from GenBank and were designed by using the Designer PCR program (Research Genetics, Huntsville, AL). For each PCR set, negative controls (for contamination from exogenous sources) were performed by replacing cDNA with water. A positive control (for chymase amplification) was performed by using saphenous vein cDNA. Standard PCR was performed in a thermal cycler (PTC-100; MJ Research, Waltham, MA) using 2 μl of reverse-transcribed cDNA. The levels of expression were estimated through real-time RT-PCR by using the GeneAmp 5700 and ABI Prism 7700 Sequence Detection Systems (Applied Biosystems, Foster City, CA). The cDNA was synthesized from 1 μg of total RNA extracted from each group of cells as described above. Real-time PCR product accumulation was monitored by using the intercalating dye SYBR Green I (Molecular Probes, Carlsbad, CA), which exhibits a higher fluorescence upon the binding of double-stranded DNA. Relative gene expression was calculated by using early PCR stage conditions, under which amplification is logarithmic and can be correlated to the initial transcript copy number. Fluorescence for each cycle was quantitatively analyzed by using the ABI Prism 7700 Sequence Detection System (Applied Biosystems). At the end of PCR, the temperature was increased from 60°C to 95°C at a rate of 2°C/min. Fluorescence was measured every 15 secs to construct the melting curve used to verify the absence of nonspecific amplification products. The results were normalized to β-actin amplification, and the relative gene expression of each molecule was calculated by considering the control group as the standard and was expressed in arbitrary units.
Western Blot Analysis for Chymase.
Chymase protein expression level was determined by standard Western blot. Cells were lysed (buffer: 50 mM Tris, pH 8.0; 150 mM NaCl; 1% Nonidet P-40; 0.5% sodium deoxycholate; 0.1% sodium dodecyl sulfate; 2.5 mM EDTA; 1 mM phenylmethylsulfonyl fluoride; and 44 mM o-phenanthroline) and centrifuged, and the protein concentration was determined by the Folin method with reagents from Bio-Rad (Bio-Rad DC Protein Assay; Hercules, CA). Fifty micrograms of protein were separated on a 10% sodium dodecyl sulfate–polyacrylamide gel and transferred to a nitrocellulose membrane (Amersham Pharmacia Biotech, Piscataway, NJ) at 4°C by using transfer buffer containing 25 mM Tris-HCl, 192 mM glycine, and 20% methanol. Nonspecific binding was blocked with 5% nonfat dry milk in TBS buffer containing 10 mM Tris-HCl (pH 7.5) and 200 mM NaCl; washing in TBS at room temperature followed. Immunoblots were then incubated overnight at 4°C with the monoclonal antibody against human chymase (Abcam, Cambridge, UK) or antibodies against β-actin (Sigma-Aldrich). Membranes were incubated for 1 hr at 4°C with anti-mouse peroxidase-conjugated secondary antibody (Sigma Aldrich). Detection of specific protein bands was accomplished with enhanced chemiluminescence by using the ECL Plus detection system (Immobilon Western, Chemiluminescence HRP substrate; Millipore Corporation, Billerica, MA) and recorded on x-ray film (Amersham Hyperfilm ECL, GE Healthcare Limited, Tokyo, Japan). Optimally exposed autoradiographs were digitally scanned and analyzed by using an imaging densitometer (Bio-Rad GS670; Bio-Rad) and Quantity One-GS710 software (Bio-Rad).
AngII Measurement by Enzyme-Linked Immunoabsorbent Assay (ELISA).
Levels of AngII were determined in cell extracts and culture media. Confluent cells were washed twice with cold phosphate-buffered saline, and washing was followed by the addition of 0.4 ml of extraction buffer containing 20 mM Tris-HCl, pH 7.4; 10 mM EDTA; 5 mM ethylene glycol tetraacetic acid; 5 mM β-mercaptoethanol; 50 μg/ml phenylmethylsulfonyl fluoride; and 0.1 μg/ml aprotinin (Sigma-Aldrich). Cells were scraped in the extraction buffer and centrifuged for 3 to 5 mins in a microfuge to obtain the insoluble pellet fraction. The supernatants were used for AngII measurements as well as for protein content determination by the Folin method (Bio-Rad). Levels of AngII were determined by using a commercially available ELISA kit including avidin-streptavidin (Peninsula Laboratories, San Carlos, CA). Samples and standards were incubated with anti-AngII antibody and biotinylated angiotensin II (B-AngII) in 96-well plates coated with Staphylococcus aureus protein A. After incubation, the unbound B-AngII was removed by washing, and the bound B-AngII was determined by streptavidin-HRP reaction using tetramethyl benzidine dihydrochloride (TMB) and H2O2 as substrates. The reaction was terminated with 2 N HCl, and the color intensity in each well was read at 450 nm by using an ELISA microtiter plate reader (Thermo Labsystems, Franklin, MA). The amount of AngII in each well was calculated from the standard curve and is expressed in milligrams of cell protein.
ACE Enzymatic Activity Assay.
The ACE catalytic activity was fluorometrically measured in the culture medium and intact cells by using 5 mM hippuryl-
Statistical Analysis.
Results are expressed as the mean ± SEM. Data were analyzed by one-way ANOVA and subsequently by the Tukey test. Unpaired Student’s t test was used when appropriate. P < 0.05 was considered statistically significant.
Results
Figure 1A shows that HMC in culture expressed chymase mRNA, and HG caused a 3-fold increase (P < 0.05) in chymase mRNA levels, whereas HG induced no significant change in ACE mRNA expression. The increase in the mRNA expression was followed by protein synthesis as shown in Figure 1B.
The relative contribution of both ACE and chymase to AngII synthesis was evaluated under pharmacologic inhibition of these enzymes in intact cells. After treatment the AngII content was determined in the cell lysates and in the culture media in HMC exposed to NG or HG with simultaneous treatment with captopril or chymostatin. Under NG conditions, captopril had no effect on intra-cellular AngII concentrations (Fig. 2A) and extracellular AngII concentrations (Fig. 2B), whereas chymostatin caused discrete but significant decreases in AngII levels in the cell lysate and culture medium. Compared with NG, HG induced a significant increase in the intracellular AngII content (Fig. 2A), as previously observed (2). Captopril and chymostatin partially prevented the HG-induced intracellular increase in AngII (Fig. 2A), and these values remained between those of the HG and NG groups. Compared with NG, HG did not change the AngII levels in the culture media (Fig. 2B). Captopril and CMT had no effect on extracellular AngII under HG stimulation.
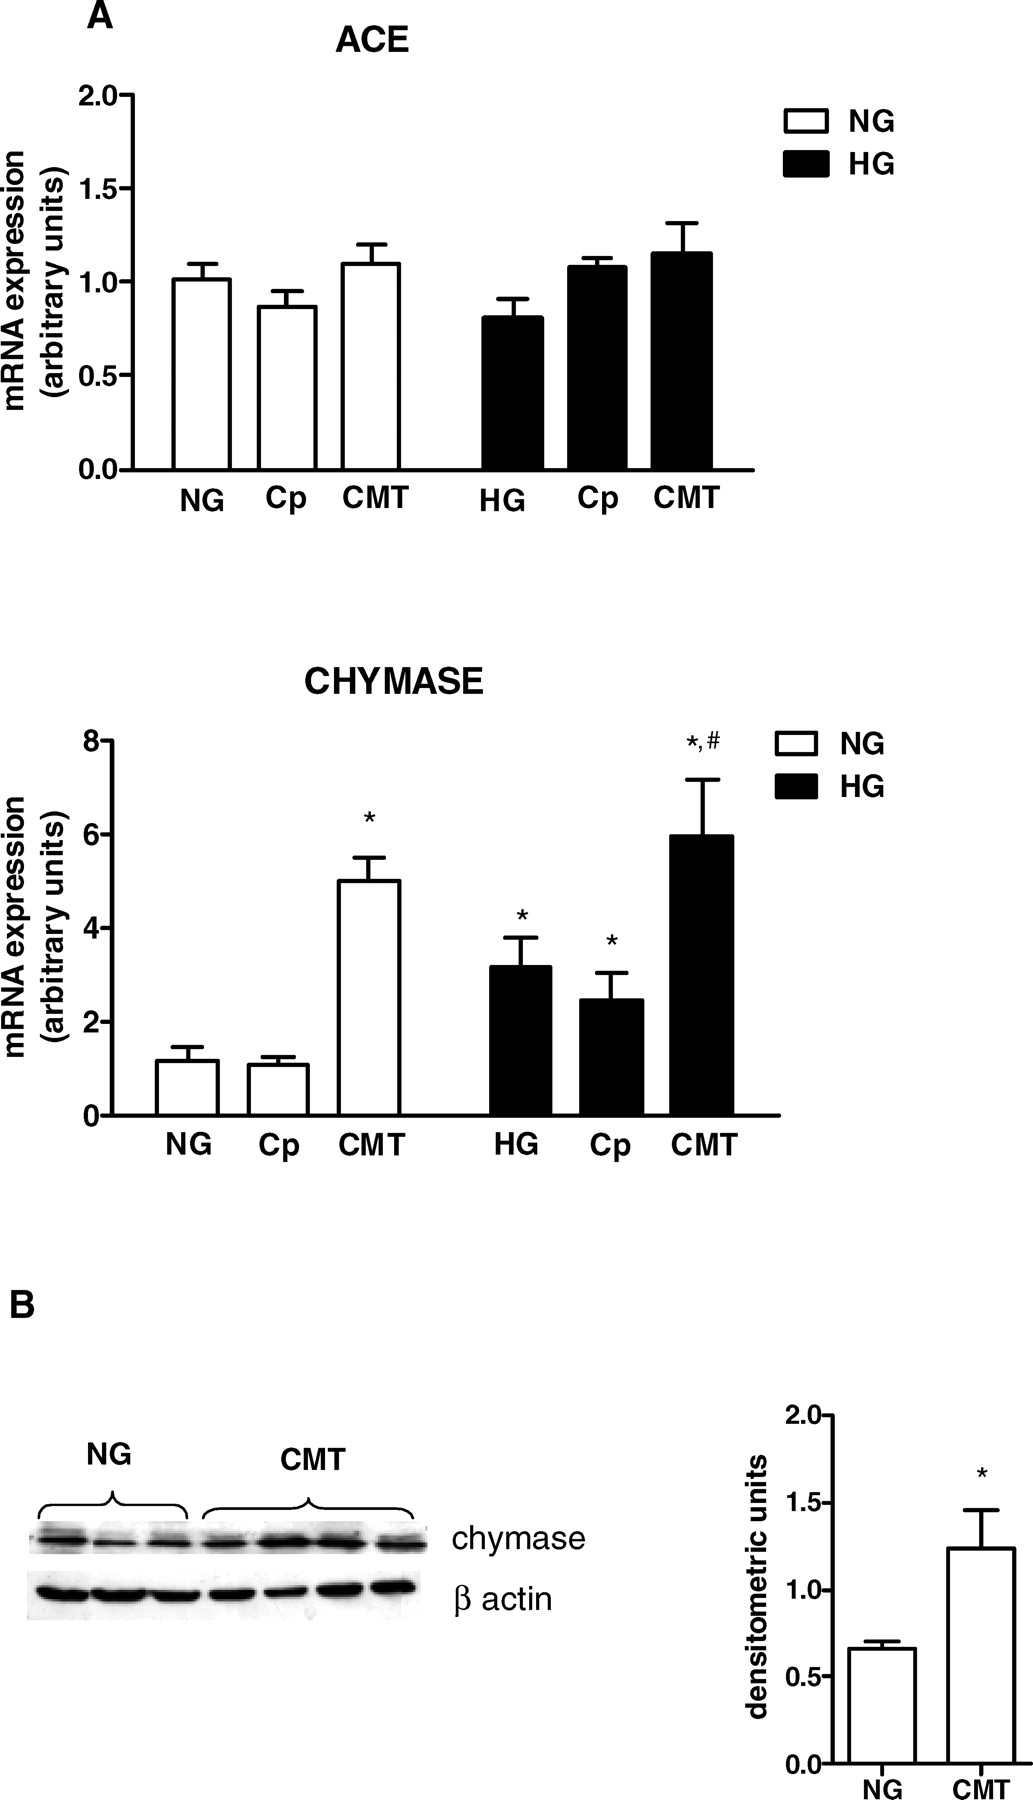
To understand the effects of captopril and chymostatin on AngII synthesis, we evaluated whether the enzyme inhibitors would alter gene transcription of ACE and chymase. The HG stimulus did not change ACE mRNA levels (Fig. 3A). Also, ACE gene transcription was not modified by captopril or chymostatin treatments under NG and HG. In contrast, chymase mRNA (Fig. 3A) and protein levels (Fig. 3B) were significantly increased by chymostatin treatment in NG conditions. A further increase in the mRNA was observed in HG conditions. ACE inhibition induced by captopril had no effect on chymase mRNA expression.
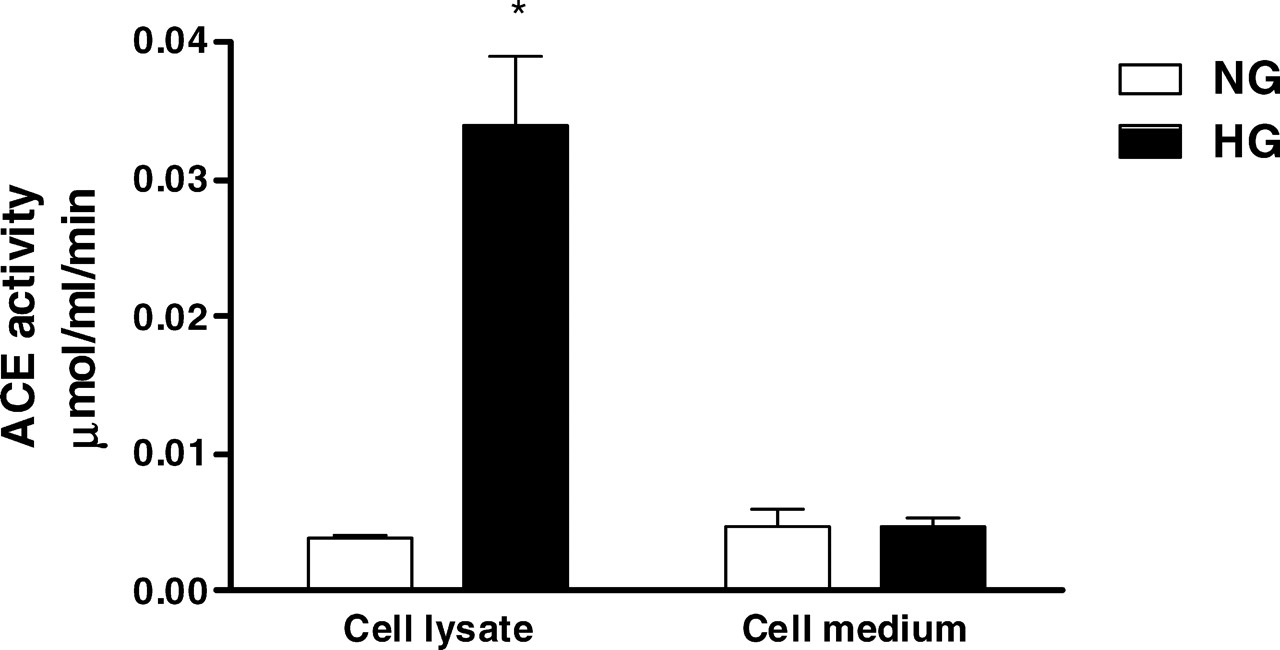
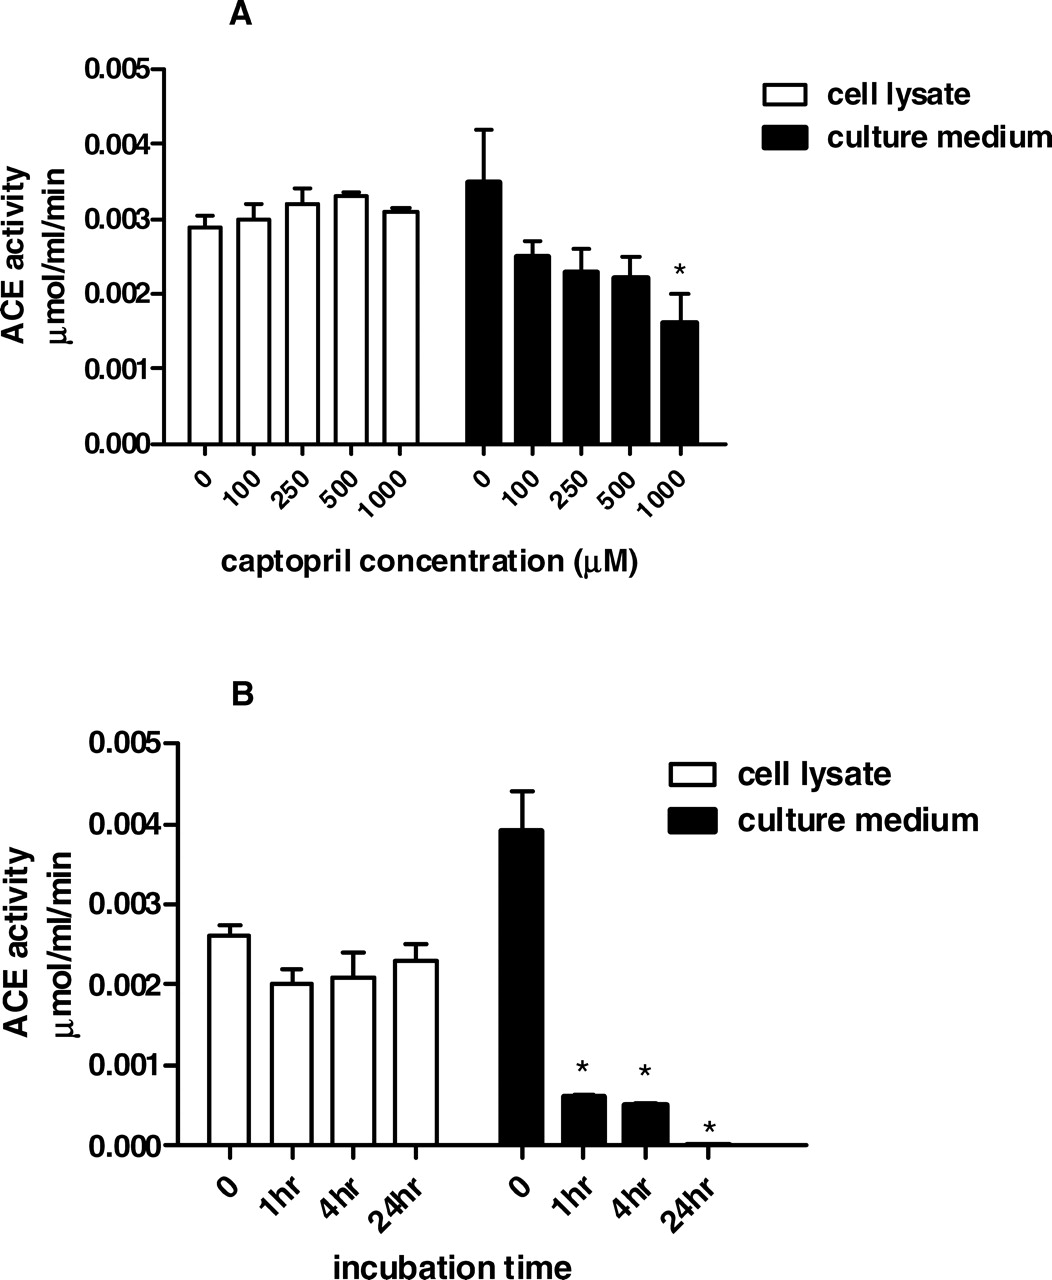
Because ACE gene transcription was not modified by the HG environment, we next analyzed the effect of HG on ACE activity, which was measured in cell lysates and in the culture medium. As shown in Figure 4, HG induced a 10-fold increase in intracellular ACE activity but did not change the enzyme activity in the culture medium. Despite this impressive ACE stimulation by the HG milieu, captopril failed to reduce AngII content in NG-stimulated and HG-stimulated cells. Next we attempted to verify the efficiency of captopril in blocking ACE activity in intact mesangial cells. The initial dose of captopril used in these experiments was based on studies conducted by King and Oparil (14), which demonstrated that 1 mM was the most efficient captopril dose to inhibit ACE activity in endothelial cells. ACE activity was measured in cell lysates and in the culture medium after exposing cells to different concentrations of captopril (Fig. 5A) or different incubation times (Fig. 5B). There was time-dependent and dose-dependent ACE inhibition in the culture medium; in contrast, captopril was unable to block ACE activity in the cell lysate in any concentration or incubation time used in the present protocol.
We analyzed the effect of the AngII type 1 receptor (AT1) antagonist losartan on the intracellular content of AngII. Figure 6 shows that losartan treatment did not modify intracellular AngII levels in either NG or HG conditions.
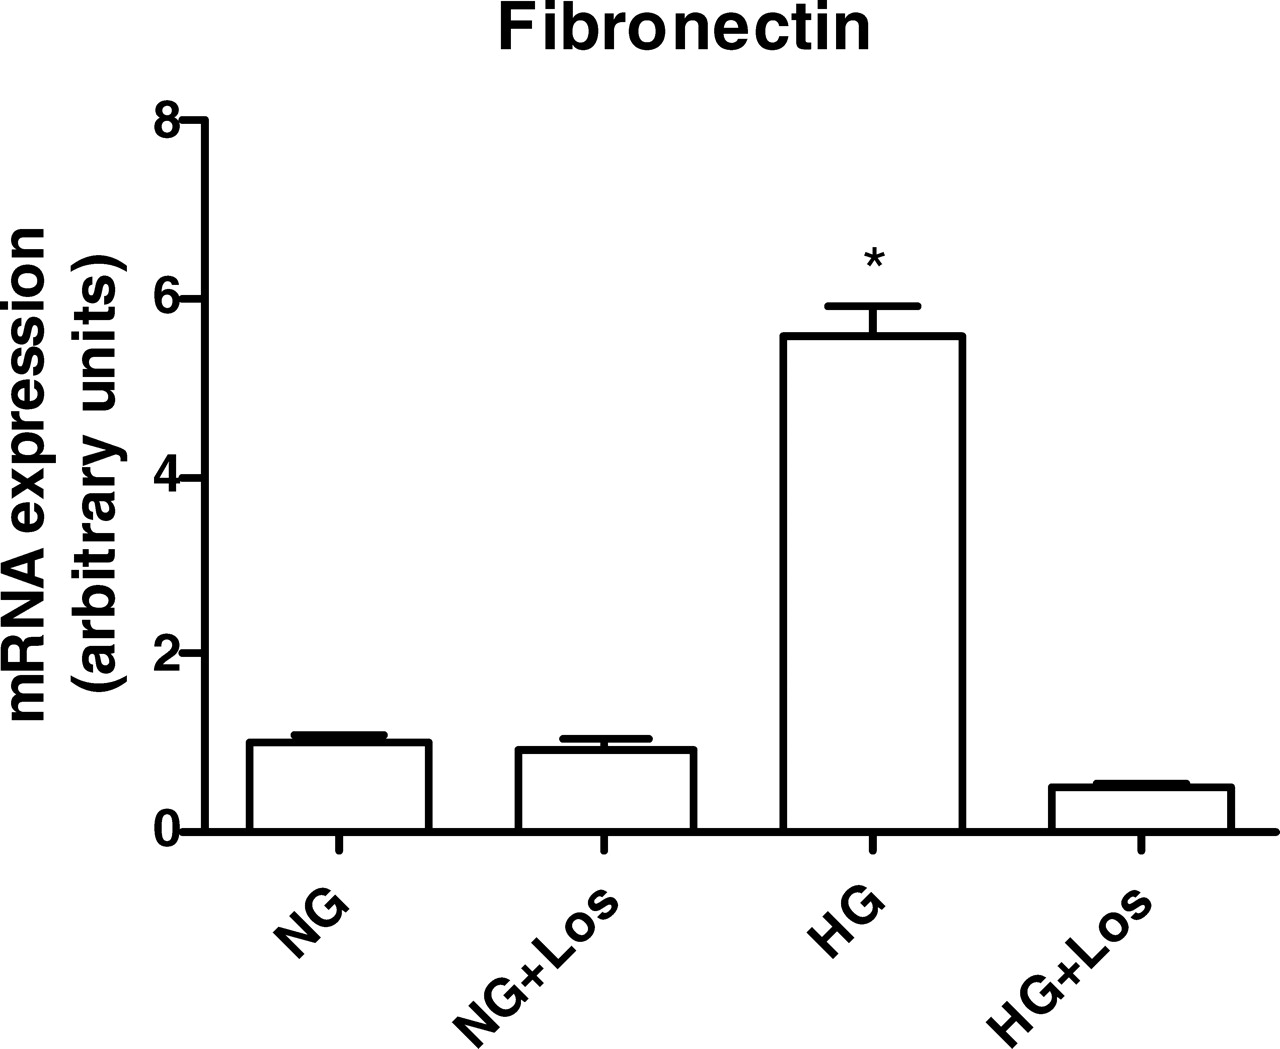
The HG environment is known to increase mesangial matrix production and secretion, which is mediated by AngII. To demonstrate that intracellular actions of AngII are increased in MC under an HG stimulus, we evaluated the effect of HG on fibronectin gene transcription in the absence and presence of losartan. Figure 7 shows that HG induced a 5-fold increase in fibronectin mRNA levels, which was completely blunted by losartan.
Discussion
The glomerular changes associated with diabetic nephropathy are attributed, at least in part, to intrarenal RAS activation. The increased intrarenal AngII production might serve to mediate the mesangial proliferation, matrix expansion, and glomerular sclerosis that are characteristic of diabetic nephropathy (18). In patients with diabetic nephropathy, the combination of AngII receptor blockers and ACE inhibitors affords greater protection than does monotherapy (19), providing evidence that RAS activation in the diabetic kidney involves ACE-dependent and ACE-independent mechanisms. In this study, we evaluated AngII generation by ACE and chymase pathways in HMC under NG and HG concentrations.
NG Conditions.
Previous studies from our laboratory and others (2, 13, 20, 21) have demonstrated that MC in culture express all the components of RAS, including angiotensinogen, renin, and ACE, which are potentially able to locally generate AngII. ACE is a membrane-bound peptidyl dipeptidase that is also found in a soluble form derived from the membrane-bound protein through the action of ACE secretases (22), suggesting that ACE may be involved in AngII generation at the cell surface. Moreover, previous detection of active soluble forms of ACE in MC lysates (21, 23) suggests a role for this enzyme in the intracellular generation of AngII by those cells. We showed in the present study that under NG conditions captopril had no effect on the AngII content either in the cell lysates or in the culture media. This result is in agreement with recent data published by Singh et al. (24), which showed that captopril did not change either the intracellular or the extracellular AngII content in rat MC cultured in NG media. It has been proposed that the binding of ACE inhibitors to the extracellular loops of the enzyme (and secreted forms) reduces extracellular conversion of AngI to AngII (25). Although it has been suggested that MC are able to secret active ACE (21), the failure of captopril to reduce extracellular AngII suggests that the AngII found in the culture media was more likely to have been derived from the intracellular stock than from the cell surface. In contrast, captopril also failed to significantly reduce intracellular AngII in intact cells, a finding indicating that captopril was unable to inhibit intracellular forms of ACE in the experimental conditions used in the present study. To test this hypothesis, we evaluated the effect of captopril on ACE activity in intact cells. We found that captopril was efficient in blocking extracellular ACE but not intracellular ACE. This finding could be a consequence of the inability of captopril to cross the plasma membrane and to reach intracellular ACE and/or a high intracellular rate of captopril catabolism, as also proposed by Singh et al. (24). Therefore, these results suggest that captopril is efficient in reducing circulating or extracellular AngII generation, but it may not be suitable to inhibit intracellular AngII synthesis, at least in HMC maintained under NG concentrations. Another possibility to explain the failure of captopril to reduce AngII synthesis is that ACE may not be the predominant pathway of AngII synthesis in HMC under NG concentrations.
We found that HMC also express chymase mRNA; this result indicates that this alternative pathway to generate AngII is probably active in these cells. Actually, chymase inhibition by chymostatin reduced intracellular and extra-cellular AngII levels by 35% and 50%, respectively; this inhibition suggests that chymase constitutes an active pathway for AngII generation in HMC. Studies in cardiac mast cells have shown that chymase is synthesized and stored in intracellular granules and that it is activated before secretion (26, 27). The present result suggests the presence of active chymase in both intracellular and extracellular compartments and that this enzyme participates in AngII generation under physiologic conditions in HMC. Concerning chymase gene regulation, we found that chymostatin induced significant upregulation of chymase mRNA, indicating that chymase gene transcription is influenced by enzyme activity, which might induce a feedback response in the gene regulation.
HG Conditions.
Intracellular AngII production is increased in MC exposed to high levels of glucose as demonstrated by our group and by others (2, 13). In contrast, the level of extracellular AngII was not changed by HG conditions; this lack of change suggests a predominant intracellular RAS activation. The HG stimulus did not change ACE mRNA expression but caused a considerable increase in ACE activity in the cell lysates and not in the culture medium. This result indicates a predominant effect of glucose on the intracellular forms of ACE. In addition, this result suggests that an HG-induced increase in intracellular AngII generation involves the ACE pathway. Moreover, we have previously demonstrated (28) that rat MC exposed to HG have increased intracellular renin activity paralleled by an increase in angiotensinogen gene transcription. Taken together, these data strongly suggest that HG stimulates the intracellular components of RAS and thus intracellular AngII synthesis, which remains predominantly inside the cell. It is important to reflect on the possibility that AngII may not leave the cells to induce its effects. It has been proposed that AngII may interact with intracellular receptors to trigger intracrine effects, as recently reviewed by Re (29). Previous data from our laboratory (28) showed AngII immunostaining in the nuclei of MC, which was strongly increased after exposure to HG levels. The increase in intracellular AngII levels induced by HG may represent an exciting mechanism involved in the well-known effects of AngII-inducing gene expression, particularly those involved in cell growth, metabolism, and synthesis of extracellular matrix components, manifestations that are typical of diabetic nephropathy.
Despite increased intracellular ACE activity in HG cells, captopril treatment failed to completely inhibit the HG-induced rise in cellular AngII content. This result corroborates the hypothesis that captopril is not able to inhibit intracellular ACE. In contrast, Singh and Leehey (24) showed that captopril added to MC lysate previously incubated in the HG environment inhibits AngII formation only partially; this finding suggests an involvement of both an ACE and a non-ACE pathway in AngII generation in MC exposed to HG conditions. In the present study, we found that HG induced a 3-fold increase in chymase mRNA. This result is in agreement with those of Huang et al. (10), who demonstrated upregulation of chymase expression in human diabetic kidneys. These results suggest a potential role of chymase in increased AngII generation under HG conditions; however, chymostatin was not able to reduce AngII under HG conditions. This failure could result from the upregulation of chymase mRNA induced by HG, which was further increased by chymostatin treatment. Taken together, these results suggest that both ACE and chymase may be involved in increased AngII generation during HG stimulation by different mechanisms, including an upregulation of chymase mRNA and a rise in ACE activity. Despite this evidence, we failed to reduce intracellular AngII with captopril or chymostatin; use of other strategies, such as silencing RNA molecules, may bring new insights into the role of chymase in this pathophysiologic condition.
We found that losartan did not prevent the HG-induced intracellular increase in AngII content, a result supporting our hypothesis that HG induces intracellular RAS activation in HMC in culture. In contrast, the overexpression of fibronectin during HG stimuli was completely reversed by losartan; this reversal suggests an intermediation of AngII. Considering that the losartan bound to AT1 receptor can be internalized, it is reasonable to think that losartan was able to block the intracellular actions of AngII, as previously demonstrated in rat hepatoma cells by Cook and collaborators (30). It is important to consider, however, that in the clinical setting, the association between ACE inhibitors and losartan produces significant renoprotection, a finding indicating that both intracellular and extracellular RAS contributions may be relevant in the whole kidney in vivo.
In summary, we have shown that chymase is expressed by HMC and that it might contribute, together with ACE, to intracellular AngII generation under NG and HG conditions. The discrete effect of captopril to block AngII generation in intact MC under NG or HG may explain why the renoprotection provided by ACE inhibitors is only partial, and many patients still have progressive renal disease with this monotherapy.
(A) ACE and chymase mRNA expression was evaluated under NG (5 mM ) or HG (30 mM ) concentrations. Cells were exposed to glucose for 24 hrs. The mRNA levels were measured by semiquantitative real-time RT-PCR. Results are from five experiments for each group. (B) Immunoblot of MC homogenates probed with antichymase or anti–β-actin antibodies. Bands were quantified by densitometry, and chymase expression was presented as a ratio to β-actin expression. The symbol * indicates P < 0.05 versus those during NG conditions. AngII levels were determined in cell lysates (A) and in the culture medium (B) under NG (5 mM ) and HG (30 mM ) concentrations. AngII production was evaluated in absence and presence of 1 mM captopril (Cp) and/or 50 μM chymostatin (CMT). Cells were exposed to glucose and/or drugs for 24 hrs. Results are expressed as means ± SEM for 10 samples from each group. The symbol * indicates P < 0.05 versus those during NG conditions. (A) ACE and chymase mRNA expression were evaluated under NG (5 mM) and HG (30 mM ) concentrations in the absence or presence of 1 mM captopril (Cp) or 50 μM chymostatin (CMT). Cells were exposed to glucose and/or drugs during 24 hrs. Results are from five experiments for each group. (B) Immunoblot of MC homogenates probed with antichymase or anti–β-actin antibodies. Bands were quantified by densitometry, and chymase expression was presented as a ratio to β-actin expression. The symbol * indicates P < 0.05 versus those during NG conditions. The symbol # indicates P < 0.05 versus those during HG conditions. Effects of glucose concentration on ACE activity determined in cell lysates and in culture medium of HMC. Cells were exposed to NG (5 mM) and HG (30 mM) concentrations for 24 hrs. ACE activity was measured by using 5 mM HHL as the substrate. Results are expressed as the mean ± SEM for four samples from each group. The symbol * indicates P < 0.05 versus those during NG conditions. Effects of captopril concentration and incubation time on ACE activity. (A) ACE activity was determined in the cell lysates and in the culture media. Intact cells were not treated (0) or treated for 1 hr with 100 μM, 250 μM, 500 μM, or 1000 μM of captopril. (B) The effect of incubation time included 0, 1, 4, and 24 hrs after incubation of intact cells with 1000 μM captopril. ACE activity was measured by using HHL as the substrate. Results represent the mean of four samples from each group. The symbol * indicates P < 0.05 versus those during no captopril treatment (A) or those at time zero (B). AngII levels were determined in cell lysates under NG (5 mM ) and HG(30 mM ) concentrations in the absence or presence of 100 nM losartan for 24 hrs. The symbol * indicates P < 0.05 versus those during NG conditions. The effect of HG on the fibronectin gene transcription was estimated by real-time PCR in the HG-stimulated cells in the absence and presence of 100 nM losartan for 24 hrs. The symbol * indicates P < 0.05 versus those during NG conditions.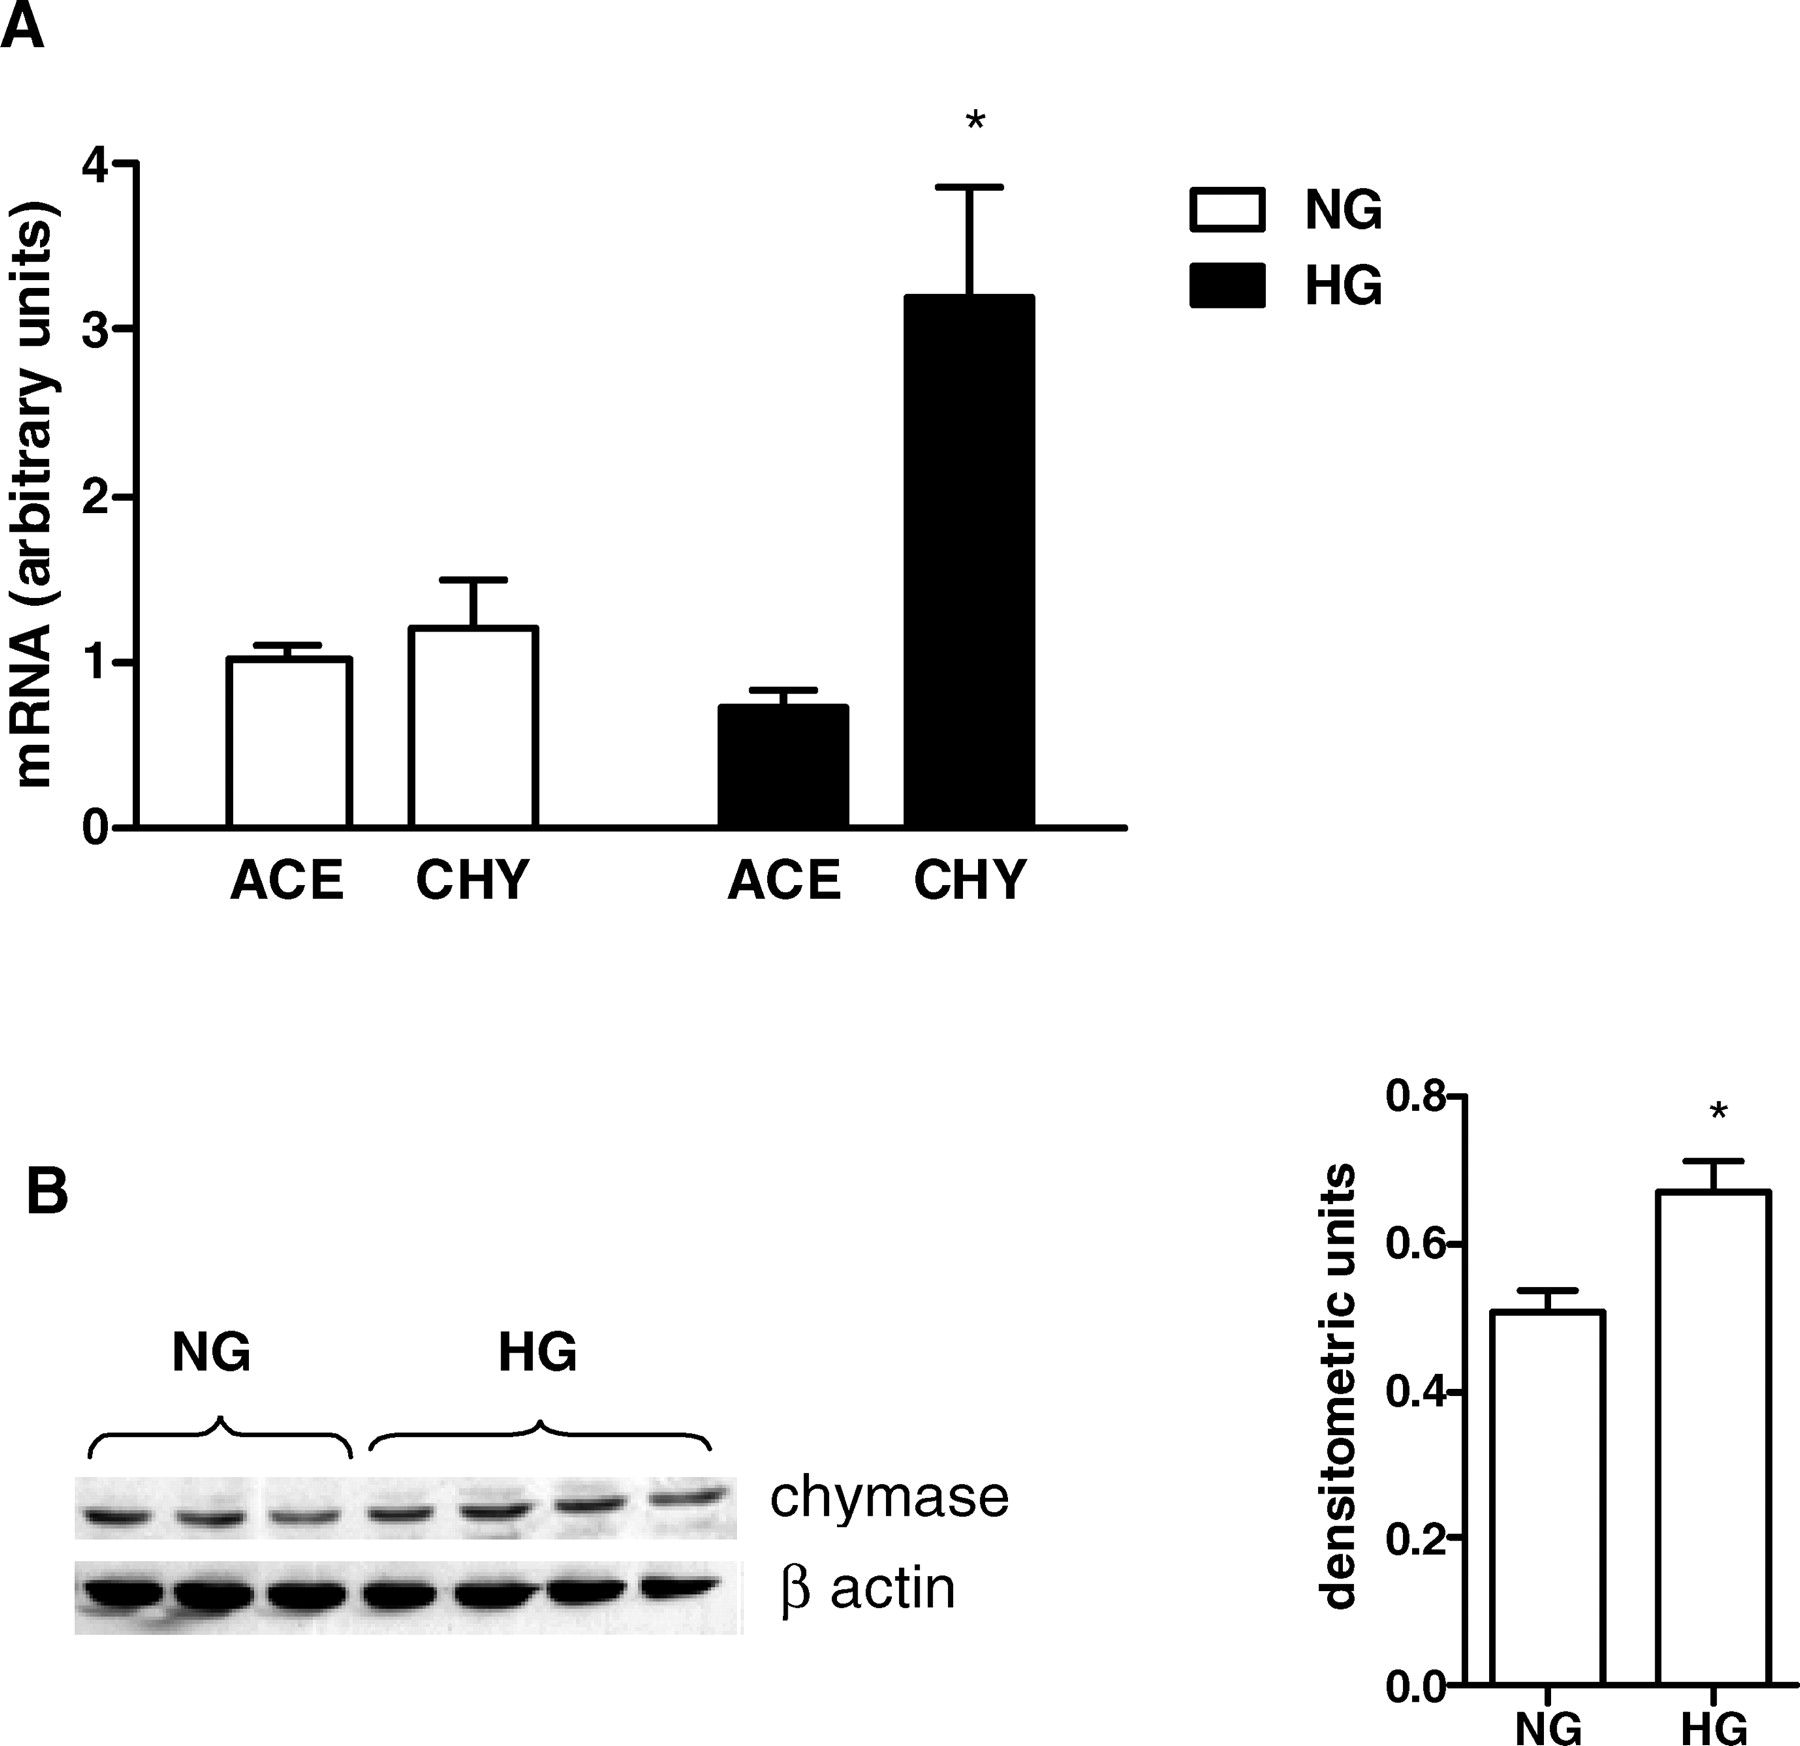


Footnotes
This work was supported by grants from Fundação de Amparo a Pesquisa do Estado de São Paulo (FAPESP), Conselho Nacional de Desenvolvimento Científico e Tecnológico (CNPq), Fundação Oswaldo Ramos (FOR), and Fundo de Auxílio aos Docentes e Alunos (FADA).