



Abstract
Insulin resistance (IR) and consequent hyperinsulinemia are hallmarks of Type 2 diabetes (DM2). Akt kinase (Akt) is an important molecule in insulin signaling, implicated in regulation of glucose uptake, cell growth, cell survival, protein synthesis, and endothelial nitric oxide (NO) production. Impaired Akt activation in insulin-sensitive tissues contributes to IR. However, Akt activity in other tissues, particularly those affected by complications of DM2, has been less studied. We hypothesized that hyperinsulinemia could have an impact on activity of Akt and its effectors involved in regulation of renal morphology and function in DM2. To address this issue, renal cortical Akt was determined in obese Zucker rats (ZO), a model of DM2, and lean controls (ZL). We also studied expression and phosphorylation of the mammalian target of rapamycin (mTOR) and endothelial NO synthase (eNOS), molecules downstream of Akt in the insulin signaling cascade, and documented modulators of renal injury. Akt activity was measured by a kinase assay with GSK-3 as a substrate. Expression of phosphorylated (active) and total proteins was measured by immunoblotting and immunohistochemistry. Renal Akt activity was increased in ZO as compared to ZL rats, in parallel with progressive hyperinsulinemia. No differences in Akt were observed in the skeletal muscle. Corresponding to increases in Akt activity, ZO rats demonstrated enhanced phosphorylation of renal mTOR. Acute PI3K inhibition with wortmannin (100 μg/kg) attenuated renal Akt and mTOR activities in ZO, but not in ZL rats. In contrast to mTOR, eNOS phosphorylation was similar in ZO and ZL rats, despite higher total eNOS expression. In conclusion, ZO rats demonstrated increases in renal Akt and mTOR activity and expression. However, eNOS phosphorylation did not follow this pattern. These data suggest that DM2 is associated with selective IR in the kidney, allowing pro-growth signaling via mTOR, whereas potentially protective effects mediated by eNOS are blunted.
Introduction
Resistance to metabolic actions of insulin (insulin resistance, IR), typically occurring in insulin-sensitive tissues such as the skeletal muscle, liver and adipose tissue, is a hallmark of Type 2 diabetes (DM2), and is often associated with obesity (1).
Insulin signaling involves activation of its receptor tyrosine kinase and subsequent phosphorylations of several substrates, including members of the insulin receptor substrate family and phosphatidylinositol 3-kinase (PI3K) (2). The serine/threonine kinase Akt/protein kinase B (Akt) is one of the downstream targets of PI3K (2, 3), and an important molecule in insulin signaling. Akt activation is a process involving membrane translocation and phosphorylation by phosphoinositide-dependent protein kinases (3). Activity of the PI3K-Akt pathway can be negatively regulated by protein phosphatases, such as phosphatase with tensin homology (PTEN) (4). Phosphorylated (active) Akt, acting via its downstream effectors, has been implicated not only in regulation of mechanisms important for glucose homeostasis, such as glucose uptake and glycogen synthesis, but also in the control of other cell functions, including growth, survival, protein synthesis, and endothelial nitric oxide (NO) production (5). Thus, in addition to being a hormone with well-established metabolic actions, insulin acts as a growth, survival, and vasoactive factor.
Impaired insulin signaling via the PI3K-Akt pathway in insulin-sensitive tissues has been implicated in the pathophysiology of IR (6, 7). It has been postulated that the resulting hyperinsulinemia may have impact on other cells and tissues, and play a role in the pathophysiology of micro-and macrovascular complications of diabetes (8).
The kidney is also a target of insulin actions, and nephropathy is one the most serious complications of DM2, reaching epidemic proportions in some parts of the world (9). Moreover, obesity, even without marked hyperglycemia, is associated with a variety of renal pathologies both in clinical and experimental settings (10, 11). Studies indicate that insulin and/or Akt stimulation influence renal cell protein synthesis, viability, renal hemodynamics, NO production, and sodium reabsorption, i.e. mechanisms with relevance to renal pathophysiology (12–17). If renal Akt activation remains unaffected in IR, permanent exposure to hyperinsulinemia due to IR could have impact on its downstream effectors and renal morphology and function.
The mammalian target of rapamycin (mTOR) is an important molecule in regulation of protein synthesis. Regulation of mTOR signaling is linked to PI3K-Akt by the tuberous sclerosis complex (18). Upon insulin and growth factor stimulation, mTOR facilitates protein translation through inhibitory phosphorylation of eIF-4E binding protein (4E-BP1), a translation repressor. These events result in activation of the translation of specific mRNA subpopulations. Enhanced protein synthesis may contribute to the development of renal hypertrophy via enhanced extracellular matrix accumulation, one of the key elements in the pathophysiology of glomerulosclerosis and renal interstitial fibrosis (18).
In contrast to mTOR, endothelial nitric oxide (NO) synthase (eNOS) exerts protective actions in the kidney by generation of endothelium-derived NO, a molecule with well-established vasodilator, antithrombotic and antigrowth effects in the cardiovascular system and the kidney (19–21). Upon agonist stimulation, Akt mediates phosphorylation of eNOS on Ser1177, resulting in enhancement of its NO-generating capability (22, 23). Indeed, insulin acts as an endothelium-dependent vasodilator in most vascular beds (24). Impaired endothelial function has been suggested as one of the pathogenic mechanisms of renal involvement in experimental models of DM2 and obesity (21, 25). In turn, restoration of endothelial NO generation has been shown to be protective in these conditions (25).
In the present studies, we determined renal cortical Akt activity and expression in the hyperinsulinemic environment typically associated with IR. In parallel, we studied expression and phosphorylation status of mTOR and eNOS, the molecules downstream of Akt in the insulin signaling cascade, and known modulators of renal injury (21, 25–27). We hypothesized that in DM2, the kidney is affected by selective IR allowing enhanced pro-growth signaling, whereas potentially protective effects mediated by Akt-induced eNOS phosphorylation are blunted. To address this issue, these components of insulin signaling were determined in the renal cortex of obese Zucker fatty rats (fa/fa, ZO) (28), a model of DM2. Zucker lean rats (ZL) that do not display metabolic defects served as controls.
Methods
Diabetic Rat Model
Male ZO and control ZL rats were obtained from Charles River, Sulzfeld, Germany. ZO rats are metabolically well characterized: an autosomal recessive mutation of the fagene, encoding the leptin receptor, results in hyperphagia, obesity, and hyperlipidemia (29). ZO rats display insulin resistance, marked hyperinsulinemia, and impaired glucose tolerance, and slowly progressive increases in blood glucose (BG) concentrations (30). Later in the course of the disease, ZO rats develop progressive albuminuria and glomerulosclerosis (31).
All experiments were carried out with the approval of, and in accordance with the regulations of, the Institutional Animal Care and Use Committee of the Institute for Clinical and Experimental Medicine. The animals were housed with a light-dark cycle of 12 hours each, and with free access to food (standard chow) and water.
Study Design
In the first series of experiments, renal cortical activity, expression, and immunohistochemical localization of Akt and protein expression of PTEN in 4-week and 12-week old ZO (n = 6) and ZL (n = 5) rats were determined in parallel with Akt activity in the skeletal muscle. Protein expression of phosphorylated and total mTOR and eNOS were studied in 12-week old animals. To further explore the status of the PI3K-Akt pathway and its impact on downstream molecules, Akt and mTOR were studied in separate groups of 12-week old ZO and ZL rats (n = 5 in each group) administered intraperitoneal injections of the PI3K inhibitor wortmannin (100 μg/kg bwt in 15% DMSO, 90 minutes before sacrifice) and compared to vehicle (DMSO)-treated animals. In previous in vivo studies conducted by Gao and co-workers (32), a substantially lower dose of wortmannin (15 μg/kg bwt) injected i.v. blocked insulin-induced increases in Akt activity, and inhibited the beneficial effects of insulin on apoptosis in a rat model of myocardial infarction.
After sacrifice, the blood was collected for determinations of BG, serum triglycerides (TG), non-esterified fatty acids (NEFA), and plasma insulin levels. The soleus muscles were removed and snap frozen in liquid nitrogen. The kidneys were quickly removed on ice, decapsulated and divided into cortical and medullary portions, frozen in liquid nitrogen, and stored in −80°C until further analysis by kinase assay and immunoblotting. Half of the right kidneys was immersed in 10% formalin and further processed for immunohistochemistry. The blood and tissues were harvested without previous food restriction.
Tissue Preparation
Renal cortical tissue and soleus muscles were homogenized in ice-cold buffer containing 2 mM EDTA, 50 mM Tris/HCl pH 7.5, 150 mM NaCl, 1 mM PMSF, 10 μg/ml leupeptin, 10 μg/ml aprotinin, 20 mM glycerol phosphate, 1 mM sodium orthovanadate and 2 mM sodium pyrophosphate using a motor-driven homogenizer and centrifuged at 850 g for 10 minutes at 4°C. The nuclei-free supernatant was further centrifuged at 100,000 g for 60 minutes at 4°C to obtain crude membrane and cytosolic fractions. The analyses were performed in cytosolic fractions. Total protein concentration in each sample was determined by BCA analysis (Pierce Biotechnology, Inc., Rockford, IL).
Akt Kinase Assay
The homogenates (300 μg) were analyzed using an Akt kinase activity assay kit (Cell Signaling, MA) according to the manufacturer’s instructions. In brief, renal cortical and muscular homogenates harvested from ZL and ZO rats (300 μg) were immunoprecipitated with immobilized phospho-Serine 473–Akt antibody and incubated with the Akt substrate glycogen synthase kinase-3 (GSK-3) in the presence of ATP. Protein expression of phosphorylated GSK-3, as a measure of Akt activity, was then determined by Western blotting using the anti-phospho-GSK-3 antibody.
Immunoblot Analysis
The total protein content of each sample was equalized by dilution in SDS-PAGE sample buffer and incubated for 5 minutes at 97°C. Denatured proteins were then separated through an SDS-polyacrylamide gel and transferred to PVDF membranes (Bio-Rad). Membranes were washed and then blocked overnight with TBS-T containing 5% nonfat dry milk. Following blocking, membranes were again washed, and incubated overnight with rabbit polyclonal antibodies (Cell Signaling, Beverly, MA) raised against phospho-Serine 473–Akt (P-Akt, cat. # 9271, 1:500), phospho-Serine 2448-mTOR (P-mTOR, cat. # 2971, 1:500), or phospho-Serine 1177-eNOS (P-eNOS, cat. # 9571, 1:600). Immunodetection was accomplished by incubating membranes with a goat anti-rabbit secondary antibody conjugated with horseradish peroxidase (HRP) for 45 minutes (1:50,000, Pierce Biotechnology, Inc., Rockford, IL) in TBS-T containing 5% nonfat dry milk. Visualization was performed with an enhanced chemiluminiscence (ECL) western-blotting kit (Supersignal West Dura, Pierce Biotechnology, Inc., Rockford, IL) according to the manufacturer’s instructions. Following the detections of phospho-proteins, the membranes were stripped in a stripping buffer (Chemicon, Temecula, CA) for 30 minutes at room temperature, blocked for 60 minutes, and reincubated with rabbit polyclonal antibodies against total Akt, total mTOR (Cell Signaling, cat. # 9272 and 2972, respectively), or eNOS (BD Transduction Laboratories, San Diego, CA, USA) and further processed as described above. To determine equality of loading, membranes were restripped and reprobed for actin (Santa Cruz, Santa Cruz, CA) as previously described (33). Measurements of PTEN expression were accomplished using the same procedure as described above using a rabbit polyclonal antibody (Cell Signaling, cat. # 9552, 1:500) followed directly by actin detection. Resultant films (Kodak) were scanned using a flatbed scanner and images analyzed with NIH Image software with the gel plotting macro.
Immunohistochemistry
The fixed kidneys were dehydrated through a graded series of ethanols, embedded in paraffin, sectioned at 4 μm thickness, and placed onto glass slides. Sections were deparaffinized in xylene and rehydrated through graded ethanols to water, and pretreated by steaming in 10% CITRA buffer (BioGenex, San Ramon, CA). After blocking, the slides were incubated overnight at 4°C with primary antibody (anti-phospho-Ser473–Akt, Cell Signaling, 1:100) or with the same concentration of non-immune mouse IgG as a control. Endogenous peroxidase activity was blocked with 3% H2O2 solution in methanol. The primary antibody was localized using the Vectastain ABC-Elite peroxidase detection system (Vector Laboratories, Burlingame, CA). This was followed by reaction with diaminobenzidine as chromogen and counterstaining with hematoxylin (Sigma, St. Louis, MO). Sections of each diabetic kidney were processed in parallel with appropriate control tissue.
Analytical Methods
Blood glucose levels were measured by the glucose oxidase assay (Pliva-Lachema, Czech Republic). Serum insulin concentrations were measured using a rat insulin RIA kit (Amersham Biosciences, Piscataway, NJ). Serum TG concentrations were determined by standard enzymatic methods (Pliva-Lachema), and serum NEFA were measured using an acyl-CoA oxidase-based colorimetric kit (Roche Diagnostics, Basel, Switzerland).
Statistical Analysis
Data are expressed as mean ± SEM. All analyses were performed by analysis of variance (ANOVA) followed by the Scheffé test. A P value of less than 0.05 was viewed as statistically significant.
Results
General physical and metabolic parameters in ZL and ZO rats are summarized in Table 1. An increase in body weight was already apparent by 4 weeks in ZO, with an even more striking difference in 12-week old animals, as compared to their age-matched lean counterparts. Both 4-week old and 12-week old ZO rats demonstrated increases in renal weight. However, the kidney/body weight ratio was not different at 4 weeks, and even decreased in 12-week old ZO rats as compared to ZL rats of the same age. ZO rats demonstrated progressive increases in plasma insulin concentrations and increases in TG and NEFA levels. Although still within the normal or near-normal range, BG values were slightly increased in both age groups of ZO as compared to ZL.
Analysis of Akt kinase activity by in vitro kinase assay in the skeletal muscle did not reveal any differences between ZL and ZO rats in either age group (Fig. 1). This phenomenon was observed despite increasing plasma insulin levels in ZO rats. Akt activity and expression in renal cortex is shown in Figure 2. In 4-week old ZO, Akt activity (Fig. 2, Panel A) was still similar to that in ZL. In contrast to younger animals, and unlike the findings in the skeletal muscle, 12-week old ZO rats demonstrated marked increases in renal cortical Akt activity as compared to ZL (Fig. 2, Panel A). This finding corresponded to increased expression of P-Akt in 12-week old ZO rats (Fig. 2, Panel B). The abundance of total Akt protein was also increased in 12-week old ZO rats compared with age-matched ZL (Fig. 2, Panel B). Immunohistochemical studies localized phosphorylated Akt in glomeruli, in particular in podocytes, and in mesangial cells (Fig. 3). P-Akt immunoreactivity was also apparent in the distal tubules (Fig. 3). The distribution of P-Akt in the cortex was similar in ZL and ZO rats. There were no differences in PTEN expression between ZL and ZO rats at either 4 or 12 weeks (Fig. 4).
Expression of mTOR and eNOS proteins were determined in 12-week old animals, which had demonstrated differences in Akt activity. Both P-mTOR and total mTOR protein abundances were enhanced in ZO rats as compared to ZL (Fig. 5). In contrast to mTOR, eNOS phosphorylation was similar in ZO and ZL rats, despite higher total eNOS protein expression (Fig. 6).
To further explore whether renal Akt-mTOR activation is PI3K-dependent, 12-week old ZO and ZL rats were treated acutely with wortmannin, an inhibitor of PI-3K. The results were compared to animals treated with DMSO as vehicle. Physical parameters and BG levels in these groups of ZL and ZO rats were similar to those studied in the first series of experiments (data not shown). To exclude the possibility that DMSO per se could influence Akt activity, renal cortical activity was compared between DMSO-treated ZL and ZO rats. As shown in Figure 7, Panel A, DMSO-treated animals demonstrated similar differences in renal cortical Akt activity as observed in ZO and ZL rats without DMSO treatment. Wortmannin administration resulted in reductions in Akt kinase activity (Fig. 7, Panel B), and mTOR phosphorylation in ZO (Fig. 7, Panel C), but not in ZL rats.
Discussion
In the present studies, ZO rats demonstrated progressive hyperinsulinemia and other metabolic abnormalities characteristic of IR states, including marked elevations in plasma TG and NEFA levels, and only a slight increase in BG concentrations. In this metabolic environment, renal cortical Akt kinase activity and expression of phosphorylated Akt were increased in 12-week old ZO rats as compared to lean controls. In contrast to renal cortex, no differences in Akt activity between ZO and ZL rats were observed in the skeletal muscle. ZO rats also displayed increased renal expression of total Akt protein expression. This observation suggests that exposure to chronic hyperinsulinemia leads not only to changes in posttranslational modifications of Akt, but also to changes in the transcriptional level of Akt regulation. The differences in renal Akt activity in 12-week old ZO rats were not attributable to PTEN, since the expression of this protein was similar in ZO and ZL rats.
Studies have suggested that Akt-mediated and growth factor-induced signaling are involved in cellular hypertrophy and enhanced extracellular matrix (ECM) production in renal cells, i.e. factors operating in the development of glomerulosclerosis and interstitial fibrosis (12, 13, 34–37). These effects could be mediated via mTOR, a kinase involved in the control of protein translation (12, 38). Activation of mTOR has recently emerged as an important mechanism in renal and cardiovascular pathophysiology (26, 39, 40).
We observed enhanced mTOR phosphorylation in 12-week old ZO rats as compared to their lean counterparts. To further explore the link between hyperinsulinemia and the renal PIK3-Akt-mTOR pathway in DM2, ZO and ZL rats were administered the PI3K inhibitor wortmannin. This intervention was associated with reductions of Akt kinase activity in ZO rats. Furthermore, wortmannin induced a reduction in mTOR phosphorylation. These findings, together with the lack of effect of wortmannin in ZL rats, suggest that enhanced renal Akt activity in ZO is, at least in part, insulin-dependent, and that the pathway is involved in renal mTOR phosphorylation.
There is rapidly increasing evidence suggesting the roles of the Akt and Akt-mTOR pathways in the development of nephropathy in both types of diabetes. In vitro, Akt activation has been described in mesangial cells (36, 41), podocytes (27) and proximal tubular cells (35, 42) cultured in high glucose conditions. In vivo, enhanced renal Akt or Akt-mTOR activity has been reported in rodent models of Type 1 diabetes (DM1), both at early and late stages of nephropathy (26, 36, 37, 43). Treatment with rapamycin, an mTOR inhibitor, ameliorated early and advanced molecular and structural markers of diabetic nephropathy (26, 36, 43).
Although less abundant, evidence implicating Akt-mTOR signaling in the pathophysiology of Type 2 diabetic nephropathy has been also emerging. Feliers et al. (34) demonstrated increases in unstimulated Akt activity in the kidney of obese db/db mice, a murine model of DM2. These changes coincided with the onset of hypertrophy and matrix accumulation. More recent work by this group has linked these findings in db/db mice to activation of renal mTOR and mRNA translation machinery, and demonstrated beneficial effects of mTOR inhibition in the Type 2 diabetic kidney (44). Our present observations are in agreement with these reports in experimental DM2. However, since db/db mice display severe hyperglycemia, and, as shown in models of DM1, hyperglycemia per se stimulates Akt activity in renal cells (35), our study extends previous findings by providing the evidence for Akt-mTOR activation in a model of DM2 with predominant hyperinsulinemia, and only slight hyperglycemia.
Thus, it appears that renal Akt-mTOR could be activated both by high glucose and/or high insulin, suggesting roles for this pathway both in Type 1 and Type 2 diabetic nephropathy. Indeed, studies have indicated similar potential of high glucose and insulin to activate Akt and mTOR in renal tubular cells (35, 44). In this context, Akt-mTOR activation may explain similarities in renal pathology in patients with DM1 and at least some DM2 patients, despite the differences in the metabolic milieu.
In addition, other factors, typically associated with diabetic renal pathology, could be involved. Transforming growth factor-beta (TGF-beta) is one of the best-studied prosclerotic cytokines, responsible for cellular hypertrophy and enhanced ECM production in the diabetic kidney (45). ZO rats display increases in renal TGF-beta mRNA expression by 12 weeks of age (46). As recently reported, TGF-beta stimulates Akt in mesangial cells (37), suggesting another pathway for renal Akt-mTOR activation in diabetes.
Interestingly, previous studies focusing on the extarenal vascular system in experimental DM2 (8, 47) have reported defects in Akt activation similar to insulin-sensitive tissues, such skeletal muscle, adipose tissue, or liver. In this context, our present data, in accord with previous studies in db/db mice (34, 44), suggest that the kidney may be an organ with a uniquely preserved ability of Akt to respond to increased plasma insulin concentrations associated with IR.
P-Akt immunoreactivity was detectable in glomeruli, in particular in podocytes, and to a lesser degree in mesangial cells, and in distal tubules. To our knowledge, immunohistochemical localization of P-Akt in the kidney in experimental DM2 has not been reported. However, P-Akt distribution in ZL and ZO rats corresponds to previous findings in STZ-diabetic rats. Thirone and co-workers (48) detected P-Akt in most cells of the kidney, with apparent highest staining in collecting tubules and some cells of the glomerular mesangium. In a more recent study, Nagai et al. (36) demonstrated nearly identical glomerular localization of P-Akt as in our present study. The glomerular localization of P-Akt is also in line with in vitro evidence in glomerular epithelial (27) and mesangial cells (36, 41). As discussed above, insulin- or high glucose-induced activation of Akt has also been studied in cultured proximal tubular cells (35, 42). We did not observe P-Akt immunoreactivity in this cell type in either ZL or ZO rats. This finding does not preclude a pathophysiological role for Akt in the proximal tubule, but in the present model P-Akt was below the detection limit of our method.
It is intriguing to speculate regarding the physiological or pathophysiological role of Akt in the distal tubule. A recent study indicating that Akt acts as an important regulator of epithelial sodium channel (ENaC) activity (49) provides a possible clue. Inhibition of the endogenous expression of Akt in thyroid cells expressing the channel inhibited its activity and disrupted the stimulatory effect on ENaC of insulin. Conversely, overexpression of Akt increased expression of ENaC at the cell membrane and overcame the inhibitory effect of ENaC ubiquitination. ENaC is typically expressed in the distal nephron, and has been shown to be involved in the regulation of blood pressure (50). Consequently, induction of Akt in the hyperinsulinemic environment could contribute to increased sodium reabsorption and development of hypertension in IR and DM2.
While activation of the PI3K-Akt-mTOR pathway has been associated with deleterious consequences in the kidney (18, 26, 35, 44), Akt also mediates protective signals, such as the eNOS Ser1177 phosphorylation in response to a variety of physiological stimuli (22, 23). This post-translational modification is a critical step for NO production by the enzyme (22, 23). To our knowledge, renal eNOS phosphorylation has not been studied in models of IR and obesity. In ZO, P-eNOS expression was similar to that in ZL despite higher plasma insulin levels and total eNOS. This phenomenon suggests a defect in insulin-induced renal activation of the enzyme in this model, in accord with previously documented endothelial dysfunction in ZO rats (25).
In summary, we report increases in renal Akt activity and mTOR phosphorylation in ZO rats, corresponding to elevated plasma insulin concentrations. In contrast, eNOS phosphorylation was similar in ZO rats as in lean controls. These data suggest that renal pro-growth insulin signaling mediated via the Akt-mTOR pathway is preserved in experimental DM2, while the potentially protective branch of insulin signaling, mediated by eNOS, is blunted. This combination of signaling responses to hyperinsulinemia may contribute to the later development of renal glomerular and interstitial lesions observed in clinical and experimental DM2 and obesity.
Physical and Metabolic Characteristics in ZL and ZO Rats a

Akt kinase activity in the skeletal muscle of Zucker lean (ZL) and Zucker obese (ZO) rats. The homogenates of the soleus muscle from 4-week and 12-week old ZL and ZO rats were immunoprecipitated (IP) with an antibody raised against phospho-Ser473-Akt (P-Akt) and incubated with the Akt substrate glycogen synthase kinase-3 (GSK-3) in the presence of ATP. Protein expression of phosphorylated GSK-3 (P-GSK-3), as a measure of Akt activity, was then determined by Western blotting (IB). The results of densitometric analysis (mean ± SE) are presented as fold control (ZL). Representative blots are shown in insets.
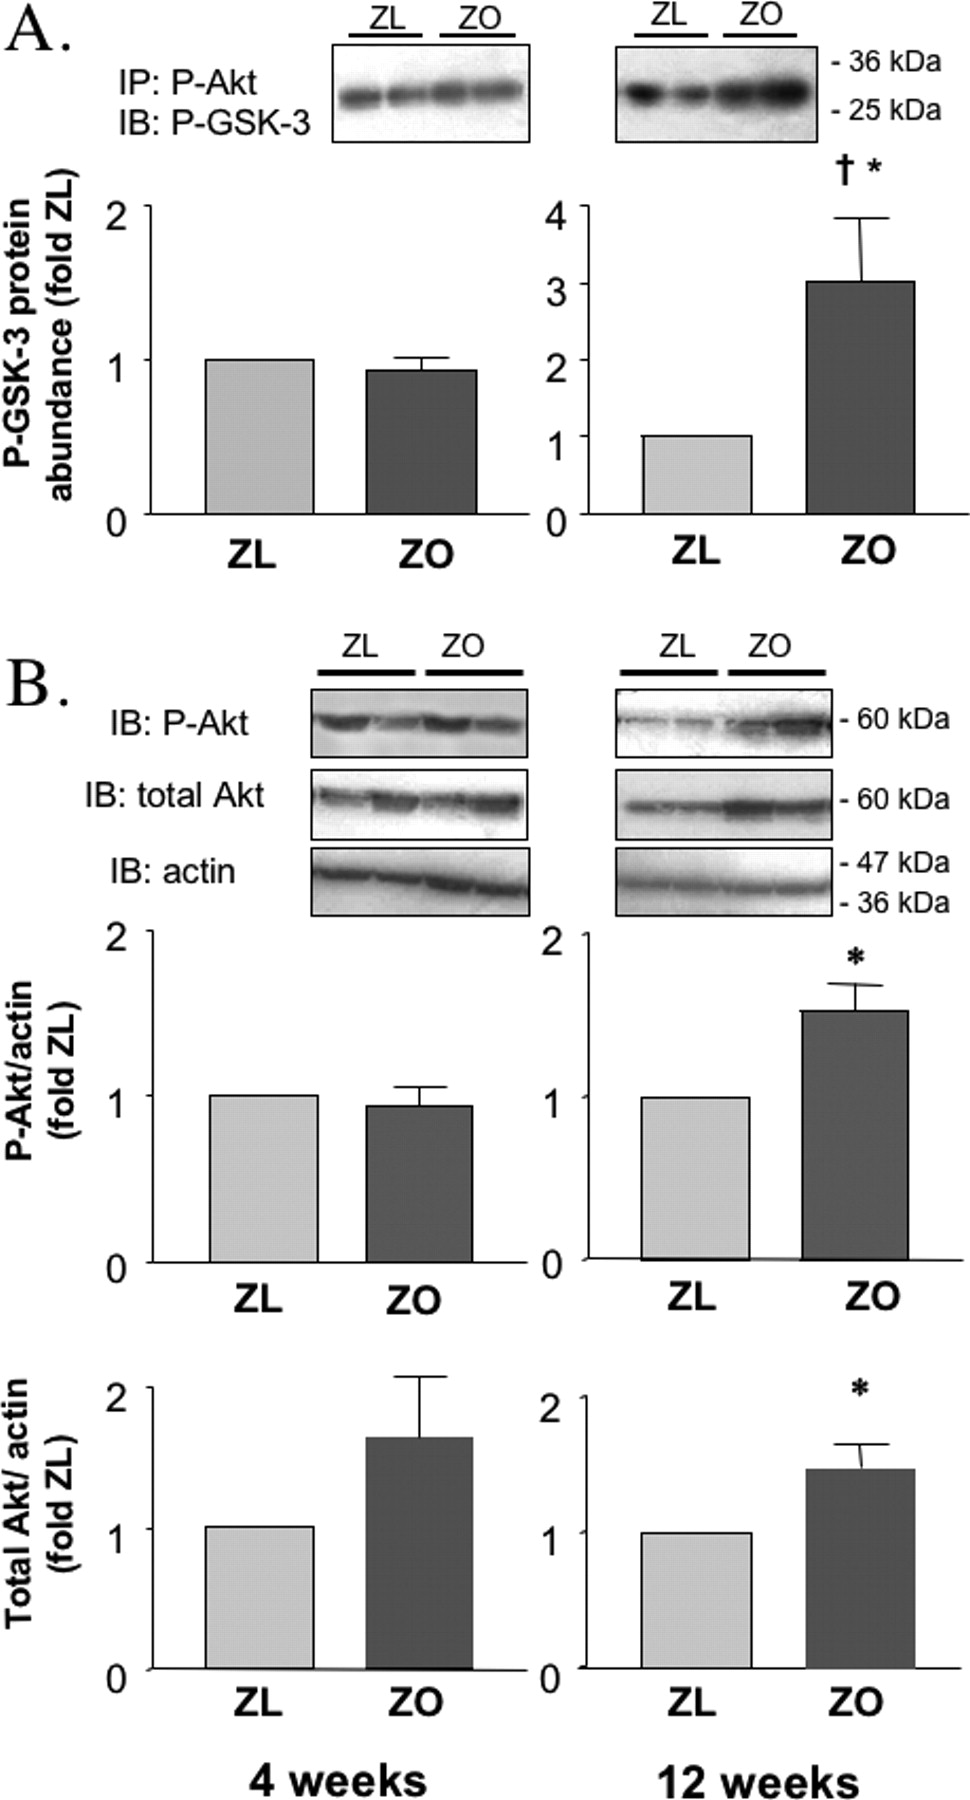
Renal cortical activity of Akt kinase, and protein expression of phospho-Ser473-Akt and total Akt in 4-week and 12-week old Zucker lean (ZL) and Zucker obese (ZO) rats. (A) Renal cortical homogenates from ZL and ZO rats were immunoprecipitated (IP) with an antibody raised against phospho-Ser473-Akt (P-Akt) and incubated with the Akt substrate glycogen synthase kinase-3 (GSK-3) in the presence of ATP. Protein expression of phosphorylated GSK-3 (P-GSK-3), as a measure of Akt activity, was then measured by Western blot analysis (IB). (B) Western blot analysis was used to determine expression of P-Akt and total Akt, consisting of both phosphorylated (active) and non-phosphorylated kinase. Actin expression is provided as a verification of equal lane-to-lane loading. Representative blots are shown in insets. The results of densitometric analysis (mean ± SE) are presented as fold control (ZL). *P < 0.05,†P < 0.01 vs. ZL of the same age.

Renal cortical immunohistochemical localization of phospho-Ser473-Akt (P-Akt) in 12-week old Zucker lean (Panels A, C) and Zucker obese (Panels B, D) rats. Formalin-fixed, paraffin-embedded kidneys were sectioned at 4 μm and incubated with a primary antibody raised against P-Akt or with the same concentration of non-immune mouse IgG as a control (not shown). The primary antibody was localized using the peroxidase detection system and counterstaining with hematoxylin. (A and B) P-Akt immunoreactivity was found in glomeruli (arrows), and in distal tubules (arrowheads). Magnification ×100. (C and D) Detailed glomerular images showing immunostaining for P-Akt in podocytes (arrows) and mesangial cells (arrowheads). Magnification ×400.

Renal cortical expression of PTEN in 4-week and 12-week Zucker lean (ZL) and Zucker obese (ZO) rats. Western blot analysis (IB) was used to determine expression of PTEN, as described in Methods. Actin expression was determined as a verification of equal lane-to-lane loading. Representative blots are shown in insets. The results of densitometric analysis are presented as fold control (ZL).

Renal cortical protein expression of phospho-Ser2448-mTOR and total mTOR in 12-week old Zucker lean (ZL) and Zucker obese (ZO) rats. Western blot analysis (IB) was used to determine expression of phospho-Ser2448-mTOR (P-mTOR) and total mTOR, consisting of both phosphorylated (active) and non-phosphorylated kinase, as described in Methods. Actin expression was determined as a verification of equal lane-to-lane loading. Representative blots are shown in insets. The results of densitometric analysis are presented as fold control (ZL). *P < 0.05, †P < 0.01 vs. ZL of the same age.

Renal cortical protein expression of phospho-Ser1177-eNOS and total eNOS in 12-week old Zucker lean (ZL) and Zucker obese (ZO) rats. eNOS phosphorylation and total eNOS protein expression were measured by Western blotting (IB), using primary antibodies against active eNOS, phosphorylated on Ser1177 (P-eNOS), and total enzyme consisting of both phosphorylated and non-phosphorylated protein. Actin expression was determined as a verification of equal lane-to-lane loading. Representative blots are shown in insets. The results of densitometric analysis are presented as fold control (ZL). *P < 0.05 vs. ZL.

Effect of wortmannin on renal cortical Akt activity and mTOR expression in Zucker lean (ZL) and Zucker obese (ZO) rats. Twelve-week old ZL and ZO rats were acutely treated with wortmannin (WORT; 100 μg/kg, i.p.), an inhibitor of phosphatidylinositol 3-kinase, or with DMSO as a vehicle (VEH). (A) Renal cortical Akt activity was compared between VEH-treated ZL and ZO rats, to exclude the possibility that DMSO could per se influence Akt activity. (B) Effects of WORT on Akt kinase activity in ZL (left panel) and ZO rats (right panel) as compared to control VEH-treated counterparts. Akt kinase activity was determined by in vitro kinase assay. Tissue homogenates were immunoprecipitated (IP) with an antibody recognizing phospho-Ser473-Akt (P-Akt) and incubated with the Akt substrate glycogen synthase kinase-3 (GSK-3) in the presence of ATP. Expression of phosphorylated GSK-3 (P-GSK-3), as a measure of Akt activity, was then determined by Western blot analysis (IB). (C) mTOR phosphorylation and expression in VEH- and WORT-treated ZL (left panels) and ZO rats (right panels). Phospho-Ser2448-mTOR (P-mTOR) and total mTOR, consisting of both phosphorylated (active) and non-phosphorylated kinase, were determined by IB. Actin expression was also measured as a verification of equal lane-to-lane loading. Representative blots are shown in insets. The results of densitometric analysis (mean ± SE) are presented as fold control (VEH). † P < 0.01 vs. VEH-treated animals of the same age.
Footnotes
These studies were supported by the institutional Grant # MZO 00023001 of the Czech Ministry of Health Care (RK), and by DK 63231 from the NIH (SA).
Acknowledgements
We are grateful to J. Vesela, H. Seidlova, and I. Musilova for their excellent technical assistance.