
Abstract
Peripheral blood microchimerism after pregnancy or solid organ transplantation has been widely studied, but a consensus on its detection has not yet been adopted. The objective of this study was to establish a panel of reproducible molecular polymerase chain reaction (PCR)–based methods for detection and quantification of foreign cells in an individual. We analyzed length polymorphisms generated by short tandem repeat (STR) and variable number tandem repeat (VNTR) markers. Human leukocyte antigen (HLA)-A and -B polymorphisms were detected by reference strand conformation analysis (RSCA). Class II polymorphisms on HLA-DRB1 locus were analyzed both by classical PCR–sequence-specific primers (SSP) and by quantitative PCR (Q-PCR). Also, sex-determining region-y gene (SRY) gene allowed specific male donor discrimination and quantification by Q-PCR in female recipients. Binomial statistical distribution analysis was used for each molecular technique to determine the number of PCR replicates of each sample. This analysis allowed the detection of the lowest detectable microchimerism level, when present. We could detect microchimerism in more than 96% and more than 86% of cases at levels as low as 1:105 and 1:106 donor per recipient cells (DPRC), respectively, using Q-PCR for SRY or for nonshared HLA-DRB1 alleles. These techniques allowed as low as 1 genome-equivalent cell detection. Lower levels (nanochimerism) could be detected but not quantified because of technique limitations. However, classical PCR methods allowed detection down to 1:104 DPRC for HLA-DRB1 PCR-SSP. The clinical application of these techniques in solid organ transplanted recipients showed microchimerism levels ranging from 1:104 to 1:106 DPRC after kidney or heart transplantation, and 1 log higher (1:103 to 1:106 DPRC) after liver transplantation. In conclusion, the standardization of molecular microchimerism detection techniques will allow for comparable interpretation of results in microchimerism detection for diagnostic or research studies.
Introduction
Hematopoietic chimerism can be defined as the presence of at least two different DNA sources in a same individual. It can be identified following natural or artificial cell transfer during of after pregnancy in the mother but also in the fetus, after blood transfusion, after stem cell transplantation, or even after solid organ transplantation.
Molecular chimerism monitoring after stem cell transplantation is a useful tool. It is routinely performed in laboratories to detect disease relapse after hematopoietic stem cell transplantation. In these cases, it can also be referred to as macrochimerism quantification because donor cell amounts range from 1% to 100% of the total peripheral blood cells of the recipient. From this viewpoint, microchimerism can be defined as less than 1% of foreign cells present in an individual. Presence of microchimerism can be a result of cell transfer from the fetus or the mother before and during delivery, after solid organ transplants, or even after blood transfusions.
Microchimerism detection is used for precocious detection of SRY DNA in the peripheral blood of the mother during pregnancy, which allows for the sex of the fetus to be determined (1–3) and, moreover, demonstrates that microchimerism detection can be used as a noninvasive tool for prenatal diagnosis (4, 5).
It has been hypothesised that fetal or mother-engrafted stem cells could be involved either in autoimmunity or in tolerance to fetal or maternal derived tissues, respectively (6–12) or even in organ repair (13). Solid organ transplants may also benefit from microchimerism detection, as demonstrated by some authors who have shown that the presence of donor circulating cells after transplantation is directly correlated to a significantly lower incidence of acute rejection (14–17) or even leads to tolerance (18). Many studies based on microchimerism detection after solid organ transplantation have been published. However, they have led to contradictory results because many different detection techniques and different control time points have been used to detect donor cells (19–21). So far, consensus has not been established, but various strategies have been suggested by numerous authors (22–34). Therefore, to have a potential clinical impact based on precocious diagnostics, it is fundamental to arrive at a concordance about molecular microchimerism detection techniques to assure comparability of results.
Compliance of at least four essential factors must be applied for the detection of this minority of donor circulating cells within the blood of the recipient. The first factor is to previously determine and characterize DNA molecular disparities between the donor and the recipient to recognize donor discrimination. The second factor is the specific detection of this donor polymorphism without false positives. The third factor is to validate the sensitivity of the improved technique, allowing the specific detection of as small amounts of donor cells as possible. And the last essential factor is to validate the reproducibility of the technique.
Here we enumerate various molecular polymerase chain reaction (PCR)-based techniques and their validation for specificity, sensitivity, reproducibility, and feasibility for microchimerism detection. Also, to validate our results in a clinical setting, we have determined and quantified microchimerism presence in solid organ transplanted recipients.
Methods
Artificial Mixed Microchimerism Synthesis.
To allow determination of efficiency, sensitivity, and specificity, we used different sources of control DNA receiving either a donor or a recipient label. Mixed chimeras were prepared by mixing 10-fold serial dilutions of donor-labeled DNA that ranged from 500 ng to 0.5 pg in a constant amount of recipient-labeled DNA of 200 to 500 ng.
Patients.
To assure the validity of all the techniques used, 20 healthy control subjects were enrolled to create a battery of artificially controlled microchimeras. Also, to validate results in a clinical setting, 119 transplanted recipients (single kidney [n = 84], heart [n = 27], or liver [n = 8]) were included for longitudinal microchimerism detection at 0, 2 (M2), 6 (M6), 12 (M12), and 18 (M18) months, forming the prospective cohort. The time 0 analysis corresponded to blood extraction before transplantation to examine the presence of pre-transplant microchimerism (from any source) and to allow comparison with M2 to M18 analysis. Also, 33 transplanted recipients (single kidney [n = 15], double kidney [n = 10], or liver [n = 8]) were included for only one single transversal microchimerism determination, forming the retrospective cohort. All recipients received cadaver donor organs and were transplanted at the Hospital Universitari de Bellvitge (Barcelona, Spain) between March 2001 and January 2006.
Blood Samples and DNA Extraction for Microchimerism Study.
Peripheral blood samples were collected in K3EDTA and analyzed in three different fractions: whole peripheral blood (PB), mononuclear cells (MNC), and granulocytic cells (GC). The separation of these last two fractions allowed an increase in donor-cell detection sensitivity. All MNC and GC fractions were isolated by Ficoll–Hypaque (lymphocyte isolation solution; Beckman Coulter, Germany) gradient density separation. Genomic DNA was extracted from each fraction using the QIAamp Blood Kit (Qiagen, Hilden, Germany), following the manufacturer’s recommendations.
Theoretical Number of PCR Replicates.
Not all PCR replicates were found to be positive for positive control DNA at extreme dilutions, thus revealing the initial rate of PCR success for this extreme dilution. We found that specific detection of this DNA was statistically measurable by the probability of a positive PCR event in all PCR performed for the same positive control sample. To determine the number of PCR replicates that would be needed to find at least one single positive PCR event using a positive control sample, the binomial distribution probability test was applied.
This statistical test was used to determine the theoretical number of PCR replicates to be achieved (with an acceptable statistical probability of detection) for a specific initial rate of PCR success on a potential positive sample.
Short Tandem Repeat (STR) Analysis.
A panel of six Cy5-labeled STR markers (TPOX, HUMH01, CSFP01, LPL, FVW, and F13A) was used for microchimerism detection. A previous informative marker screening step was required for each donor-recipient pair using multiplexed PCR for TPOX-HUMTH01-CSFP01 and also for LPL-FVW-F13A. All PCR primers and annealing conditions are described in Table 1. PCR was carried out in a PTC-100 thermocycler (MJ Research, Inc., Reno, NV). PCR products were run in a 6% denaturing polyacrylamide gel using AlfExpress II (Amersham Pharmacia, Uppsala, Sweden) automated DNA sequencer and analyzed with AlfWin Fragment Analyzer software (Amersham Pharmacia).
Variable Number of Tandem Repeat (VNTR) Analysis.
A panel of six Cy5-labeled VNTR markers (Apo-B, D1S80, D4S20, D16S83, D17S30, and D19S20 as described in Table 1) was also used for microchimerism detection with a previous informative screening step, but for this analysis, multiplexed PCR reaction could not be achieved because of loss of efficiency. PCR products were run in a 12% nondenaturing polyacrylamide gel using the same automated DNA sequencer described above.
Human Leukocyte Antigen (HLA) Class I and Class II Polymorphism Analysis.
HLA-A and -B typing and donor detection were performed by reference strand conformation analysis (RSCA) (35). Class II typing for HLA-DRB1 and microchimerism-specific detection were both performed using Olerup primers (Table 1) by sequence-specific primer (SSP)-PCR (36). All HLA disparities were graded from 0 to 6 (out of 6), showing full match to full mismatch, respectively. Like VNTR analysis, all Cy5-labeled PCR products resulting from HLA study were analyzed in AlfExpress II automated sequencer.
For real-time HLA-DRB1 SSP-quantitative PCR (Q-PCR), the same primers were adopted (without Cy5-added modification). All Q-PCR were performed in a LightCycler v2.0 (Roche, Germany) real-time thermocycler, and results were analyzed with the LC Software v4.0 (Roche, Germany), allowing the use of nonlinear inflexion-reproducible standard curve points at extreme dilution points.
Sex Mismatch Analysis.
SRY male specific primers (37) (Table 1) were used for microchimerism determination in a transplanted female receiving an organ from a male. To assure the absence of previous microchimerism interference, an initial pre-transplant analysis step of women was required. Gender-specific PCR amplification and analysis were carried out by real-time PCR as described above.
Results
Adopted Number of PCR Repetitions for Each Sample.
Binomial statistical distribution analysis applied to each molecular technique helped to determine the number of PCR replicates of each sample for the detection of lowest detectable microchimerism level, when present, within the maximum number of recipients (Fig. 1).
To explain the utility of this test, we here describe an example encountered when amplifying the SRY gene by Q-PCR. In artificially controlled chimera testing, the minimum amount of “donor” DNA detected was one genome-equivalent cell (GEC) (= 6.6 pg) in a PCR reaction containing 105 GEC (= 660 pg) of recipient-labeled DNA. Thus, the low-down detection limit was 1:105 donor per recipient cells (DPRC). In this test, we observed that 50% of the PCR reactions gave positive results; consequently, the initial rate of PCR success was 1/2. We then wondered how many PCR replicates of the same sample were needed to assure that at least one control PCR gave a positive amplification when microchimerism was present. This test allowed a choice of the number of PCR replicates, which is a function of the final probability of truthfulness of the test. In other words, when choosing five as the number of replicates, it is expected that at least one will turn out to be a positive PCR reaction of the five replicate reactions in more than 96% of cases (dotted lines in Fig. 1).
After all, this example shows that the detection of SRY by Q-PCR allowed the detection down to 1:105 DPRC (0.001% of microchimerism) in more than 96% (p(Positive) = 0.96) of recipients, although it required up to five replicates of the same sample.
By means of the same SRY test, we were able to detect 1:106 DPRC when achieving a mixed chimera containing 0.6 pg and 660 pg of donor and recipient DNA, respectively. With an initial rate of PCR success of 1/3 and five as the chosen number of replicates, the veracity of the test descended to 86%. Consequently, 1:106 DPRC could be detected in 86% of recipients with five PCR replicates using SRY specific and quantitative detection.
STR and VNTR Polymorphisms.
We managed to reach donor-specific detection levels of 0.1% to 0.05 %. This sensitivity varied depending on the marker used. Higher informativity rates were reached for HumtH01, D1S80, D17S30, Fvw, D4S95, CSFP01, and Apo-B markers, with an informativity rate of 89.6%, 76.4%, 76.0%, 72.6%, 72.4%, 68.9%, and 60.4%, respectively (marker informativity may vary, depending on the examined population). Also, acceptable informativity rates of 52.0% and 51.7% were reached for F13A and TPOX, respectively.
Semiquantification of donor alleles was achieved in some cases by adding the area of the resulting donor and recipient fluorescence peaks and calculating the percentage of donor peaks.
Because VNTR contained longer repeated sequences, differences in length were more important than those obtained with STR markers, therefore leading to the phenomenon of preferential amplification of smaller alleles, which could either interfere or enhance donor-specific detection. Shorter alleles were preferentially amplified compared with longer alleles because they have higher number of repetitions, thus leading to great differences in the resulting amplicon amount within the same number of PCR cycles and the same polymerase concentration limiting factor. If at least one donor allele contained fewer repetitions than both recipient alleles, PCR reaction enhanced donor-specific amplification in mixed chimeras. Inversely, if one or both recipient alleles contained fewer repetitions, the amplification of the ultra minority of donor alleles was interfered by smaller allele preferential amplification artefact. Donor-estimated quantification could be achieved in the enhanced cases by adding peaks of all areas and calculating the percentage of the donor peaks.
HLA-A and -B Nonshared Alleles.
RSCA technique was performed for HLA-A and -B loci typing. As previously described (38, 39), we found that this technique was also useful for HLA matching between individuals, without the need of using a molecular typing ladder, but required running the two pre-transplant samples (donor and recipient) along with the replicates of the tested sample of the (posttransplant) recipient.
The sensitivity of this technique (1%) was not sufficient for microchimerism detection; however, it was useful for macrochimerism detection in HLA class I mismatched bone marrow transplants.
Amplification of HLA-DRB1 Mismatched Samples with Classic PCR Methods.
The study of HLA-DRB1 polymorphisms required a previous typing step for donor and recipient in order to find which nonshared DRB1 polymorphism could differentiate donor from recipient. Olerup primers (36) allowed the differentiation of with alleles or groups of alleles (01, 03-11-13–14, 04, 07, 09, 10, 08–12, 15–16). All SSP-PCR were realized along with the addition of human growth hormone (HGH) gene primer set at limiting concentration, allowing the visualization of the positive control reaction (HGH primers used were 5′-gcc ttc cca acc att ccc tta -3′ and 5′-tca cgg att tct gtt gtg ttt c -3′ [429 bp fragment] as direct and reverse primers, respectively).
Direct SSP-PCR and polyacrylamide electrophoresis allowed specific detection down to 40 pg of donor DNA in a mixed chimera with 100 ng of recipient DNA (Fig. 2A and 2B).
Nested PCR allowed the detection of 4 pg of donor DNA. Triplicates of tested samples and controls eliminated false positives and allowed nested PCR validation, but easy contaminations and addition of multiple controls made the simple nonnested SSP-PCR preferable.
An assay of seminested PCR with three primers (5′ common DR, SSP and common reverse primer) was realized, but sensitivity did not reach higher microchimerism detection (only 0.5%). The amplification of common DR fragment served as PCR internal positive control fragment and allowed DRB1 background amplification (similarly as nested), thus SSP primers could found more donor template amount to amplify (Fig. 2C).
Quantification of SRY in Gender Mismatched Transplants.
Sex-determining region-y gene (SRY) determination was efficient only in females receiving a male organ and no previous typing was necessary for macrochimerism detection. Only male and female DNA controls were required to assure nonfalse results. We reached quantification down to 5 pg of donor (male) DNA in a mixed chimera with recipient (female) DNA, allowing the detection of one genome equivalent cell (GEC) within a total of 105 GEC (Fig. 3). Because this technique allowed quantification down to one single cell level, we paid special attention to quantification and normalization with a control gene.
Any part of conserved DNA could allow normalization by detection of one or both alleles contained in all the cells, but we chose primers amplifying the beta-2-microglobulin (B2m) gene. As all the cells contained the B2m gene, both donor and recipient DNA were amplified, and thus quantified. Standard curves were created among DNA dilutions of donor, recipient, and a mixed chimera of the donor-recipient couple.
Using a male control, we analyzed the correlation between SRY and B2m with the same set of positive samples and we found 2.04 (±0.6) [SRY] = [B2m]. Thus, the correction factor (κ = 2.04 ± 0.6) for SRY detection could be applied to all the samples.
We analyzed inter-PCR variations and the overall standard deviation of all PCR internal controls used reached 0.82% (mean crossing point (Cp) = 20.80 ± 0.17). Also, to reduce intra-PCR variation, the resulting mean Cp of each replicated sample was used for calculation of the detected SRY amount (the same procedure was used with the control gene B2m), consequently, the proportion of SRY within the total of cells (B2m amount) could be calculated following the formula:
(The B2m amount corresponding to male cells fraction was usually insignificant compared with the B2m amount of the recipient cell fraction.)
Previous microchimerism detection in pre-transplant samples was necessary to keep in mind the possible posttransplant false positive (fetal microchimerism, blood transfusion, previous transplantation). For example, we were able to detect fetal microchimerism in a female (carrying a boy) at levels lower than 1:106 DPRC, but posttransplant (kidney transplant) study gave one SRY-log more (addition of SRY amounts to first detection) because of donor microchimerism, at a quantifiable resulting amount higher than 1:105 DPRC (data not shown).
Although lower levels of microchimerism could be detected, no statistically reproducibility could be achieved, and the number of replicates was too high to validate it in a clinical setting. Thus, this nondetected microchimerism could be named nanochimerism and was usually undetected by actual molecular techniques described here.
Quantification of HLA-DRB1 Mismatched Alleles.
Real-time quantification of donor HLA-DRB1 non-shared alleles was possible with a previous typing of each donor-recipient couple, using the standard method described here before. The quantification method used was very similar to that used for SRY quantification, only nonshared alleles were specifically amplified (SSP-PCR). Normalization was also realized with a control gene (B2m) for each DRB1 allele. The sensitivity of the detection varied depending on the amplified allele and the “recipient” allele background. These results are resumed in Table 2.
Validation of Techniques in a Clinical Setting: Microchimerism Detection in Solid Organ Transplanted Recipients.
We first determined the number of DPRC in kidney, heart, and liver transplanted recipients 2 months after transplantation in the prospective group using the SRY or HLA-DRB1 techniques described above and summarized in Table 3. All microchimerism determinations in those recipients demonstrate that almost the half of recipients showed donor circulating cells in their peripheral blood within the first 60 days after transplantation (incidences of microchimerism-positive recipients are shown in Table 4). Heart and kidney transplanted recipients displayed similar microchimerism incidences (51.9% and 55.3%, respectively), whereas almost all liver transplanted recipients (87.5%) showed microchimerism.
We also analyzed a retrospective cohort of double kidney, single kidney, and liver transplanted recipients in a transversal analysis (also shown in Table 4) at no specific time point. This demonstrated that larger organs such as the liver showed higher microchimerism levels than smaller organs such as the kidney.
Therefore, we could detect and quantify 5.4:105 DPRC (range 5.0:104 to 1.2:106), 1.6:104 DPRC (range 4.9:104 to 1.2:106), 1.3:105 DPRC (range 2.6:105 to 2.4:106), and 3.1:104 DPRC (range 1.5:103 to 1.6:106) in single kidney, double kidney, heart, or liver recipients, respectively.
Also, the latest microchimerism-positive detection could be achieved in a retrospective double-kidney transplanted woman at day 2665 after transplantation (3.8:105 DPRC), but no microchimerism determination could be achieved previous to transplantation (data not shown).
Conclusions
Initially based on polymorphism detection used in forensic medicine for cadaveric identification or paternity matching, hematopoietic chimerism detection of those polymorphisms became a useful tool in the transplantation and the autoimmunity fields.
In our study, and according to previously published data (38, 40), we observed that detection of donor-specific HLA-A and -B polymorphisms was suitable for macro-chimerism detection in class I mismatched bone marrow transplants using RSCA technique. Also, this approach can be used with no previous HLA-typing step because RSCA allowed direct matching and, thus, direct donor semi-quantification. In bone marrow class II HLA-DRB1 mismatched transplants, classical PCR-SSP with a previous typing step can be used for this purpose. Also, satellite length polymorphisms (extensive lists of STR or VNTR markers are now available) can be used for macrochimerism detection, but prior informative loci must be determined for each donor-recipient couple. Because macrochimerism is defined by the presence of 1% to 100% of foreign cells in a recipient, intrinsic technique variations up to 1% in RSCA, VNTR, or STR techniques did not result in statistically significant variations. Moreover, detection of donor-cell engraftment or relapse after bone marrow transplantation need to be time-monitored and compared with previous results and clinical diagnosis.
We agree that microchimerism detection needed more accurate techniques with lower intrinsic variations. In this way, STR or VNTR markers were suitable for micro-chimerism qualitative or semiquantitative detection. Our results suggest that microchimerism quantification can be performed using HLA-DRB1 nonshared alleles using classical SSP-PCR with polyacrylamide fluorescence detection or quantitative SSP-PCR real-time quantification. We also argue that it can be applied to mismatched HLA class I (A, B, or C) transplants. Also, male gender discrimination by quantitative real-time PCR (SRY) allowed high sensitivity. Thus, we suggest that HLA-DRB1 (classical and real-time PCR) and SRY (real-time PCR) techniques, showing strong reproducibility and sensitivity, could be used for microchimerism detection because both techniques can cover the majority of transplant cases.
With concern to DPRC detected in recipients after solid organ transplantation, we can observe that smaller mass organs like kidney or heart displayed less DPRC than liver. This phenomenon can also be caused by additional properties of liver like continuous cell turnover (41–44). Moreover, liver can shelter a higher amount of cells during donor brain-death associated stress, which can be later returned to circulation. We have also observed in kidney and heart that posttransplant microchimerism is a transient phenomenon that trends to disappear within the first year.
In this study, we have performed a density-gradient separation mediated by Ficoll to separate mononuclear cells from granulocytes. It is possible that many cells migrating directly from the organ and different from lymphocytes, macrophages or granulocytes can be detected by PCR as donor cells. No flow cytometry was performed to identify which cells originate microchimerism. Moreover, microchimerism can also be a result of DNA contained in recipient cells or from apoptotic bodies as many authors have already published (45). Also, in unpublished data, we have performed a PCR directly from plasma to detect free-donor DNA in serum, but we did not obtain any positive result, leading us to the conclusion that microchimerism was originated by circulating cells or by DNA contained in recipient cells.
As we previously published (46), we believe that to include molecular detection of microchimerism as a routine protocol in solid organ transplanted recipients can provide undeniable additional data, involving clinical decisions, ultimately concerning the fate of the transplanted organ.
Primer Sequences and Annealing Conditions for Chimerism Detection
Minimum Donor-Detected DNA HLA-DRB1 Allele Amounts in Different Recipient Background Alleles (Donor DNA Detected Amounts Are Indicated in pg)
Summary of PCR Techniques Used to Detect Chimerism and Applicability
Microchimerism Detection in Solid Organ Transplanted Recipients
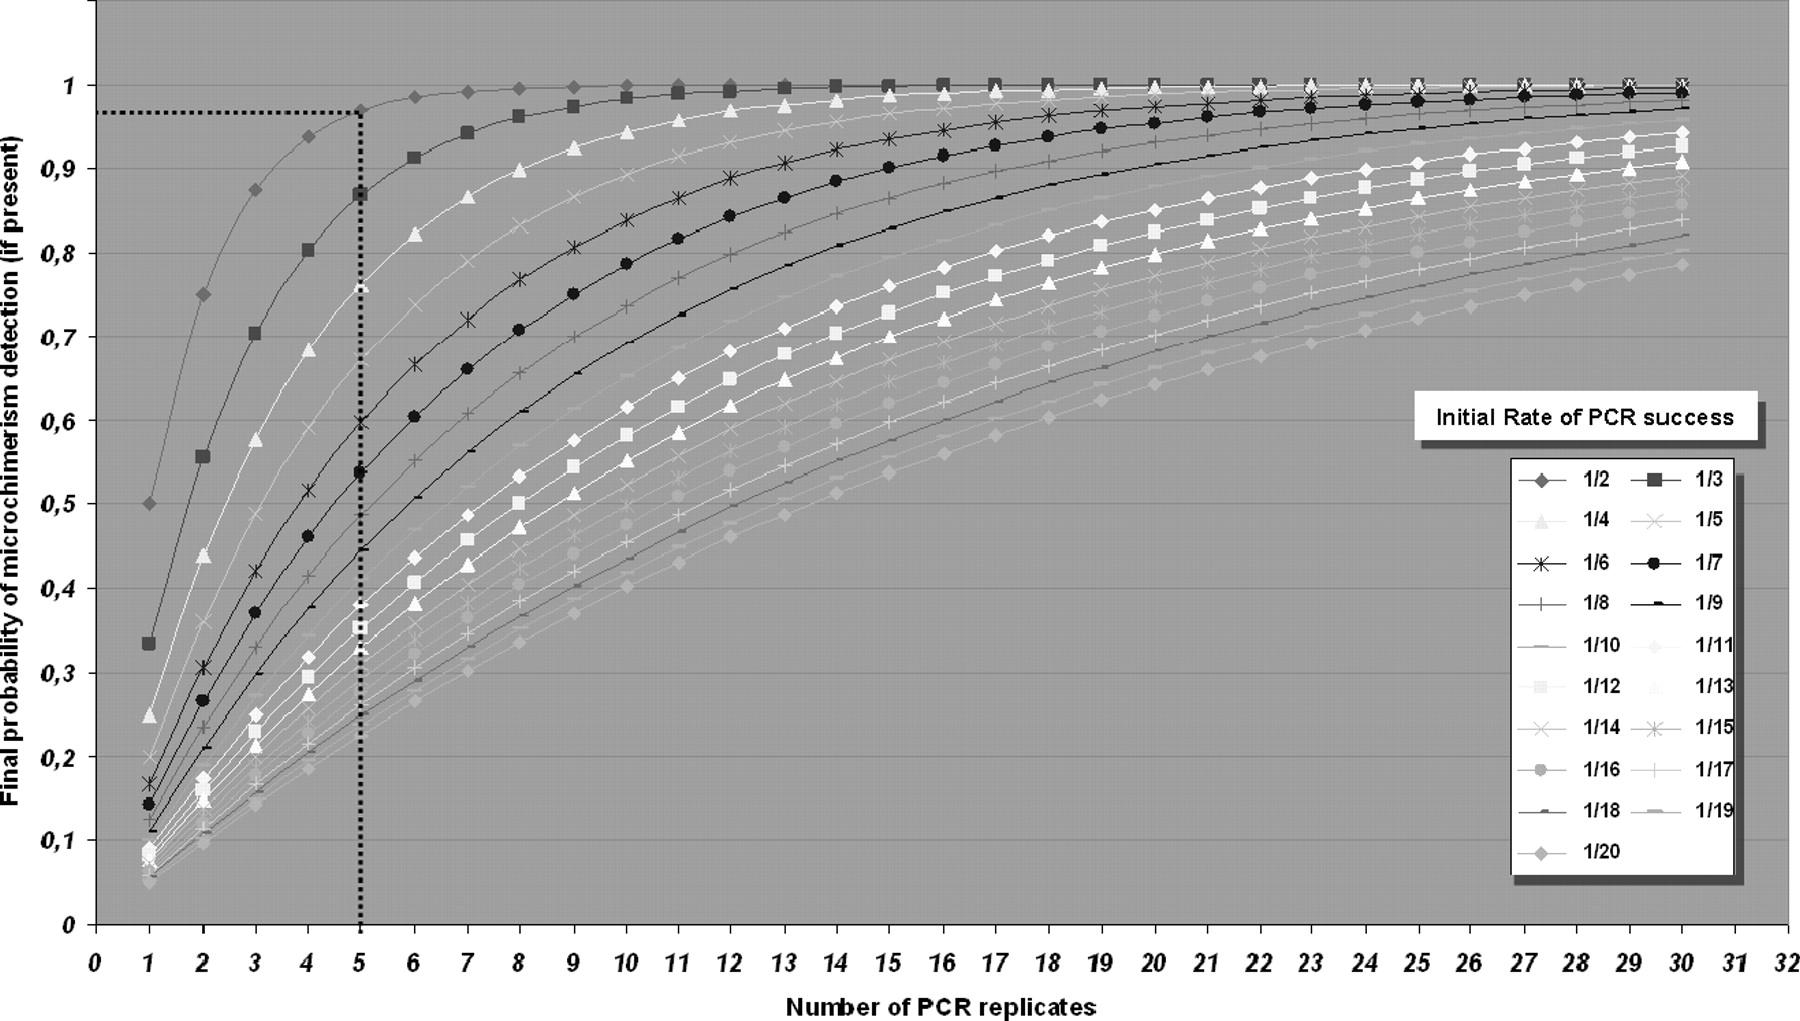
Graphical plot of binomial statistical distribution test. Each curve represents the initial rate of PCR success observed for a specific technique using the most diluted DNA control sample detected. X axis shows the number of PCR replicates to be achieved, and y axis displays the final likelihood of detection (final probability of microchimerism detection). For example, when we diluted a positive “donor” control DNA in “recipient” DNA at 1:105 levels, we observed that only 50% of the PCR reactions gave positive results, therefore the initial rate of PCR success was 1/2. Choosing a number of replicates of five allowed the detection of at least one positive PCR among the five replicates in more than 96% of cases (illustrated by the dotted lines). Consequently (in this example), this test permitted the detection down to 1:105 DPRC (donor per recipient cell) in more than 96% of samples, using five replicates for each sample.
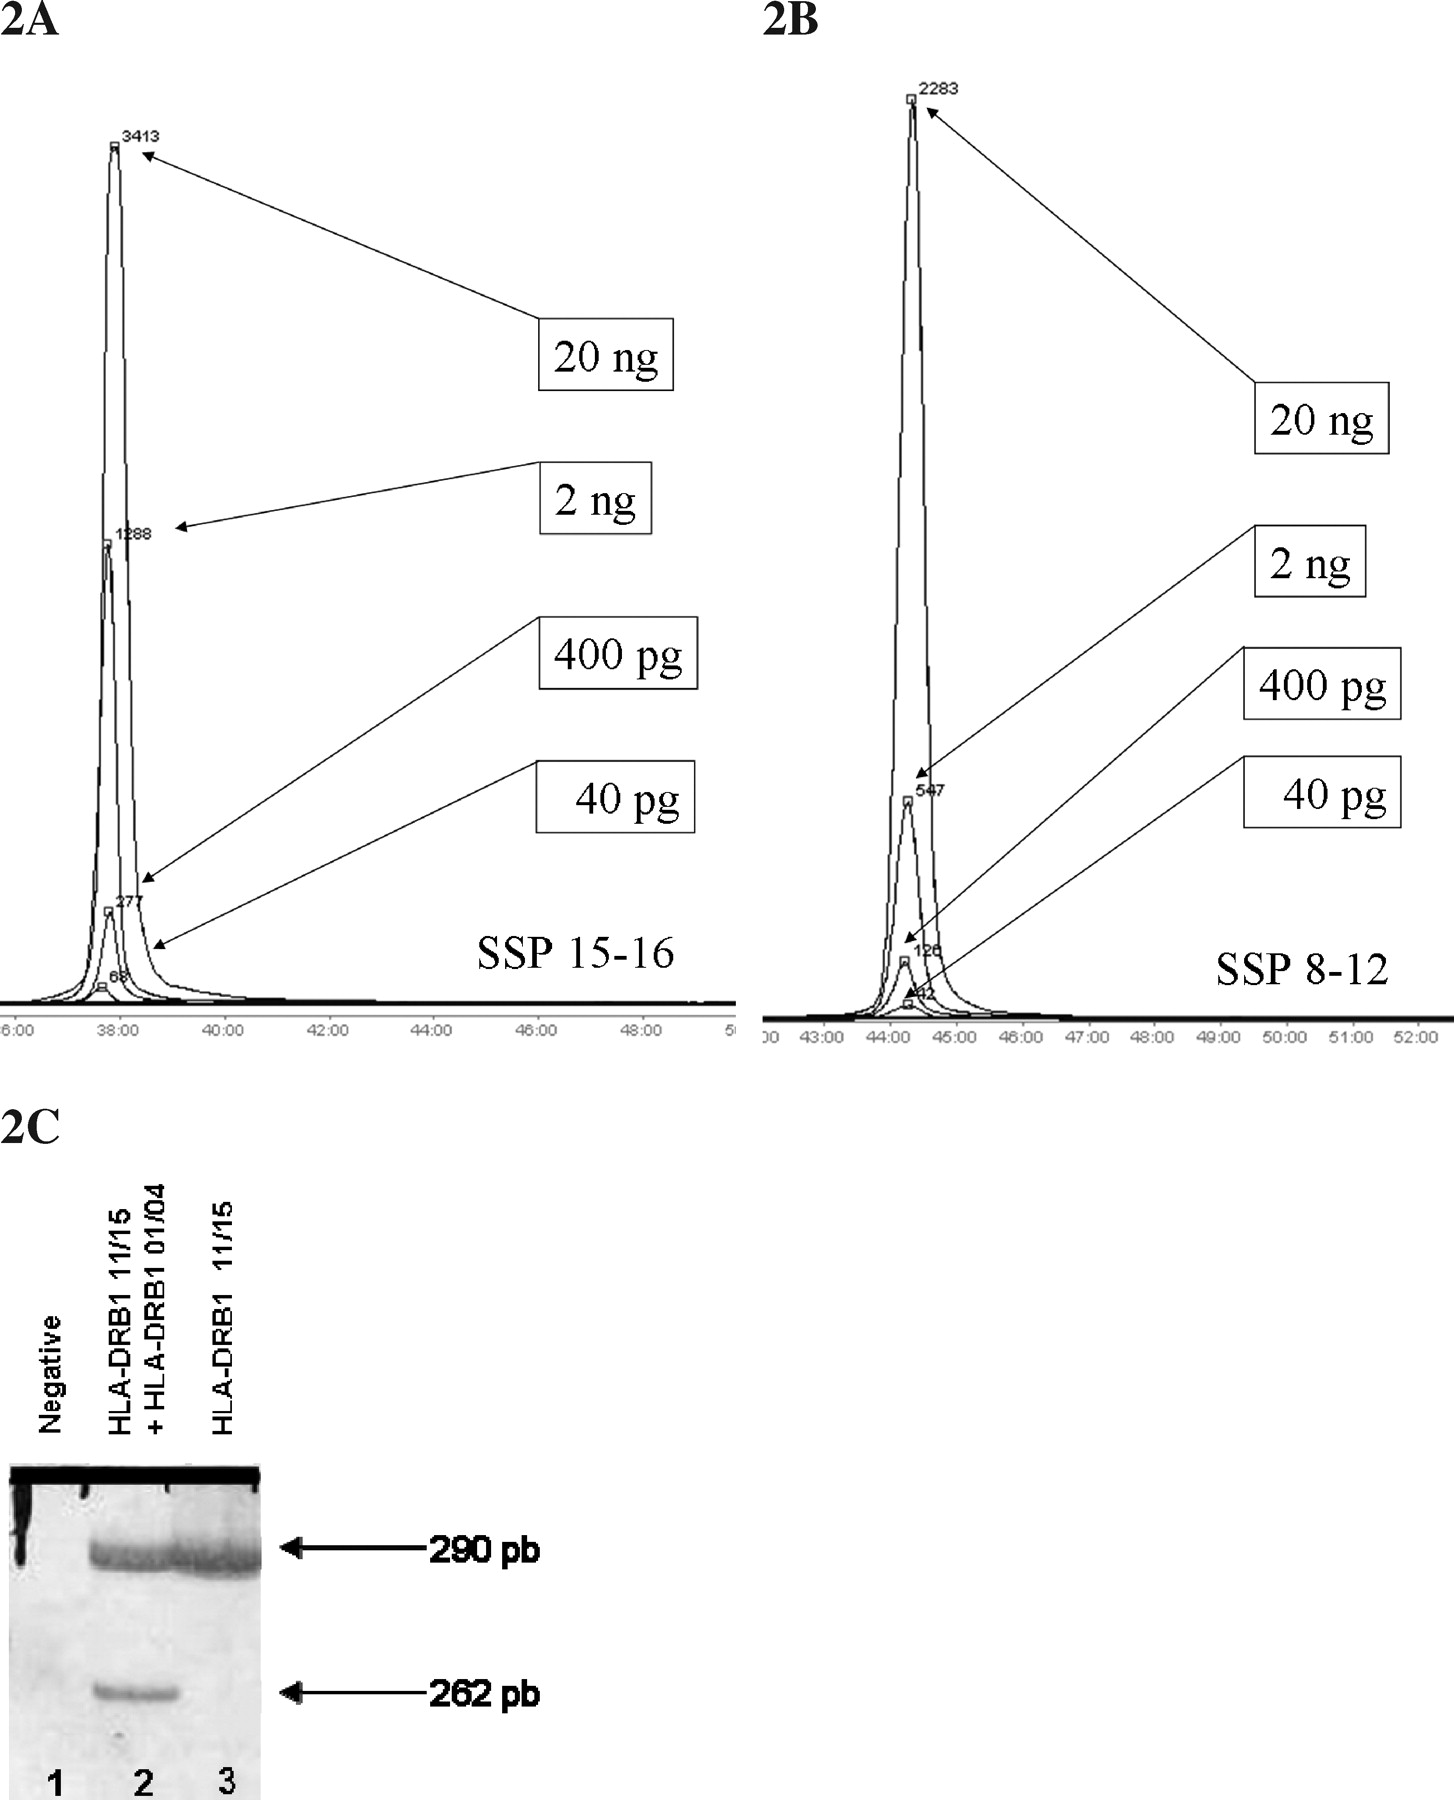
Donor-specific detection of nonshared HLA-DRB1 alleles using standard nonquantitative PCR techniques and artificial mixed chimeras. (A and B) Donor specific detection of HLA-DRB1 alleles in a mixed chimera containing 200 ng of recipient-simulating DNA with a single sequence-specific primer PCR in a 6% polyacrylamide gel electrophoresis in an automated sequencer, allowing a donor-specific maximum sensibility of 0.02%. Each peak represents the area of the amount of fluorescent PCR generated amplicons. (A) Specific detection down to 40 pg of donor alleles 15 or 16. (B) Specific detection down to 40 pg of donor alleles 08 or 12. (C) Seminested PCR of HLA-DRB1 locus using three primers amplifying both the long common sequence (290 pb) and the specific HLA-DRB1–01 (262 pb) region in a 8% polyacrylamide silver-stained gel electrophoresis. Lane 2 (mixed chimera) also showed a positive amplification of donor DRB1–01 allele, and lane 3 showed no amplification of the 262 pb fragment in the DRB1–01 negative control recipient.

Standard curve for SRY quantification in LightCycler v2.0 analyzed with LightCycler software v4.05. (3A) Standard curve directly obtained with LightCycler software. (3B) Detailed standard curve obtained from LightCycler software data. This curve displayed linearity in crossing point (Cp) increase (Cp = − (1/log E) × log T0 + (log K/log E)) for template concentrations ranging from 1000 to 10 genome equivalent cell (GEC) (6.6 ng to 66 pg) and showed nonlinear curves for extreme points (from 103 to 104 GEC and from 10 to 1 GEC). This inflexion is caused by a variation in PCR efficiency at very low or very high template concentrations resulting in a nonlinear increase of Cp (ΔCp increase between 10-fold dilutions samples was different), showing that efficiency seemed to be changed as ΔCp (10 to 1 GEC) < ΔCp (100 to 10 GEC). The resulting global calculated efficiency found was: E = X̄ (∑ n 1E1–2, E2–3, ..., E(n–1) – n ) = 2.134 ± 0.014. (Legend: E = efficiency of PCR for each dilution; T0 = initial template concentration; Cp = crossing point; K = amplified number of copies at the CP.)
Footnotes
This study was partially financed by a Fundació Marató TV3 2000 grant. The author (JMP) was the recipient of a grant Fundació Crèdit Andorrà 2002–2005.
Acknowledgements
The authors thank J. M. Grinyó, N. Manito, J. Fabregat, and E. Ramos for their clinical assessment and P. Hernàndez, J. Klaustermeier, A. Villanueva, C. Maxwell, and G. Capellà for their helpful contributions.