



Abstract
Indomethacin, a non-steroidal anti-inflammatory drug (NSAID), has been reported to inhibit the growth of medullary thyroid carcinoma (MTC) cells in vitro. However, the mechanism of inhibition of MTC cell growth by indomethacin and its potency have yet to be revealed. We examined the effect of indomethacin on three different MTC cell lines (TT cells, DRO 81–1 cells and HRO 85–1 cells) and two non-MTC cells. The mechanism of indomethacin action in MTC cells was investigated by analyzing intracellular prostaglandin level, apoptosis, and cell cycle in TT cells. Indomethacin inhibited cell growth of all three MTC cell lines but not normal thyroid cells or anaplastic thyroid carcinoma cells. Indomethacin at 10 μM or greater showed a dose response inhibition of cell growth. Indomethacin at 25 μM, a putative therapeutic serum indomethacin level, showed potency similar to 100 to 200 nM sunitinib, a receptor tyrosine kinase inhibitor. To examine whether prostaglandin depletion might determine the inhibition of MTC cell growth, we created different prostaglandin E2 (PGE2) levels in TT cells using three different NSAIDs. A profound PGE2 depletion by indomethacin-ester, a potent cyclooxygenase (COX) II inhibitor, showed the least inhibition of cell growth. Indomethacin did not increase apoptosis of TT cells. Indomethacin, but not naproxen or indomethacin-ester, reduced cell cycle progression into S phase; this was unrelated to the degree of PGE2 depletion. The expression of phosphorylated retinoblastoma (pRb) protein that shifts cells from G1 to S phase was reduced after exposure to indomethacin. In conclusion, indomethacin has specific anti-tumor effect on MTC cells, probably by reducing cell cycle progression into S phase rather than by prostaglandin depletion. Since no drug therapy is currently available for MTC, indomethacin may be one of the therapeutic candidates.
Introduction
Non-steroidal anti-inflammatory drugs (NSAIDs) are known to exert their anti-tumor effects on colon cancer (1), breast cancer (2), lung cancer (3), squamous cell carcinoma of the head and neck (4), and prostate carcinoma (5) by inhibiting cyclooxygenase (COX) or independent of COX inhibition. Quidville et al. reported the anti-proliferating action of indomethacin in TT cells, medullary thyroid carcinoma (MTC) cell line, in vitro and in nude mice (6). MTC accounts for 2 to 5% of thyroid cancers (7) and may present as either familial type or sporadic type. The only effective treatment of this malignant disease, regardless of familial or sporadic type, is surgical removal of the thyroid gland and its metastases. Therefore, the study by Quidville et al. raises the possibility of clinical application of indomethacin for patients with MTC although no study has been reported in humans. The action of indomethacin in MTC cells has been attributed to the non-selective inhibition of both COX I and COX II that leads to the reduction of intracellular formation of prostaglandins (6). Indomethacin also increased 15-hydroxyprostaglandin dehydrogenase activity, an enzyme that degrades prostaglandins, causing further depletion of prostaglandins in TT cells (6). In fact, activation of 15-hydroxyprostaglandin dehydrogenase is considered as anti-tumor action of NSAIDs (8). The critical question is whether prostaglandin depletion alone is sufficient to inhibit MTC cell growth. Since indomethacin has multiple actions in cancer cells (9–13), it is important to clarify the mechanism involved in the inhibition of MTC cell proliferation by this drug. In addition, the in vitro potency of indomethacin as an anti-tumor agent in MTC cells needs to be established by comparing it with that of chemotherapeutic agents. We examined the anti-tumor effect of indomethacin on three different MTC cell lines and its anti-tumor mechanism in TT cells. To establish the anti-tumor potency of indomethacin in MTC cells, we compared its potency with that of sunitinib, a receptor tyrosine kinase inhibitor (14, 15).
Materials and Methods
Reagents and MTC Cell Lines.
All chemical reagents were obtained from Sigma Chemical Co (St. Louis, MO) unless specified otherwise. TT cells, fetal bovine serum, Dulbecco’s Modified Eagle’s Medium (DMEM), and MTT (3-(4,5-dimethylthiazoly-2)-2,5-diphenyltetrazolium bromide) assay kit were obtained from ATCC (Manassas, VA). Two other MTC cell lines (HRO 85–1 and DRO 81–1 cells derived from patients with sporadic MTC) and anaplastic thyroid carcinoma cell line (ARO cell) were kindly provided by Dr. Guy J. Juillard, UCLA School of Medicine. Sunitinib was obtained from Pfizer Inc. (New York, NY).
Cell Culture.
TT cells were cultured in 6-well plates using Ham’s F-12K medium supplemented with 2 mM l-glutamine, 1.5g/L sodium bicarbonate and 10% fetal bovine serum. HRO 85–1 and DRO 81–1 cells were grown in DMEM supplemented with 10% fetal bovine serum. Medium was changed every 2 days. ARO cells were cultured in RPMI 640 medium supplemented with 10% FBS. Primary culture of porcine thyroid cells was carried out using the 6H medium containing 10% FBS as described previously (16).
Cell Growth Assay.
Cell growth was determined by the MTT assay and actual counting of cells after exposure to indomethacin. For the MTT assay, 20,000 cells/well were seeded in a 6-well plate. Cells were exposed to drugs for 2, 4 and 8 days; control cells without drug were used for comparison purpose. Cells from each well were removed with trypsin-EDTA solution and transferred to 5 wells of 96-well plate for the MTT assay. MTT dye conversion was assayed at 570 nm using a VERSAmax microplate reader (Molecular Devices, Menlo Park, CA). In parallel to the MTT assay, cell number was also counted in a hemocytometer chamber after cells were removed by trypsin-EDTA.
Prostaglandin Measurement in Cells.
To create different intracellular prostaglandin levels, TT cells (105 cells/well) in 6-well plates were incubated with 200 μM indomethacin, 400 μM naproxen or 800 μM indomethacin-ester (potent COX II inhibitor) for 4 days. Cells were lysed using 2 μl of 3-[(3-cholamidopropyl) dimethylammonio]-1-propanesulfonate cellular lysate. The intracellular PGE2 levels were measured using a commercial EIA kit (Cayman Chemical, Ann Arbor, MI,).
Caspase Activity Assay.
TT cells (75,000 cells/well) in 6-well plates were initially treated with 200 μM indomethacin for 2 and 4 days. Then cells were harvested by trypsin-EDTA and 10,000 cells were plated into 96-well plates and incubated for 5 hours without indomethacin. To determine the apoptosis activity, we measured caspase 3/7, caspase 8, and caspase 9 activities using the Caspase-Glo assay kit (Promega, Madison, WI). The appearance of the fluorescence was analyzed on a GloMax TM 20/20 Luminometer (Promega).
Effect of Indomethacin on Calcitonin and Calcinoembryonic (CEA) Antigen.
To examine whether indomethacin has any direct action on MTC markers, we measured gene expression of calcitonin and CEA in TT cells that were incubated with 0 to 200 μM indomethacin for 4 days. Total RNA from the cell pellets was extracted using the RNeasy Micro method (QIAGEN, Valencia, CA), and cDNA was synthesized with SuperScript III reverse transcriptase (Invitrogen, Carlsbad, CA). Real-time PCR was performed using DNA Engine Opticon system (MJ Research, San Francisco). Each reaction mixture contained cDNA as a template, 2X mastermix solution, and 0.1 μM of primers. The gene-specific primer sets were designed using a computer program of Primer 3 Input. CEA primers: (forward, 5′-ATGTCCCAAGCCT-CATCGT; reverse, 5′-CATCCAACACTCTGTCAAA). Calcitonin primers: (forward, 5′-CAGCGACTTGGAGA-GAGAC; reverse, 5′-AGCCCAAAGAGCCACCA).
Cell Cycle Analysis.
TT cells (106cells/well) in 6-well plates were exposed to 200 μM indomethacin, 400 μM naproxen or 800 μM indomethacin-ester for 4 days. After cells were washed, DNA was stained with 50 μg/ml propidium iodide (PI) solution (0.02 μg/μl RNase A, 1.0 mg/ml sodium citrate-dihydrate, 0.1 μg/μl PI, 0.3% Triton X-100) at 2°C for 30 min. For fluorescence-activated cell sorting (FACS) analysis, the FACScan (Becton Dickinson, Franklin Lakes, NJ) was used. Cell-cycle analysis was performed with the use of ModFit LT software (Verity Software House, Inc., Topsham, ME).
Western Blot Analysis.
We measured protein expression of phosphorylated retinoblastoma (pRb) and total retinoblastoma (Rb), cell cycle switch proteins (11, 12), by Western blot. TT cells incubated with 200 μM indomethacin for 4 days were washed and exposed to protein extraction buffer containing 62.5 mM Tris-HCl, 50 mM DTT, 0.1% Triton X-100, 10% glycerol, 2% SDS, and mixture of protease inhibitors (Pierce, Rockford, IL) followed by sonication of the cell mixture. Protein (30 μg/lane) was run on 10% SDS-PAGE gels and transferred to nitrocellulose membranes. All antibodies were obtained from Cell Signaling (Danvers, MA): Rb (4H1) mouse monoclonal antibody that reacts to human total Rb; Phospho-Rb (Ser780) antibody for phosphorylated Rb; and β-actin antibody for control protein expression. Reactive protein bands were developed using chemiluminescence detection reagents (Cell Signaling).
Statistical Analysis.
All statistical analyses were performed in SAS 9.1 software. Means and standard deviations were calculated for continuous measurements: cell growth number and cell growth percents. Analysis of variance was used to establish differences in means among all groups (treatments, cell types, or concentrations), and Dunnett 2-tail tests were used to make comparisons of groups to the control groups. Scheffe tests were used to make other pair wise group comparisons and to evaluate the difference between groups and control for different testing conditions. Tests were performed at alpha = 0.05 and alpha = 0.01 significance levels.
Results
Cell Growth in the Presence of Different Concentrations of Indomethacin.
Figure 1 shows an inhibition of TT cell growth in the presence of 10 μM to 400 μM indomethacin. The inhibitory effect of indomethacin on TT cell growth was dose- and time-dependent (Fig. 1A). Indomethacin at 10 μM showed significant inhibition of cell growth when compared with that of the control (P < 0.01). To examine whether indomethacin is a universal inhibitor of cell growth, we used ARO cells and primary culture of normal porcine thyroid cells that were exposed to 200 μM indomethacin. There was no significant inhibition of cell growth in ARO cells and pig thyroid cells up to the 4th day of indomethacin treatment. There was a marginal decrease in cell growth in pig thyroid cells at the 8th day of indomethacin treatment when compared with that of ARO cells (Fig. 1B).
Effect of Indomethacin on Three MTC Cell Lines.
Figure 2A shows the comparison of inhibitory effects of indomethacin on TT cells, HRO 85–1 cells and DRO 81–1 cells. Indomethacin inhibited cell growth of all 3 MTC cell lines although HRO 85–1 cells and DRO 81–1 cells were not as sensitive as TT cells in response to the inhibitory action of 25–400 μM indomethacin. In TT cells, the concentration of indomethacin to inhibit 50% of cell growth was 200 μM.
Effect of Sunitinib on Three MTC Cells Line.
As shown in Figure 2B, sunitinib inhibited cell growth of all three types of MTC cells, and the anti-tumor potency of sunitinib was almost the same among the three MTC cells lines. The concentration of sunitinib to inhibit 50% of cell growth was 7.5 μM in TT cells indicating that sunitinib is about 26-fold more potent than indomethacin.
Relationship Between Intracellular Prostaglandin Levels and Inhibition of Cell Growth.
Table 1 shows PGE2 levels in TT cells after exposure to three different NSAIDs at different concentrations. Indomethacin-ester (potent COX II inhibitor) at 800 μM caused the most profound PGE2 depletion; however, its inhibitory potency on cell growth was the weakest among the three NSAIDs. Thus, the degree of PGE2 depletion alone is not the determining factor of MTC cell growth.
Effects of Indomethacin on Apoptosis.
Caspase activity is expressed as an arbitrary unit of fluorescent reading, and the result is expressed as mean ± SD of quadruplicate wells that contained 10,000 cells in each well. Caspase 3/7 activities were 1 ± 0.08 (control cells) and 1.07 ± 0.35 (indomethacin-treated cells). Caspase 8 activities: 1 ± 0.10 (control cells) and 1.10 ± 0.38 (treated cells). Caspase 9 activities: 1 ± 0.19 (control cells) and 1.11 ± 0.04 (treated cells). Thus, caspase 3/7, 8 and 9 activities were almost identical between indomethacin-treated TT cells and control cells.
Effect of Indomethacin on Calcitonin and CEA Gene Expression.
Quantitative RT-PCR showed that calcitonin/β-actin ratios in control samples and indomethacin-treated samples were 1.56 ± 0.1 and 1.52 ± 0.29 (mean ± SD of triplicate experiments), respectively. CEA/β-actin ratios were 1 ± 0.3 (control cells) and 0.97 ± 0.4 (indomethacin-treated cells). Thus, indomethacin does not have a direct inhibitory effect on gene expression of the two MTC markers.
Morphological Examination.
There was a small colony formation in indomethacin-treated TT cells (Fig. 3). The appearance of nucleus and cilia-like formation in the membrane was the same in untreated cells and indomethacin-treated cells (Fig. 3).
Effect of Indomethacin on Cell Cycle Distribution.
To determine whether cell growth inhibition was caused by the reduction of cell cycle progression into S phase, the distribution of cells in different phases of the cell cycle was assessed 4 days after treatment with 200 μM indomethacin, 400 μM naproxen, or 800 μM indomethacin-ester. Flow cytometric analysis for DNA content revealed that indomethacin treatment reduced S-phase cells without significant change in G0–G1 phase cells when compared with those of control cells (Fig. 4). In contrast, naproxen or indomethacin-ester increased S phase cells. Therefore, S phase cell reduction appears to be specific to indomethacin among the three NSAIDs, and a profound depletion of PGE2 by indomethacin-ester had no inhibitory effect on the cell cycle.
Effect of Indomethacin on Retinoblastoma (Rb) Protein Expression.
Hyperphosphorylation of the Rb protein (pRb) is responsible for cells to enter S phase during the cell cycle (7–19). Western blot analysis of cell homogenate showed about 38% decrease in pRb expression in indomethacin-treated cells when compared with that of the control cells (Fig. 5). However, there was no change in total Rb expression with indomethacin treatment. Thus, indomethacin appears to inhibit phosphorylation of Rb causing decreased amount of pRb (shifting protein from G1 to S phase). This explains the decreased number of cells in S phase after exposure to indomethacin.
Discussion
The aim of this study is to provide a rational explanation for potential use of indomethacin for treatment of MTC. We confirmed the growth inhibitory action of indomethacin in TT cells as Quidville et al. have shown (6). Our study extended to sporadic MTC cell lines (HRO 85–1 cells and DRO 81–1 cells) and demonstrated the anti-tumor action of indomethacin in all three MTC cell lines (Fig. 2A). The anti-tumor action of indomethacin appears to be specific to MTC cells when compared with cell growth of ARO cells (Fig. 1B). The anti-tumor potency of indomethacin in MTC cells was compared with that of sunitinib, a receptor tyrosine kinase inhibitor. Sunitinib is one of the available multiple receptor tyrosine kinase inhibitors including inhibition of Ret-derived kinase (14, 15). Sunitinib inhibited cell growth of all three MTC cell lines (Fig. 2B). When the anti-tumor potency of indomethacin was compared with that of sunitinib in TT cells, sunitinib showed a 26-fold greater potency than indomethacin to inhibit 50% cell growth. The anti-tumor activity of sunitinib is typically seen at 10 to 100 nM range in vitro (14), whereas indomethacin exerts its effect at 100–400 μM range depending on the cancer cell type (6, 9–12). The question can be raised whether the concentrations of indomethacin used in this experiment are attained in humans. Blood levels of indomethacin after 100 mg oral dose in an adult were reported to be around 17 μM (20). If patients take 50 mg indomethacin three times a day, their blood levels may be greater than 20 μM. Thus, 25μM indomethacin can be a possible blood level during indomethacin treatment, and this concentration corresponds to the anti-tumor action of 100–200 nM sunitinib. However, an extrapolation of in vitro dose to an attainable serum concentration has to be interpreted with caution, since the two systems are fundamentally different, particularly metabolic degradation of the drug in vitro and in vivo. Two experimental new receptor tyrosine kinase inhibitors (motensanib 1 and vandetanib 2 ) are emerging as promising chemotherapeutic agents for patients with MTC (abstract presentations, see footnote). It will be interesting to compare the potency of indomethacin with that of motensanib and vandetanib. Our present study showed that indomethacin did not inhibit gene expression of calcitonin or CEA. Thus, selective inhibition of calcitonin and CEA by indomethacin without affecting tumor cell growth is unlikely.
The 3rd Annual Meeting of the American Society of Clinical Oncology (ASCO 2007), Abstract 6017.
The 3rd Annual Meeting of the American Society of Clinical Oncology (ASCO 2007), Abstract 6018.
The most critical question is the mechanism of the anti-tumor action of indomethacin in MTC cells. In general, anti-tumor effects of NSAIDs are classified by the following mechanisms: prostaglandin depletion by inhibiting COX (6); increased apoptosis (12); inhibition of angiogenesis (12); causing cell cycle arrest (21); or increased sensitivity to chemotherapy (22). Recently, Pan et al. demonstrated that NSAIDs including indomethacin (100 μM) demethylated the promoter of SPARC (anti-metastatic gene) that is frequently methylated in lung cancer cells (23). Thus, demethylation of anti-tumor genes by indomethacin may be a new epigenetic mechanism of inhibiting tumor growth (24). In MTC, Quidville et al. speculated that depletion of intracellular prostaglandins via COX I inhibition and activation of 15 hydroxyprostaglandin dehydrogenase were the basis for the anti-tumor action (6, 8). Our present study does not support that depletion of prostaglandins is solely responsible for the anti-tumor action of indomethacin, since a profound PGE2 depletion induced by indomethacin-ester, a potent COX II inhibitor, showed only minimal inhibition of cell growth. We scrutinized cell morphology change after exposure to indomethacin hoping that it might give us some clues, but no drastic change of cell morphology was noted (Fig. 3). The possibility of apoptosis by indomethacin was excluded in TT cells because of no change of caspase 3/7, 8 and 9 activities in the presence or absence of indomethacin. We studied the effect of indomethacin on the cell cycle by flowcytometic analysis. Indomethacin decreased cell cycle progression into S phase (Fig. 4). TT cells are slow growing cancer cells with doubling time of 83 hours; this makes the changes in the number of cells in S phase and G0–G1 phase are small when compared with fast growing cancer cells. However, when S phase cells and G0–G1 phase cells are combined as a pair and compared between the control group and indomethacin-treated group by the Scheffe test, there was a significant difference between the two groups (P < 0.01). Cell cycle reduction into S phase was not seen by the other 2 NSAIDs even though PGE2 was markedly decreased by indomethacin-ester (Table 1 and Fig. 4). It is reasonable to conclude that prostaglandin depletion alone is not the cause of the reduction of S phase cells. To further investigate the cause of S phase cell reduction by indomethacin, we examined the expression of hyperphosphorylated retinoblastoma (pRb) protein. When the complexes Cyclin D1/CDK4/6 are activated, hyperphosphorylation of Rb takes place, and phosphorylated Rb (pRb) shifts cells from G1 to S phases (17–19). Our present experiment demonstrated specific reduction of pRb by indomethacin (Fig. 5); this should explain the reduction of S phase cells by indomethacin. Naproxen and indomethacin-ester inhibited MTC cell growth without reducing S phase progression (Table 1 and Fig. 4) suggesting that some NSAIDs may have additional growth inhibitory effect on MTC cells. Our present study supports a clinical trial of indomethacin in patients with MTC.
Comparison of Intracellular PGE2 Level and Cell Growth Inhibition by NSAIDs a
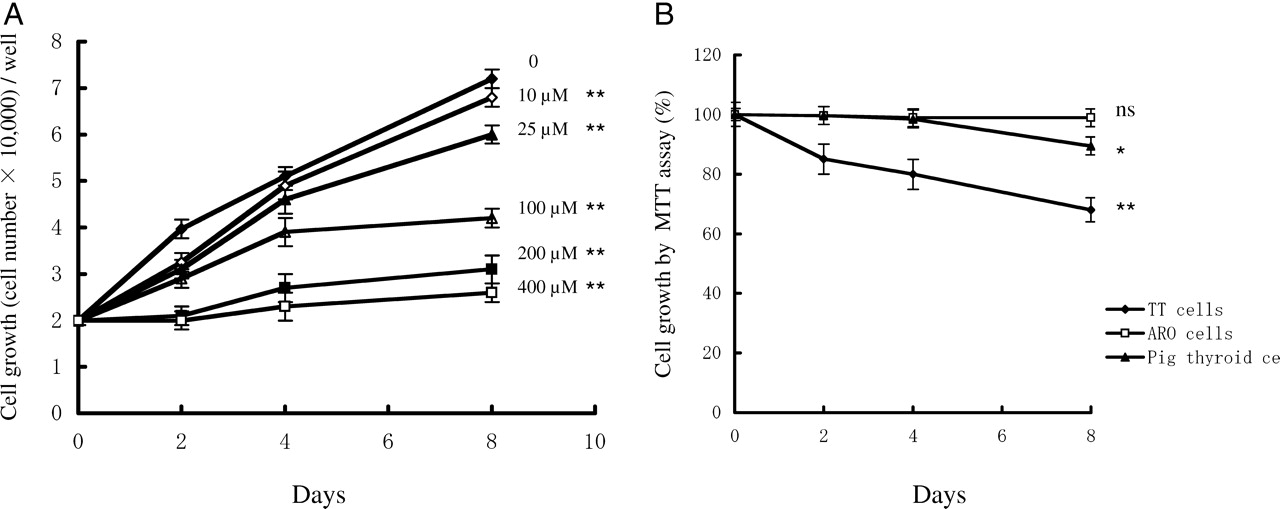
Time course changes in cell number after exposure to indomethacin. (A): TT cells (20,000 cells/well in 6-well plates) were exposed to different concentrations of indomethacin from day 2 to day 8. Cells were removed by trypsin-EDTA solution on days 2, 4 and 8. Cell number was counted using a hemocytometer. The results are mean ± SD of quadruplicate samples. ANOVA and Dunnett 2-tail tests were used to make comparisons of groups to the control groups on the day 8 samples (** P < 0.01 vs. control). (B): Effects of indomethacin on ARO cells and normal porcine thyroid cells. TT cells were used to confirm the inhibitory activity of indomethacin. Cells were exposed to 200 μM indomethacin for 2, 4 and 8 days. Cell proliferation was measured by the MTT assay. The results are mean ± SD of quadruplicate samples. At each day, control samples without drug were obtained, and cell proliferation activity of control samples was considered as 100%. ANOVA and Dunnett 2-tail tests were performed on the day 8 samples (* P < 0.5, ** P < 0.01 vs. control).
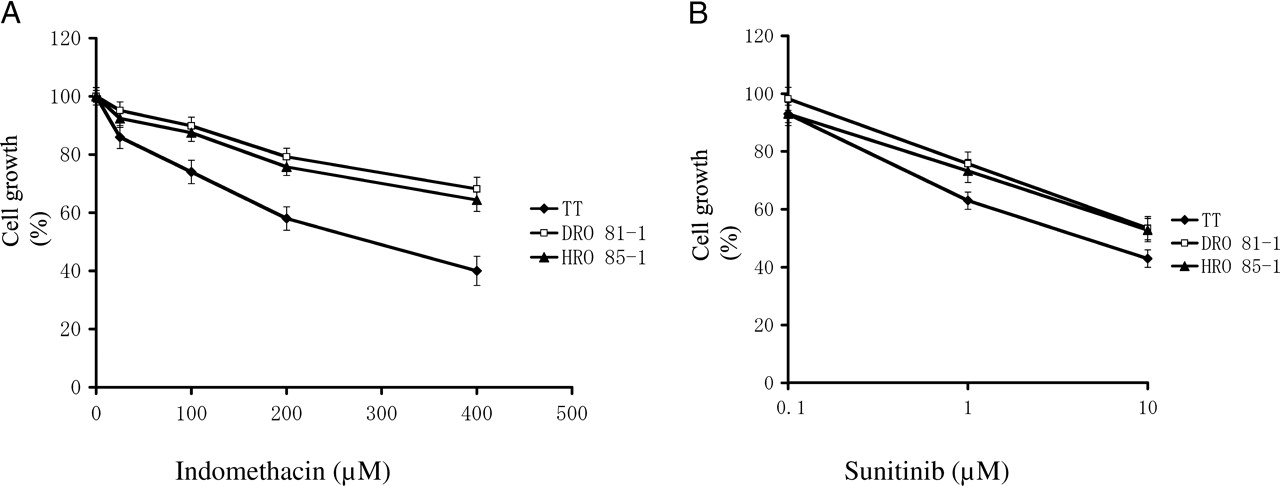
Cell growth in response to indomethacin and sunitinib in three different MTC cell lines. TT cells, DRO 81–1 and HRO 85–1 were exposed to different concentrations of indomethacin (2A) and sunitinib (2B) for 8 days. Cell growth was measured by the MTT assay. Cell growth of control samples (no drug) on day 8 was considered as 100%. The results are mean ± SD of quadruplicate samples. Indomethacin at all concentrations showed significant reduction of cell growth when compared with the control samples in TT cells, HRO 85–1 cells and DRO 81–1 cells by ANOVA and Dunnett 2-tail tests (P < 0.01). Sunitinib concentrations in Figure 2B are presented by the logarithmic scale. Sunitinib at 1 μM and 10 μM showed a significant reduction of cell growth (P < 0.01).

Morphology changes of TT cells with indomethacin treatment. The four panels are cultured TT cells on glass slides with and without indomethacin. Cells were fixed in alcohol and stained with Wright stain. Figures A and B are from wild-type and indomethacin-treated cells, respectively, at a low magnification (×4 objective). Figures C (wild-type cells) and D (indomethacin treated cells) are at a high magnification (×60 magnification). There was no morphological difference between the non-treated and indomethacin-treated cells. Both had striking cilia-like cell membrane extensions and similar nuclear appearances (panels C & D). The only difference was larger colony formation in non-treated (panel A) versus smaller and less coherent colonies in indomethacin-treated (panel B) cells.

Cell cycle analysis. TT cells (106 cells/well) exposed to the 3 NSAIDs for 4 days were used for cell cycle analysis. Cell population in G0, G1, and S phases was analyzed by flow cytometry. The results are mean ± SD of triplicate samples of one of the 3 representative experiments. ANOVA and Dunnett 2-tail tests were used to analyze the statistical difference of S phase cells or G0–G1 cells between control and treated samples. There was a significant reduction of S phase cells by indomethacin treatment when compared with the control samples (* P < 0.01). Cells in S phase were increased by naproxen and indomethacin-ester treatment. Cells in G0–G1 phase did not differ between control group and indomethacin-treated group by the Dunnett 2-tail test. However, when a pair of S phase cells and G0–G1 cells is compared between the control group and indomethacin-treated group by the Scheffe test, there was a significant difference between the two groups (P < 0.01).

Protein expression of total Rb and pRb with or without indomethacin. Cells were exposed to 0 to 200 μM indomethacin for 48 hours and 96 hours. Cells were sonicated and used for protein electrophoresis and subsequent Western blot. Control sample (lane 1) did not contain indomethacin. Western blot results are one of the representative samples of three different experiments. Relative level of protein expression was calculated using a Bio-1D software (Bio-Rad), and the results are shown as bar graphs (mean ± SD of triplicate experiments). ANOVA and Dunnett 2-tail tests were used for statistical analysis. Rb/β-actin ratios for control sample and indomethacin-treated sample at 48 and 96 hours did not differ. pRb/β-actin ratios in indomethacin-treated cells at 48 hours and 96 hours are significantly lower than that of control samples (P < 0.01).
Footnotes
This publication is supported by VA Merit Review Research Grant (MS).
Acknowledgements
We thank Miss Leanne Streja for statistical analysis of our data.