
Abstract
The extraocular muscle (EOM) suffers much less injury from Duchenne muscular dystrophy (DMD) than other skeletal muscles such as diaphragm and gastrocnemius. The present study was undertaken to test the hypothesis that differential expression of regulatory proteins between the EOM and other skeletal muscles is responsible for the observed difference in the sensitivity to DMD-associated damage. Protein expression in the tissue samples obtained from EOM, diaphragm or gastrocnemius of C57BL/6 mice was analyzed by two-dimensional gel electrophoresis and mass spectrometry. There were 35 proteins that were identified to be differentially expressed among different skeletal muscle tissues. Among the 35 proteins, a fast skeletal muscle isoform myosin light chain 1 (MLC1f) protein was further studied in relation to muscle cell proliferation. The EOM-derived myoblasts had much lower levels of MLC1f and higher rate of cell proliferation in contrast to the myoblasts derived from diaphragm or gastrocnemius, which displayed a higher expression of MLC1f along with a slow proliferation. Deletion of MLC1f using siRNA targeting MLC1f resulted in an increased rate of cell proliferation in the myoblasts. Cell cycle analysis revealed that MLC1f inhibited the transition of the cell cycle from the G1 to the S phase. Therefore, the present study demonstrates that MLC1f may negatively regulate proliferation of myoblasts through inhibition of the transition from the G1 to the S phase of the cell cycle. Low levels of MLC1f in myoblasts of EOM may ensure cell proliferation and enhance the repair process for EOM under the DMD disease condition, thus making EOM suffer less injury from DMD.
Introduction
Early in embryonic development, muscle stem/precursor cells, so called myoblasts, are formed through myogenic determination (1, 2). These cells proliferate and eventually differentiate into myotubes. At birth, the terminally differentiated myofibers will no longer divide. But the myogenic precursor cells, which are situated beneath the basal membrane of muscle fibers and known as satellite cells, remain in their proliferating phase and are responsible for postnatal muscle growth and repair (3, 4). In adult muscle, the satellite cells enter the quiescent phase and they only become activated and proliferate under some abnormal or pathological conditions, such as muscle trauma and muscle diseases (5–7). Ultimately, the progeny of activated satellite cells, myoblasts, undergo terminal differentiation and fuse to myotubes to repair damaged muscle fibers (8, 9).
Under the same pathological conditions, skeletal muscles in different tissues may respond differentially. It has been known that the extraocular muscles (EOMs) are clinically and anatomically spared in the muscle degenerative disease, Duchenne muscular dystrophy (DMD), a debilitating X-linked muscle disease, primarily caused by the absence of dystrophin, leading to the disruption of the dystrophin-associated glycoprotein complex and substantial changes in skeletal muscle function (10, 11). In contrast, the skeletal muscles in the diaphragm suffer from severe damage due to a widespread necrosis under the DMD condition (12–14). Compared with other skeletal muscles, EOMs are significantly different in their developmental, morphological, and physiological properties. It has been hypothesized that the high expression of a homologue/ isoform of dystrophin, i.e., dystrophin-related protein(s), in EOMs can compensate for the mutated dystrophin (15, 16). However, this hypothesis has been challenged (17, 18).
Using microarray analysis, Porter and colleagues have shown that the general mechanisms in DMD are highly conserved, and that muscle group-specific transcriptional profiles contribute to the muscle response to muscular dystrophy (14). Another study by Fisher et al. has identified a specific expression pattern of a series of genes related to myogenesis, stem cells, and apoptosis in EOMs, and concluded that efficient and continuous regeneration may contribute to the EOM sparing in DMD (19). In support of this conclusion, an earlier study has demonstrated that EOM satellite cells have higher potential of proliferation (20).
Recent studies using proteomics approach have further demonstrated differential expression of proteins in the skeletal muscles in different tissues under the disease condition of DMD (21–24). However, these studies have not defined the cause-effect relationship between the differential expression of proteins and the sensitivity or resistance of some muscles to the DMD-associated damage. In the present study, we used the proteomics approach to determine differential expression of proteins in myoblasts obtained from EOM, diaphragm and gastrocnemius in mice. We further determined the relationship between the differentially expressed proteins, focusing on a fast skeletal muscle isoform myosin light chain 1 (MLC1f) protein, and muscle cell proliferation. The results demonstrated that MLC1f expression is reversely related to the proliferation of muscle cells and low levels of MLC1f in the EOM are likely responsible at least in part for the high proliferating rate of the EOM cells.
Materials and Methods
Preparation of Mouse Muscle Tissues.
Animal experiments were carried out following the Guidelines of the Institutional Animal Care and Use Committee of Sichuan University. Male C57BL/6 mice, 12 weeks old, were euthanised by cervical dislocation. The EOM, diaphragm and gastrocnemius muscles were immediately removed and washed with ice-cold PBS, then stored in liquid nitrogen until use.
Cell Culture.
Mouse skeletal muscle cell line C2C12 was maintained in DMEM with 10% FBS (HyClone). Primary myoblasts from EOM, diaphragm and gastrocnemius muscles of 3-week-old C57BL/6 mice were cultured using a modified preplate technique (25). Briefly, after being excised, muscles were minced into a coarse slurry and incubated in a mixture of 0.2% collagenase-type I and 2.4 units/ml dispase at 37°C for 1 h. The cells were centrifuged and resuspended in growth medium (DMEM containing 20% FBS and 100 U/ml penicillin and 100 μg/ml streptomycin). First, the cells were plated in 6-well plates for 2 h (preplate 1 or pp1). Then, the nonadherent cells were transferred to other wells (pp2). After 48 h, the floating cells in pp2 were collected and plated in new wells (pp3). The adherent cells in pp3 were obtained after 48 h. The pp1 and pp2 cells were discarded because they contained nonmyogenic cells (25, 26). The pp3 cells were cultured in growth medium at 37°C in a humidified incubator with 5% CO2 and underwent the passage process. The passage 1 cells were used in the following experiments.
siRNA Transfection.
Oligonucleotides encoding MLC1f-siRNA and Ncontrol-siRNA (negative control siRNA) were commercially synthesized by Ribobio (Guangzhou, China). The target sequence for MLC1f (NM_021285) siRNA was 5′-GAGAGAAGAUGAAG-GAGGA-3′. Ncontrol-siRNA sequence was 5′-UUCUCC-GAACGUGUCACGU-3′. Cells were transfected with MLC1f-siRNA (40 nM final) or Ncontrol-siRNA (40 nM final) using Lipofectamine 2000 (Invitrogen). Lipofectamine 2000 without the oligonucleotides was used as the control. Forty-eight hours following transfection, cells were collected and prepared for RT-PCR and Western blot analysis.
Proliferation Assay and Cell Cycle Analysis.
Myoblasts from EOM, diaphragm and gastrocnemius were seeded at about 4,000 cells/cm2 in 96-well plates. The cells were continuously counted every day for seven days. To demonstrate the effect of MLC1f on muscle cell proliferation, C2C12 cells and myoblasts from EOM, diaphragm and gastrocnemius were seeded at about 8,000 cells/cm2 and 10,000 cells/cm2, respectively, and cultured overnight in the growth medium. MLC1f-siRNA (40 nM final) was then added to the cultures. The cell number was determined by hemocytometer and the methylene blue assay (27) at 0, 1, 2, and 3 d. To investigate the effect of MLC1f-siRNA on the cell cycle, C2C12 cells transfected with siRNA for 48 h were collected and fixed in 70% ethanol. Then cells were stained with 50 μg/ml propidium iodide (Sigma) and assayed by flow cytometry (Coulter, EPICS ELITE ESP model).
Synchronization Analysis.
To investigate the difference in cell cycle distribution and transition between myoblasts derived from different muscle tissues, synchronization at the G1/S boundary was performed as described by Chen (28). Briefly, myoblasts were plated on the coverslips at about 13,000 cells/cm2 and maintained overnight in the growth medium. After being washed with PBS, cells were switched to DMEM with 1% FBS. After 36 h, the media was replaced with DMEM containing 1% FBS and 1 mM hydroxyurea and the culture was incubated for another 14 h. After being released from synchronization by washing off hydroxyurea and addition of the growth medium, myoblasts were pulsed with 0.1 mM BrdU for 15 min at 0, 1, 2, 4, 6 and 8 h, then fixed and immunostained for BrdU as described previously (29).
2D Gel Electrophoresis and Protein Identification.
The EOM, diaphragm and gastrocnemius muscles excised from ten C57BL/6 mice were pulverized under liquid nitrogen into a fine powder using a pestle and mortar. The resulting powder was collected, homogenized in lysis buffer (8 M urea, 4% CHAPA, 20 mM Tris, 60 mM DTT, 1 mM PMSF), ultra-sonicated on ice and centrifuged at 40,000 g at 4°C for 40 minutes. Supernatant was harvested and protein concentration of each sample was determined using the Bradford assay (Bio-Rad). The protein samples were stored in aliquots at −80°C.
2D gel electrophoresis was performed with the Ettan IPGphor system and Ettan DALTsix vertical gel electrophoresis system (Amersham Biosciences) as described previously (30, 31). Briefly, one milligram of total proteins was applied to an immobilized pH gradient (IPG) strip (180 mm, pH3–11 nonlinear, Amersham Biosciences) and run with isoelectric focusing (IEF) method. The second dimension of SDS-PAGE was carried out on a 12% polyacrylamide gel. Triplicate gels for each sample were visualized with Coomassie Blue G250 (Bio-Rad) and the images were recorded by an Image Scanner (Amersham Biosciences). The detection, quantification analysis and matching of protein spots were performed using Image-Master 2D Platinum Software v5.0 (Amersham Biosciences) according to Deniel et al. (32). To diminish the experimental variations caused by factors such as protein loading, the densities of the spots were determined after normalization based on the total spot volumes on the gel. To identify the differentially expressed proteins between EOM, diaphragm, and gastrocnemius tissues, every pairwise ratio (i.e., EOM/diaphragm, EOM/gastrocnemius, diaphragm/ gastrocnemius) was calculated. The protein spots of one tissue showing at least 3.0-fold changes in densities compared with both of the other two tissues (Student’s t test, P ≤ 0.05) were selected. The selected spots were excised from gels and extracted by in-gel digestion as described previously (30). Then peptide mixtures were analyzed using a Bruker-Daltonics AutoFlex MALDI-TOF/ TOF LIFT mass spectrometer (Bruker). The protein identification was carried out using the MASCOT search engine (http://www.matrixscience.com; Matrix Science, London, UK) against the NCBI nonredundant protein database. For those protein spots that could not be identified by MALDI-TOF MS, peptide mixtures were analyzed with a LTQ Orbitrap mass spectrometer (Thermo Finnigan, San Jose, CA, USA) equipped with an electrospray interface and operated in positive ion mode. Peptides and proteins were identified using Bioworkers Software (Thermo Finnigan), which uses the acquired MS/MS spectra to search against the IPI mouse database. The protein identification criteria were based on Dalta CN (≥0.1) and SEQUEST cross-correlation value (one charge ≥ 1.9, two charges ≥ 2.2, three charges ≥ 3.75).
RT-PCR Analysis.
Total RNA from mouse tissues and cells was isolated by using an RNAprep Tissue/Bacteria kit (TIANGEN) and TRIzol reagents (Invitrogen), respectively. After synthesis of the 1st strand of cDNA, the following primers were used for PCR: MLC1f (148 bp), 5′-TGCCCATGATGCAAGCTATCTC-3′ and 5′-ATCTTCT-CTCCCAGAGTGGCGA-3′; MLC1s (slow skeletal muscle/ventricular isoform myosin light chain 1) (197 bp), 5′-CCAAGAACAAGGA CACTGGCA-3′ and 5′-CGCT-TCATAGTTGATGCAGCC-3′; and GAPDH (191 bp), 5′-AACGACCCCTTCATTGAC-3′ and 5′-TCCACGA CAT-ACTCAGCAC-3′. The band intensity ratio of the specific gene to the internal standard (GAPDH) was used to represent the level of gene expression. To eliminate genomic DNA contamination, primers spanning an intron were used and reverse transcription reactions without reverse transcriptase were performed.
Western Blot Analysis.
Whole-cell proteins from mouse tissues or cells were resolved by SDS-PAGE on 12% acrylamide gels and transferred onto PVDF membranes (Boehringer Mannheim GmbH, Germany). The membrane blots were probed with mouse anti-MLC (Clone MY-21, Sigma; 1:800). Following incubation with HRP-conjugated anti-mouse IgG antibody (1:50000), blots were visualized with an ECL reaction (Pierce, Rockford, IL). Densitometric analysis was performed using the Quantity One 1-D analysis software (Bio-Rad).
Statistical Analysis.
Statistical analysis was performed using SPSS14.0. The significance between groups was determined by ANOVA. Statistical correlation between MLC1f gene expression and proliferation rate of the muscle cells was assessed by Pearson correlation coefficient analysis. All results are presented as mean ± SD.
Results
Identification of Differentially Expressed Proteins in EOM, Diaphragm and Gastrocnemius.
In the 2D gel analysis, more than 1500 protein spots were detected on each gel (Fig. 1A). Among the differentially displayed protein spots detected between the samples obtained from EOM, diaphragm and gastrocnemius, a total of 35 proteins or polypeptides were identified by MALDI-TOF-MS and LTQ-MS/MS. Table 1 summarizes the identification result of these 35 proteins. Seventeen of the identified proteins were expressed at lower levels in EOM as compared to those in diaphragm and gastrocnemius. Eleven proteins were expressed at higher levels in diaphragm relative to EOM and gastrocnemius, and seven proteins showed lower expression in gastrocnemius in comparison with EOM and diaphragm. Cytoskeleton and metabolism proteins accounted for most of these identified proteins. MLC1f and MLC1s were expressed at lower levels in EOM (Fig. 1B). To further validate the quantificational results of the spots obtained in gel image analysis, RT-PCR with primers designed specifically to amplify MLC1f and MLC1s and Western blot analysis with mouse monoclonal antibody to MLC protein were performed, and confirmed the data obtained from 2D gels (Fig. 1C).
Reverse Correlation Between Cell Proliferation and MLC1f Expression in Myoblasts.
We examined the proliferation of myoblasts derived from EOM, diaphragm and gastrocnemius tissues in mice. As seen in Figure 2A, the myoblasts derived from EOM, diaphragm and gastrocnemius all displayed three phases of proliferation. In the first two days, myoblasts proliferated slowly, followed by a higher rate of proliferation in the subsequent three days. Then the proliferation rate decreased and at day 7, most of the myoblasts fused to multinucleated myotubes, leading to cessation of cell proliferation. Compared with myoblasts derived from diaphragm and gastrocnemius, the EOM-derived myoblasts proliferated at a significantly higher rate at each time point.
We next examined the relationship between MLC1f and MLC1s expression and the rate of proliferation of the myoblasts. The myoblasts were harvested at varying time points (1, 3, 5, 7 d after seeding) to determine the expression of MLC1f and MLC1s by RT-PCR. As shown in Figure 2B, MLC1f mRNA was detected in all of the myoblasts, but the level of its expression was associated with the myoblast proliferation pattern. The level of MLC1f mRNA was higher at day 1 and decreased at day 3, reversely correlating with the initial cell proliferating pattern. From day 3 to day 7, the MLC1f expression was elevated progressively, which reversely correlated with cell proliferation from exponential phase to cessation. Furthermore, MLC1f expression in the EOM-derived myoblasts, which have much higher rate of cell proliferation, was much lower relative to both diaphragm- and gastrocnemius-derived myoblasts at each time point. Interestingly, MLC1s mRNA was not detected in any of these myoblasts. In agreement with this observation, previous studies have proposed that Myl1s is not expressed during myogenesis in vitro and can be detected only in mature skeletal muscles (33, 34). To determine the possible relationship between the levels of MLC1f and cell proliferation, statistical correlation between MLC1f mRNA expression and cell proliferation rates was performed with the Pearson correlation coefficient analysis. The result showed that MLC1f mRNA level was reversely correlated with the rate of muscle cell proliferation (Fig. 2C).
Suppression by MLC1f of Skeletal Muscle Cell Proliferation.
To test the function of MLC1f in cell proliferation, siRNA targeting MLC1f was used to inhibit the expression of MLC1f in the skeletal muscle-derived myoblasts and C2C12 cells. Cell proliferation was then determined in the MLC1f deletion cells in comparison with normal myoblasts in cultures. As shown in Figure 3, MLC1f-siRNA efficiently suppressed the MLC1f expression in these cells. After treatment with MLC1f-siRNA, the proliferation of skeletal muscle-derived myoblasts and C2C12 cells was significantly enhanced (Fig. 4A and B). It was also observed that the diaphragm- and gastrocnemius-derived myoblasts treated with MLC1f-siRNA proliferated even faster than EOM-derived myoblasts without MLC1f deletion (Fig. 4C and D). These results thus indicated that MLC1f suppresses myoblast cell proliferation.
Prevention by MLC1f of Cell Cycle Transition from G1 to S Phase.
To examine how MLC1f inhibits skeletal muscle cell proliferation, we examined the effect of MLC1f on the progression of cell cycle. The flow cytometry analysis of cell cycle distribution of asynchronous populations of C2C12 cells at 48 h after treatment with MLC1f-siRNA revealed that MLC1f deletion increased the percentage of cells in S phase and decreased the number of cells in G1 phase (Fig. 5A). To confirm this result, we monitored the cell cycle progression by synchronizing myoblasts at the G1/S boundary and then releasing the cells to S phase. The percentage of cells in S phase was determined by BrdU labeling. The results showed that within the first hour after being released, 12.29% of myoblasts derived from EOM entered S phase, but only 3.74% from diaphragm and 5.45% from gastrocnemius entered the S phase. The percentage of BrdU-positive cells of EOM-derived myoblasts peaked at 2 h, but that of diaphragm or gastrocnemius peaked at 4 h (Fig. 5B). These results thus indicated that MLC1f inhibits the transition of cell cycle from the G1 to the S phase.
Discussion
In this study we show that protein expression profiles differ in myoblasts obtained from different skeletal muscle tissues. In particular, we have identified 35 proteins that were differentially expressed in EOM, diaphragm and gastrocnemius tissues. Most of the identified proteins were expressed at lower levels in EOM compared with diaphragm and gastrocnemius, and cytoskeleton and metabolism proteins were the largest groups, implicating that these were related to the unique nature of EOM. Among these 35 proteins, MLC1f was of specific interest, in that the expression of this protein was reversely correlated with the rate of myoblast cell proliferation. This reverse correlation between MLC1f levels and cell proliferation was observed through comparison between the myoblasts derived from EOM and the myoblasts derived from diaphragm or gastrocnemius. The EOM-derived myoblasts had much lower levels of MLC1f and a higher rate of cell proliferation in contrast to the myoblasts derived from diaphragm or gastrocnemius, in which higher levels of MLC1f along with a lower rate of cell proliferation were observed. The cause-effect relationship between MLC1f expression and suppression of cell proliferation was determined by MLC1f deletion using the approach of siRNA targeting MLC1f. Deletion of MLC1f resulted in an increased rate of myoblast cell proliferation, thus demonstrating that MLC1f negatively regulates myoblast cell proliferation. Through the cell cycle analysis, we further defined that MLC1f inhibited the transition of cell cycle from the G1 to the S phase.
Upon the onset of myogenesis, muscle contractile protein gene expression is induced and the products are used to assemble the sarcomeric structures that allow contraction of the muscle cells (35, 36). MLC1f, the fast-muscle isoform of alkali light chain, is one of the muscle-specific contractile proteins and is associated with myosin heavy chain heads. It is generally believed that MLC1f, as other muscle specific contractile proteins, is synthesized during myogenesis (35, 37). However, some studies indicated that MLC1f gene expression may be activated before the onset of myogenesis. Studies by Lyons et al. showed that at an early stage of mouse embryo (9.5 days embryo) mononucleated myotomal cells have expressed MLC1f transcripts before they fuse to form multinucleated myotubes (38). Freshly isolated myoblasts in cultures are morphologically and biochemically undifferentiated. After dividing several times, mono-nucleated myoblasts exit from the cell cycle and undergo fusion to form multinucleated myotubes. Once the myotubes are formed, cell proliferation stops. The expression of MLC1f was lower in exponentially proliferating myoblast cells in cultures, but significantly increased in the myotubes. Importantly, when the slow proliferating cells were treated with siRNA targeting MLC1f, they displayed a fast rate of cell proliferation. Although the present study cannot settle the argument regarding when MLC1f is activated in the embryonic development, it would indicate that the expression of MLC1f inhibits cell proliferation and is associated with the formation of myotubes.
One of the interesting findings from this study is that MLC1f expression was lower in the myoblasts derived from EOM, which had a higher rate of proliferation in cultures in comparison with those derived from diaphragm or gastrocnemius. In DMD disease, EOM can escape from the injury effect, which has been ascribed to the high capacity of regeneration of EOM (19). The link defined in the present study between lower levels of MLC1f expression and higher rate of proliferation in the myoblasts derived from EOM would provide a partial explanation for the observed effect of EOM spared in DMD-induced damage. An additional evidence that indicates the link between MLC1f expression and the susceptibility of muscle damage in DMD is that in the myoblasts derived from diaphragm, the MLC1f expression was much higher and the proliferation rate was much lower relative to the myoblasts derived from EOM. Importantly, as deletion of MLC1f by RNA interference in the myoblasts derived from diaphragm, the proliferating rate was significantly increased and even much higher than that in the myoblasts derived from EOM.
Unlike those of other skeletal muscles, myoblasts derived from EOM require a very short time period for activation and division (20). In the present study, we have obtained evidence to explain this observation. In the cell cycle analysis study, we have found that MLC1f deletion increased the number of cells in the S phase and decreased the number in the G1 phase in C2C12 cells in cultures. When the cultured myoblasts derived from EOM, diaphragm or gastrocnemius were synchronized and followed by releasing from the synchronization, the myoblasts derived from EOM showed a fast rate of transition from the G1 phase to the S phase and a much higher percentage in the S phase than those derived from either diaphragm or gastrocnemius. Therefore, high levels of MLC1f suppress the transition of cell cycle from the G1 to the S phase.
The important finding of this study is that MLC1f negatively regulates cell proliferation in myoblasts through suppression of the transition of cells from the G1 to the S phase. However, there is a limitation in this study. That is, the exact mechanism by which MLC1f suppresses the transition from the G1 to the S phase is unknown. It is presumable that MLC1f might negatively regulate the signaling cascade associated with one or more of the cell cycle control proteins, such as Cdk and p21, or MLC1f might directly interact with these cell cycle control proteins to exert its negative regulatory action. This remains to be determined.
In summary, our results demonstrate that MLC1f may be a negative regulator of muscle cell proliferation. MLC1f regulates cell proliferation by inhibiting the transition of cell cycle from the G1 to the S phase. Elucidation of the molecular mechanism by which MLC1f intervenes with the cell cycle progression will help us to understand the function of MLC1f in myogenesis, which is the direction of our future study.
Supplemental Data.
The supplemental data include three figures and are available in the online version of the journal.
The Proteins Identified by MALDI-TOF-MS and LTQ-MS/MS from Extraocular Muscle, Diaphragm and Gastrocnemius Tissues a

Identification of proteins differentially expressed between EOM, diaphragm and gastrocnemius. (A) 2D electrophoresis patterns of whole-cell proteins extracted from EOM, diaphragm and gastrocnemius of the C57BL/6 mouse. Two kinds of proteins with different expression patterns are indicated. (B) The levels of MLC1f and MLC1s were much lower in EOM. (C) RT-PCR results of MLC1f and MLC1s and Western blot results of MLC (1: EOM; 2: Diaphragm; 3: Gastrocnemius). The ratios determined by proteomics of EOM/Diaphragm (E/D), EOM/ Gastrocnemius (E/G) and Diaphragm/Gastrocnemius (D/G) are presented to the right.
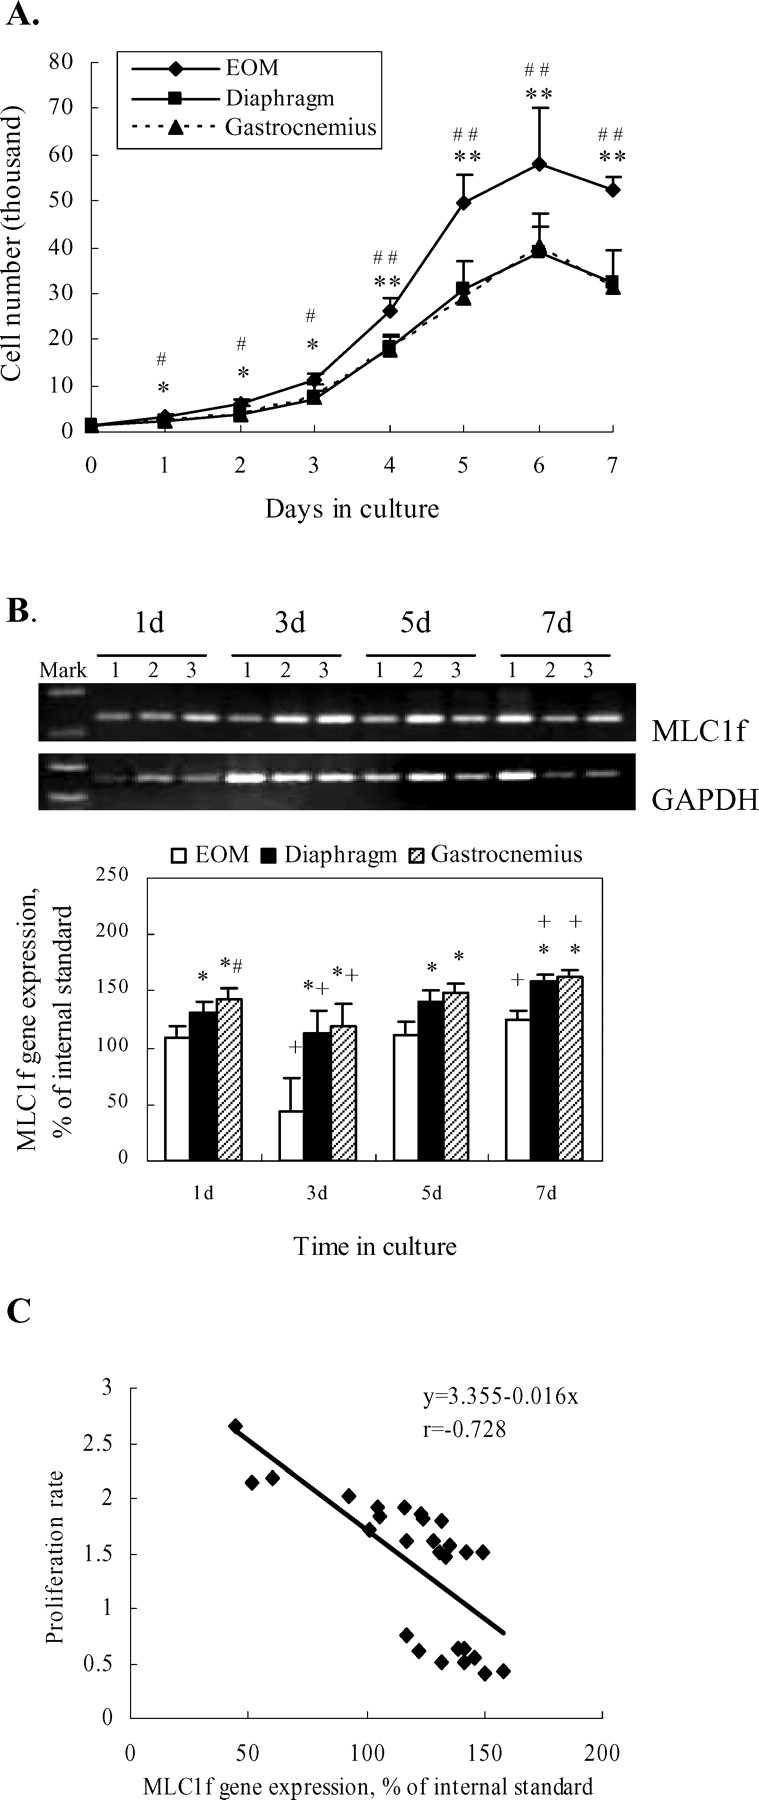
The relationship of cell proliferation and the levels of MLC1f gene expression. (A) Proliferation curves. Proliferation rates of myoblasts from EOM, diaphragm and gastrocnemius were determined by cell counting. Experiments were performed in quadruplicate, and three independent experiments were done. * P < 0.05, ** P < 0.01 (EOM vs Diaphragm); # P < 0.05, ## P <0.01 (EOM vs Gastrocnemius). (B) Expression of MLC1f and MLC1s genes in the skeletal muscle-derived myoblasts (1: EOM; 2: Diaphragm; 3: Gastrocnemius) at various time points. Gene expression was calculated as the percentage of analyzed RT-PCR products to GAPDH (mean ± SD from three independent experiments with proliferation assay samples). MLC1s amplifications were not detected at the same time. * P < 0.05 vs EOM and # P < 0.01 vs Diaphragm at the same time point; + P < 0.05 vs 1 d and 5 d. (C) Correlation of the levels of MLC1f mRNA with the proliferation rates of the myoblasts from skeletal muscles. The levels of MLC1f mRNA at three time points were expressed as described in Figure 2B. The proliferation rate of the myoblasts was expressed as the rate of cell doubling during three time periods (i.e., 1 d to 3 d, 3 d to 5 d and 5 d to 7 d in Fig. 2A), and expressed by the formula: R n = (N n+2/N n )/2. R stands for rate; N for cell number; n for 1, 3, or 5 d. The rates were measured from three independent experiments. The statistical correlation was determined by Pearson Correlation Coefficient analysis (P < 0.01, r =−0.728).
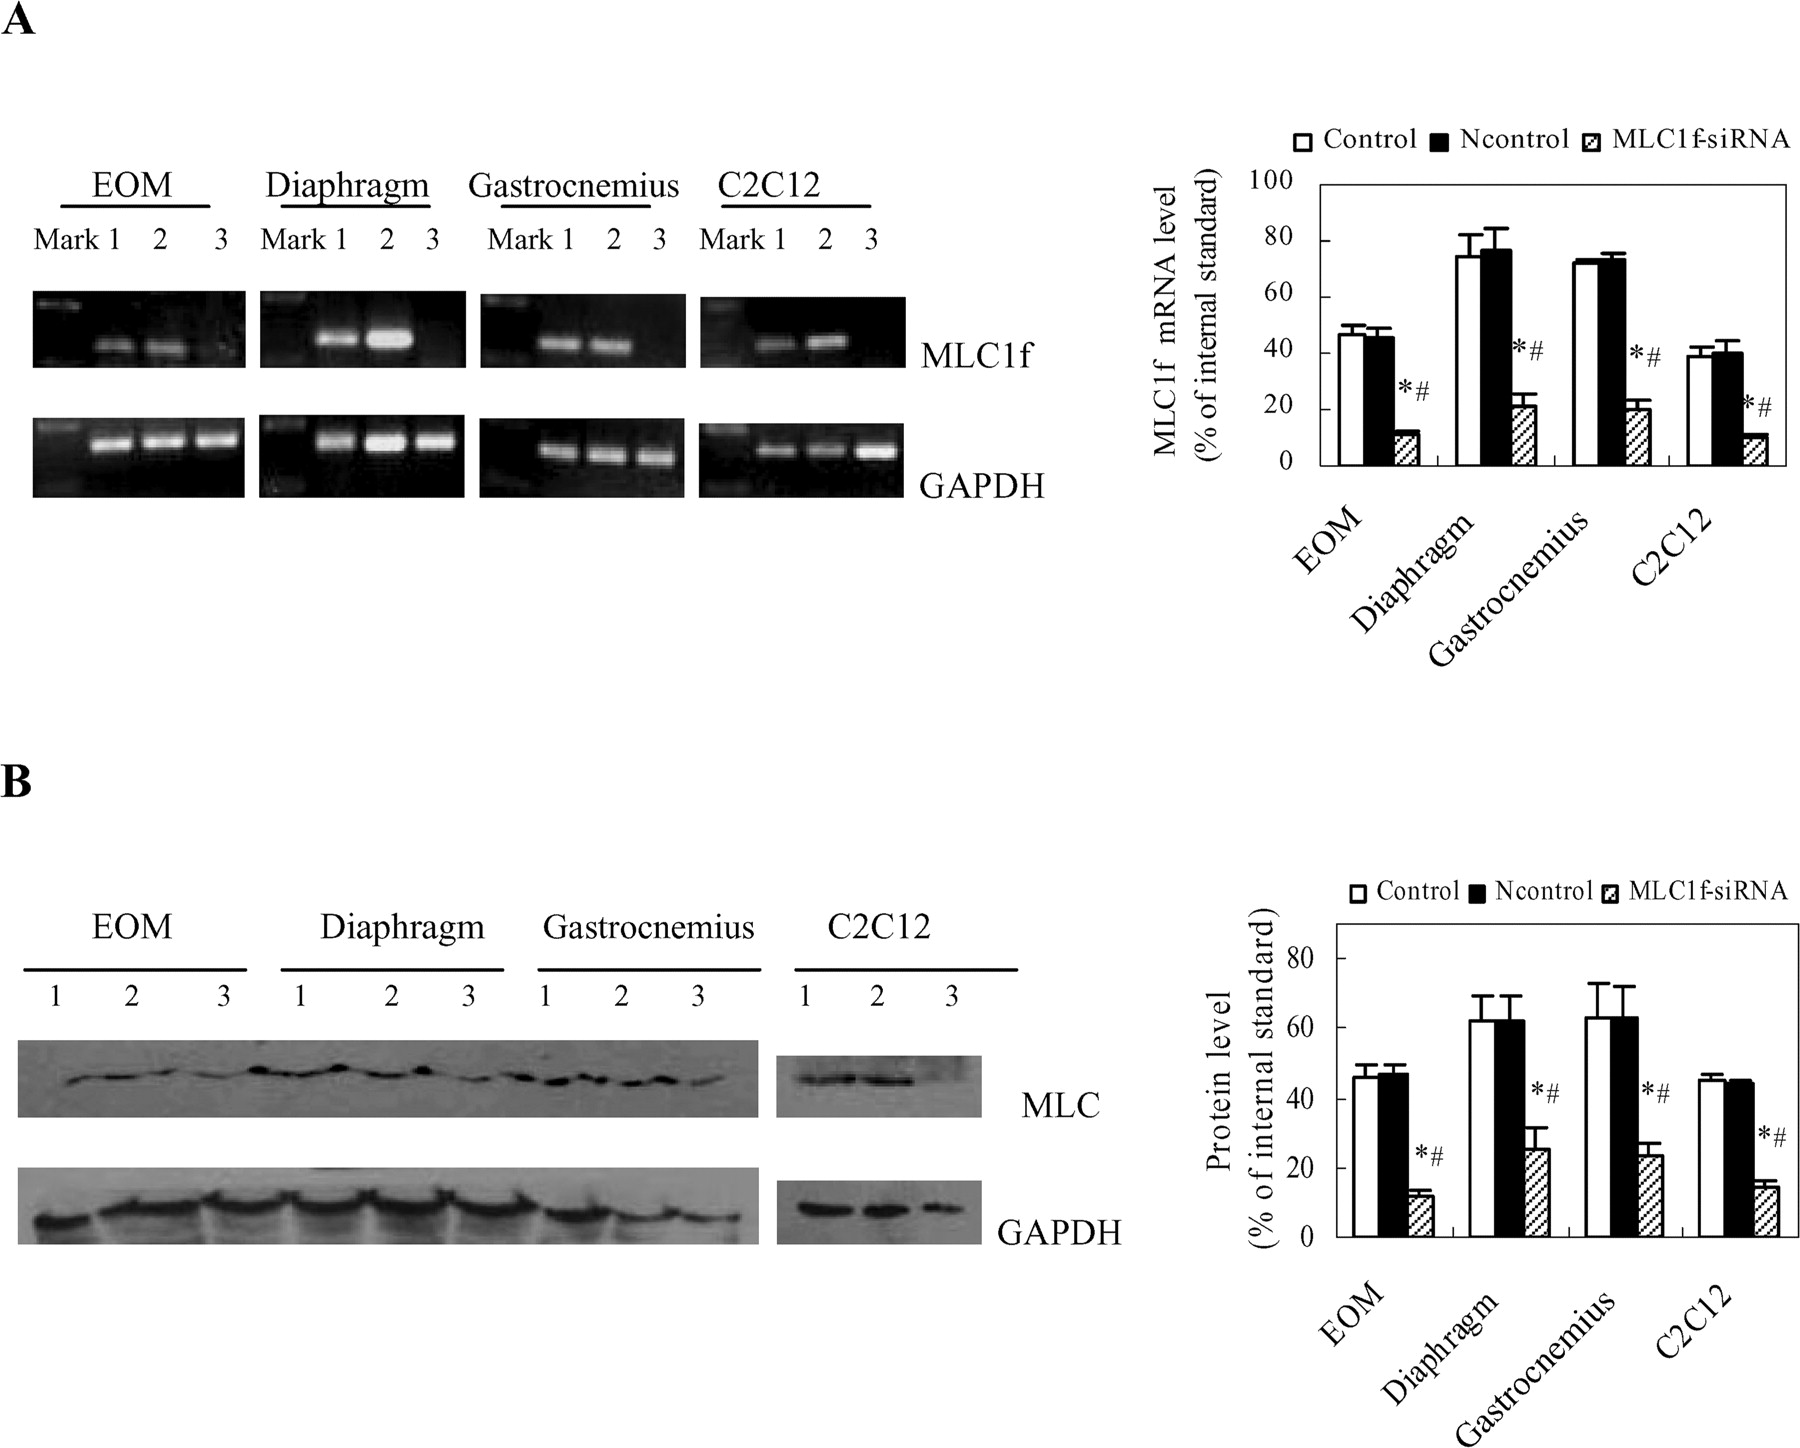
The mRNA level and the protein level of MLC in myoblasts and C2C12 cells after MLC1f siRNA transfection. (A, B) Cells were transfected with MLC1f siRNA (40 nM final) or Ncontrol-siRNA (40 nM final) using Lipofectamine 2000. The vehicle alone was used as the control. After 48 h, cells were collected and prepared for RT-PCR and Western blot analysis (1: Control; 2: Ncontrol; 3: MLC1f-siRNA). * P < 0.01 vs Control; # P < 0.01 vs Ncontrol.

Increase in proliferation with lower levels of MLC1f. (A, B) Skeletal muscle-derived myoblasts and C2C12 cells were plated in 96-well plates. After overnight incubation in the growth media, MLC1f siRNA (40 nM final) was added. Cell counting by hemocytometer and the methylene blue assay was made at the indicated time points. The assays were performed in quadruplicate and the data were expressed as mean ± SD from three independent experiments. * P < 0.05, ** P < 0.01 vs Control; # P < 0.05, ## P < 0.01 vs Ncontrol. (C, D) Comparison in cell proliferation between diaphragm (D)- and gastrocnemius (G)-derived myoblasts treated with MLC1f siRNA and EOM (E)-derived myoblasts without MLC1f siRNA treatment. * P <0.05, ** P <0.01 vs EOM control.

Lower expression of MLC1f facilitates the transition from the G1 to the S phase of cell cycle in the myoblast. (A) C2C12 cells were treated with 40 nM MLC1f siRNA for 48 h and analyzed by flow cytometry. The assays were performed in duplicate. * P < 0.01 vs Control; # P < 0.01, # # P < 0.05 vs Ncontrol. (B) The culture of myoblasts grown on coverslips overnight was switched to 1% serum containing medium for 36 h, then switched to 1% serum and 1 mM hydroxyurea containing medium. After incubation for another 14 h the myoblasts were synchronized at the G1/S boundary. The myoblasts were released and monitored for the transition to the S phase by switching them to the growth medium and pulsed with BrdU for 15 minutes at 0, 1, 2, 4, 6 and 8 h. Myoblasts on the coverslips were fixed and immunostained for BrdU. The percentages of BrdU-positive cells were obtained from at least 500 cells in each of three replicates, respectively. * P < 0.01, EOM versus Diaphragm; # P < 0.01, ## P < 0.05, EOM versus Gastrocnemius.
Footnotes
This work was supported by the National Natural Science Foundation of China (30670734) and by the Science Foundation of Sichuan Province (042Q026-038).
1
These authors contributed equally to this work.
Acknowledgements
Special thanks are extended to Dr. Guang-Qian Zhou, Department of Orthopaedics and Traumatology, The University of Hong Kong, Hong Kong, PR China for his many suggestions.