
Abstract
Increased expression of PAI-1 is profibrotic in several organs. However, its potentially profibrotic effects in the heart subjected to infarction have not been elucidated. Accordingly, we induced coronary occlusion in 10-week-old mice congenic on a C57BL6 background and in mice overexpressing PAI-1 (PTG) in multiple tissues. Compared with C57BL6 control mice without myocardial infarction (MI), PTG mice exhibited consistently elevated PAI-1 in plasma at 16 weeks of age but virtually identical PAI-1 content in left ventricular (LV) myocardium. However, they exhibited a 2-fold increase in LV PAI-1 content 6 weeks after induction of MI (4.21 ± 1.0 ng/ml tissue protein) compared with that in C57BL6 mice (2.04 ± 0.5, P < 0.05). In 16-week-old mice, ultrasonically delineated LV fractional shortening (FS) was comparable in normal PTG and normal C57BL6 controls. However, 6 weeks after MI, PTG (n = 21) compared with C57BL6 (n = 14) mice exhibited markedly thinner LV posterior walls in both diastole (C57BL6 0.79 ± 0.05 mm, PTG 0.55 ± 0.06, P < 0.05) and systole (0.97 ± 0.05 mm, 0.75 ± 0.06, P < 0.05); increased end systolic LV dimensions (4.54 ± 0.2 mm, 5.17 ± 0.2, P < 0.05); and significantly depressed FS, more impaired LV segmental function, and greater mitral E wave amplitude. Compared with fibrosis assessed by Masson staining of sections from apex to base in C57BL6 mice (10.85 ± 0.43% LV area), PTG mice exhibited 33% more LV fibrosis after MI (P < 0.05). Thus, PAI-1 is profibrotic in the heart subjected to infarction. Accordingly, overexpression of PAI-1 is a promising target for attenuation of heart failure after MI that may be exacerbated by fibrosis.
Introduction
Conditions such as type 2 diabetes and insulin resistance accompanying obesity are associated with altered expression of plasminogen activator inhibitor type-1 (PAI-1) in patients (1, 2) and in the hearts of mice subjected to myocardial infarction (MI) (3). Increased PAI-1 expression predisposes to fibrosis in several organs and tissues (4–15), but the direct effects of cardiac overexpression of PAI-1 have not been characterized to the best of our knowledge. Furthermore, an obverse phenomenon, namely, an apparent antifibrotic effect of PAI-1 in the heart has been reported (16). The impact of fibrosis on cardiac function is complex and robust (17). In view of the conflicting findings regarding potentially profibrotic effects of PAI-1 on the heart, the present study was performed to determine whether increased cardiac expression of PAI-1 in the heart in response to injury is profibrotic in the heart and whether it influences subsequent cardiac function in transgenic mice subjected to MI.
PAI-1 expression is increased in perivascular regions manifesting fibrosis in mice genetically rendered obese and insulin resistant (18), and altered PAI-1 expression in the heart has been implicated in altered cardiac function associated with insulin resistance after coronary occlusion (3). We wished to determine whether increased cardiac expression of PAI-1 response to injury of the heart, independent of any increase in PAI-1 under basal conditions and of other conditions with which it may be associated, affects the extent of fibrosis, ventricular function, or both after MI. Accordingly, we subjected otherwise normal transgenic mice that overexpress PAI-1 and congenic C57BL6 control mice to coronary occlusion.
Materials and Methods
Experimental Animals.
Transgenic mice overexpressing murine PAI-1 (PTG) under control of the adipocyte promoter aP2 provided by Dr. H. Roger Lijnen were bred to congenicity on a C57BL6 background. They overexpress PAI-1 in diverse tissues but not in the normal heart (19). Animals were used in conformity with a protocol approved by the University of Vermont Institutional Animal Care and Use Committee (IACUC 08–072) and with adherence to the NIH Principles of Animal Care. Verification of the presence of the PAI-1 transgene was confirmed by genotyping and by assay of PAI-1 in plasma by ELISA as previously described (3). At 10 weeks of age, PTG and control C57BL6 mice were subjected to either sham operation (controls) or coronary occlusion with induction of MI as previously described (3).
Measurement of Blood Pressure.
Blood pressure was measured in PTG and C57BL6 controls with the use of a CODA 2 Non-Invasive Mouse Rat Blood Pressure System (Kent Scientific Corporation, Torrington, CT). The non-invasive blood pressure system employs a cuff placed on the tail of the mouse to transiently occlude blood flow. Following deflation of the cuff, a volume pressure recording (VPR) device permits quantification of blood pressure. The VPR was used to measure systolic, diastolic and mean blood pressure.
Surgical Procedures.
Acute MI was induced following coronary occlusion implemented as previously described (3). The procedure entails ligation of the left anterior descending (LAD) (technically the middle left) coronary artery 2 mm below the tip of the left atrium in mice anesthetized with 4% isoflurane. Ischemia was confirmed visually by detection of blanching of left ventricular (LV) myocardium below the suture and in some mice by exclusion of Evans blue dye from the infarct zone after intracavitary LV injection through the apex of 0.5 ml of 1% Evans blue dye in phosphate buffered saline (PBS).
Ultrasonic Imaging of Mouse Hearts In Vivo (Echocardiography).
Two-dimensional (2D), Doppler and M-Mode echocardiography was performed on control C57BL6 and PTG mice at 16 weeks of age that had not been subjected to MI and on C57BL6 and PTG mice 6 weeks after induction of MI, as previously described (3). A functional assessment of 13 segments patterned after the American Society of Echocardiography 17 segment model was performed as follows: each short axis view segment was scored based on systolic wall thickening (1 = normal, > 25%; 2 = hypokinetic, 10–25%; 3 = akinetic, <10%). Normal function of all segments yielded a score of 13 with each quadrant of each short axis view at apical, midpapillary muscle, and basal levels providing 4 segments for analysis and the apex providing the 13th segment. Echocardiographic scores were determined independently by two observers, each masked with respect to estimates of infarct size, echocardiographic results obtained by the other observer, and genotypes of the animals imaged.
LV diastolic function was assessed by measurement of E and A wave ratio seen with transmitral inflow and by measurement of LV isovolumic relaxation time (IVRT) after visualization of mitral and aortic valve flow. Care was taken to obtain Doppler measurements such that the E and A waves were separated optimally and such that the E wave recorded was a maximum. The presence of a negative aortic outflow signal was visualized to ensure that interrogation of mitral inflow was coaxial.
Processing of Tissue for Histology.
After completion of echocardiographic studies the mice were killed humanely by exsanguination, and the heart was excised, rinsed with PBS and gently freed of gross fat. Following fixation in 3% fresh formaldehyde in 0.01 M phosphate buffer, the LV was excised, rinsed with PBS, cut transversely in half through the mid portion of the infarct zone, and embedded in paraffin. Serial sections, 8 μm thick, were cut from each of the two halves such that the entire LV was sectioned from the apical surface to the base.
Histologic Assessment of Fibrosis.
Fibrosis was assessed by Masson trichrome staining in every tenth 8 μm thick serial section (20). Color images of entire cross section of LV were captured at ×24 magnification with the use of an Olympus BX50 upright light microscope (Olympus America, Lake Success, NY) with an attached Optronics Magna-Fire digital camera (Optical Analysis, Nashua, NH) and associated MagnaFire software (version 2.0). The captured images were displayed in 1280 × 1024 pixel size and in 24-bit color format. Computer-assisted processing and quantitative analysis of processed images were performed with the use of MetaMorph Software (Universal Imaging Corp., Downingtown, PA). Total area of fibrosis and total LV area (area of connective tissue plus the myocyte area in the entire visual field of the section) were measured separately, and the percentages of area of fibrosis in the LV sections were calculated as follows: area of fibrosis/(area of total connective tissue +myocyte area) × 100. The intra-observer and interobserver variability of results with this software in our laboratory averaged 1.16 ± 0.34 and 1.43 ± 0.33 (SE) %, respectively. We elected to use a morphometric assessment of fibrosis within intact zones of infarction rather than a biochemical assessment of total LV fibrosis, such as assay of hydroxyproline in whole left ventricular extracts, because negative remodeling 6 weeks after MI in mice is extensive. It results in extensive wall thinning and reflects degradation of diverse constituents including fibrous tissue that could mask regional increases in fibrosis evident morphometrically.
Assessment of the Extent of Infarction.
The extent of infarction in mice can be determined with diverse methods including histological analysis or histochemical determinations with dyes such as triphenyltetrazolium chloride. However, inaccuracies may occur with these methods because of sampling bias, temporal-dependent changes in the evolution of histological and histochemical criteria, and factors influencing the activity of the dehydrogenases that interact with the dyes. Assessment of infarct size by assay of residual LV myocardial CK can avoid such limitations. This method permits simultaneous biochemical characterization of LV tissue that is precluded if infarct size is assessed by fixation of the entire LV and analysis of serial sections histologically or histochemically. Assessment by analysis of CK depletion calculated based on residual CK provides estimates that are not confounded by sampling bias. Loss of CK from the heart is tantamount to and directly reflective of the extent of infarction (21–26).
For these reasons we characterized infarct size in some of the hearts by analysis of LV CK depletion 6 weeks after the animals had been subjected to MI. The procedure includes excision of the entire left ventricle which is frozen in liquid nitrogen and homogenized with a Polytron (Ultra Turrax T25) after thawing in 5 mL-polypropylene tubes in 50 mM Tris, 5 mM dithiothreitol (DTT) chilled to 4°C with the pH adjusted to 7.6 with hydrochloric acid. After centrifugation of homogenates in a microcentrifuge at maximum speed for 20 minutes at 0–4°C, the supernatant fraction is aspirated and transferred to another tube for analysis.
CK assays were performed on the same day as homogenization to avoid the potential impact of oxidants present in the tissue on CK activity, as were protein (27) and PAI-1 assays. The extent of infarction (percent) was calculated based on observed total LV CK (IU/mg protein) in normal hearts. Maximum CK depletion in homogeneous zones of infarction was found to yield residual CK averaging 1.4 ± 0.1 IU/mg. Thus, percent infarction was calculated as = 100 × [NL CK - LV CK] / Δ, where NL CK is the amount of CK in normal LV tissue expressed as IU/mg of soluble protein, LV CK is total assayed CK activity in the LV after MI expressed as IU/mg of LV soluble protein, and Δ is the difference between the amount of CK in normal myocardium and that in the center of dense zones of infarction.
Assay of PAI-1 Protein.
Assays of PAI-1 in LV homogenates and in plasma were performed with the use of a murine PAI-1 ELISA kit (Innovative Research, Inc., Southfield, MI). LV myocardium was homogenized and samples prepared as described for assay of CK activity. Murine PAI-1 in each sample was allowed to react with capture antibody (a mouse monoclonal antibody against mouse PAI-1 raised in PAI-1 deficient mice) (28). The antibody is capable of binding free, latent, and complexed PAI-1. After washing, an anti-PAI-1 primary antibody (HRP-conjugated polyclonal anti-mouse PAI-1 raised in rabbits) was added. After additional washing, TMB, a reagent containing both hydrogen peroxide and tetramethylbenzidine in an aqueous buffer, was added to elicit development of color at 450 nm. The amount of color developed reflected the concentration of total PAI-1 in the sample.
Assays were performed at room temperature. Mouse heart homogenates were used in an undiluted state. Standard curves were obtained with the use of serial dilutions of standards. Reactions were terminated with the addition of 50 μl of 1 N sulfuric acid. Absorbance at 450 was read with a microplate reader.
Statistics.
Results were expressed as means ± SEM unless noted otherwise. Data were analyzed by ANOVA with orthogonal multiple comparisons with the use of an SAS program. Variables that did not meet the requirements of normality or homogeneity of variance were compared by means of the Kruskal-Wallis test. Significance was defined as differences with P ≤ 0.05.
Results
Blood Pressure, Body Weight, and LV Weight.
No significant differences in blood pressure were observed in the different groups of mice (Table 1). Body weight was similar in normal C57BL6 control and normal PTG mice. LV weight was not significantly different in mice in the two strains.
PAI-1 in Mice With or Without MI.
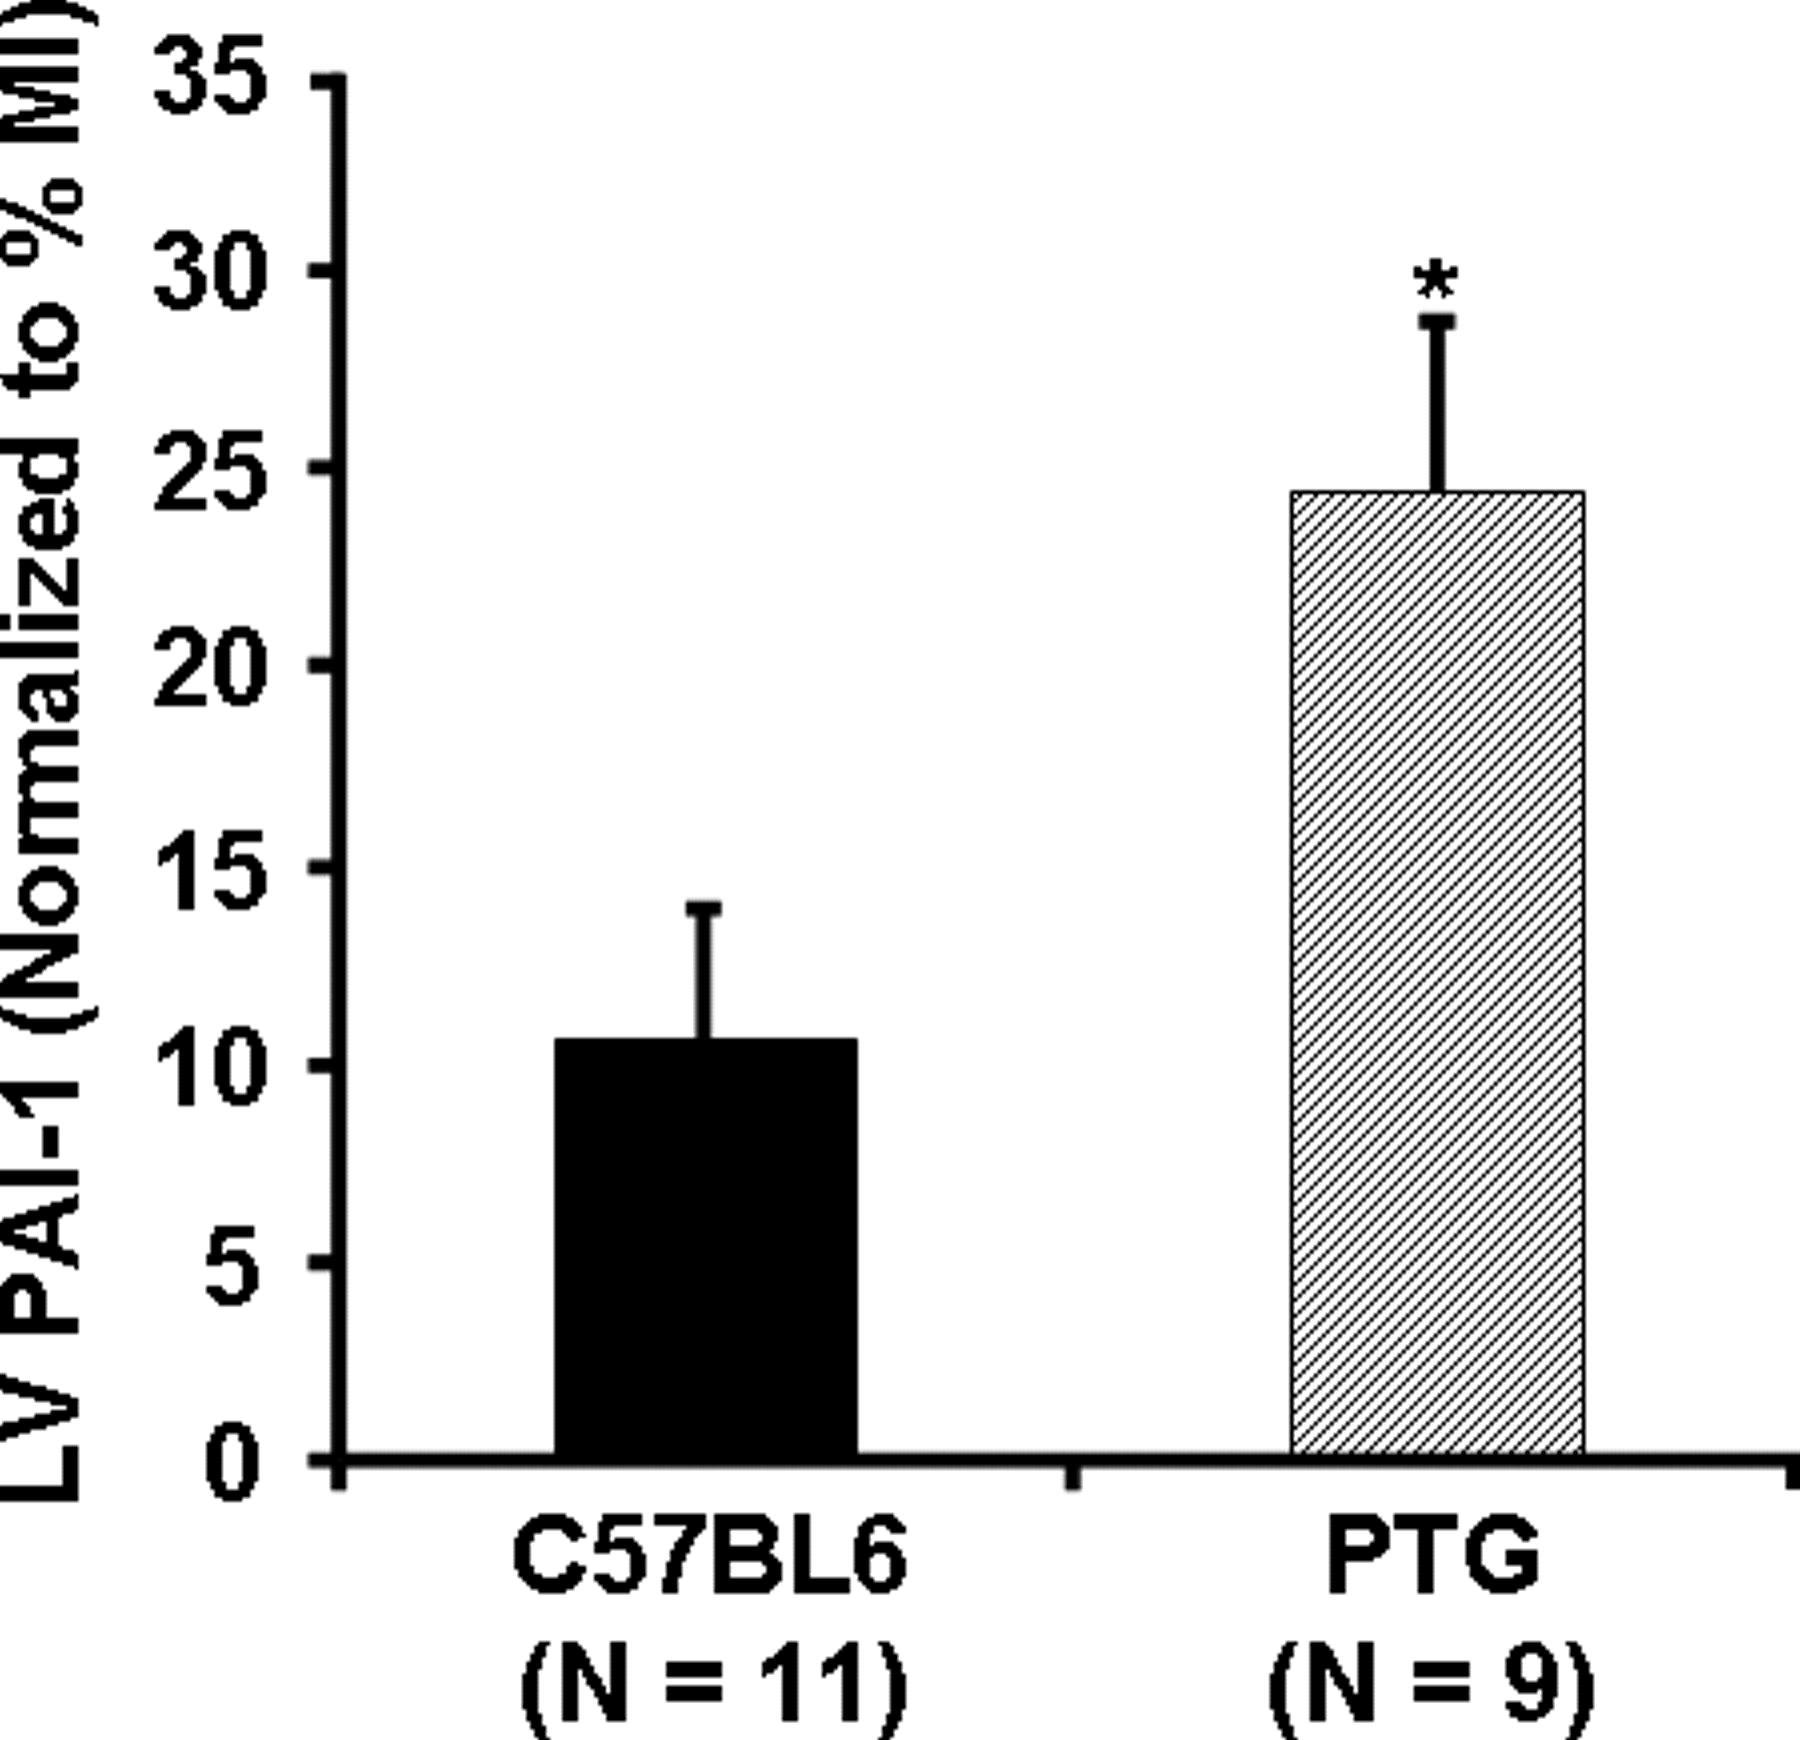
PTG mice with or without infarction exhibit consistently increased PAI-1 in plasma compared with that in C57BL6 controls and comparable PAI-1 in normal LV as observed by others (19). In our study, myocardial PAI-1 was comparable to that in controls and plasma PAI-1 was at least 5-fold greater in each case than the mean +2 SDs (1.41 +0.61 ng/PAI-1/ml, n = 11) of that in C57BL6 controls (Tables 2 and 3). However, our results indicated that 6 weeks after MI myocardial PAI-1 content in whole LV from the PTG mice increased (4.2 ± 1.0 ng/mg tissue protein) compared with that in PTG without MI (0.98 ± 0.12, P < 0.05). An increase was seen in C57BL6 mice as well (Table 3 and Fig. 1). Compared with C57BL6 mice subjected to MI, PTG mice exhibited an approximately 2-fold increase in myocardial PAI-1 content (Fig. 1). When PAI-1 content in the LV was normalized for infarct size as judged from myocardial CK depletion, the PAI-1 content in the PTG mice with MI was even more than 2-fold greater than that in C57BL6 controls (Fig. 2).
LV Function.
A representative M-mode echocardiographic recording and a PW Doppler Ultrasound tracing showing transmitral flow in control C57BL6 and PTG mice are shown in Figure 3. As shown in Table 4, echocardiography demonstrated marked differences in hearts of PTG compared with control mice. Six weeks after MI both C57BL6 and PTG mice exhibited significantly dilated left ventricles (increased LVEDD, LVESD) and markedly thinned anterior walls (DWTA and SWTA). Moreover, compared with C57BL6 controls 6 weeks after MI, PTG mice exhibited markedly thinner LV posterior walls in both diastole and systole and increased end systolic LV dimensions. Six weeks after MI PTG mice compared with controls exhibited significantly depressed fractional shortening (FS) (Fig. 4) and higher echocardiographic scores (Fig. 5) indicative of more impaired LV function and impaired wall thickening.
Results of assessment of diastolic function from PW Doppler Ultrasound recordings of transmitral flow are shown in Table 5. Abnormalities in diastolic function were observed in PTG mice at 16 weeks of age compared with C57BL6 mice that had not been subjected to MI as evidenced by significantly increased A wave amplitude, an altered E/A ratio, and increased IVRT. Six weeks after MI, significant differences in E and A wave amplitude and IVRT in C57BL6 and differences in A wave amplitude and E/A ratio in PTG were seen compared with results in mice of the same strain without MI. Transmitral E wave amplitude was greater 6 weeks after MI in PTG compared with results in C57BL6 mice.
The Extent of Infarction Reflected by Depletion of LV CK Activity.
LV CK activity in mice that had not been subjected to coronary occlusion was virtually identical in PTG (7.5 ± 0.1 IU/mg protein) compared with control mice (7.5 ± 0.1). Six weeks after MI, both PTG (6.5 ± 0.1) and C57 (6.3 ± 0.2) mice exhibited depletion of LV CK activity compared with that in respective normal mice. Though the difference was not significant, infarct size tended to be lower in hearts from PTG (16.9 ± 2.9% [SE] of LV) compared with control mice (19.4 ± 3.1%).
Delineation of Zones of Infarction with Evans Blue Dye.
Coronary occlusion in representative PTG and C57BL6 control mice resulted not only in immediate blanching of myocardium supplied by the ligated vessels but also in exclusion of vital dye from the infarct zone (Fig. 6).
Histological Assessments of the Extent of Fibrosis.
A total of 175 sections from hearts of C57BL6 controls (n = 8) and 199 from hearts of PTG (n = 11) mice were analyzed histologically to assess the total area of fibrosis in each section. Representative photographs of LV cross sections obtained from C57BL6 and PTG mice 6 weeks after MI are shown in Figure 7. Extensive remodeling and LV wall thinning are evident (blue color) in mice of both strains. Results are shown in Table 6. Although PTG mice exhibited modestly smaller infarcts, PTG mice exhibited significantly more LV fibrosis after MI compared with that in C57BL6 mice after MI. The LV circumference was also greater in the PTG mice consistent with greater LV dilatation.
Discussion
The results in the present study indicate that cardiac overexpression of PAI-1 in transgenic mice affects the heart in that it modifies the response to MI induced by coronary occlusion. In normal PTG mice, LV weight is greater though insignificantly despite comparable body weight, and LV end systolic dimensions are significantly greater compared with those in normal C57BL6 mice consistent with LV dilatation. Results of pulsed wave Doppler studies showed differences in transmitral valve A wave amplitude and the E/A ratio in the PTG mice compared with C57BL6 controls consistent with impaired diastolic function reflected also by a greater isovolumic relaxation time.
In the PTG mice compared with C57BL6 mice subjected to MI 6 weeks earlier, the LV end systolic dimension was greater, and wall thinning was evident as judged from the lower diastolic wall thickness and systolic wall thickness seen posteriorly. Furthermore, the echocardiographic score was greater, indicative of impaired systolic function with diminished wall thickening. Diastolic function was disparate as well with a greater transmitral valve E wave amplitude in the PTG mice.
These functional abnormalities were not attributable to a greater extent of infarction as judged from residual LV CK activity. In fact, infarct size tended to be slightly lower (insignificantly) in the PTG mice. The abnormalities appear to reflect a profibrotic impact of PAI-1 overexpression on the heart. Thus, the absolute magnitude of the area of fibrosis and the area of fibrosis expressed as a percentage of LV area were greater in the PTG mice.
Taken together these observations are consistent with the hypothesis that overexpression of PAI-1 has a profibrotic impact on the heart with functional consequences that can exacerbate the severity of LV dysfunction after MI. We have previously observed increased expression of PAI-1 in the heart after MI in mice genetically rendered insulin resistant. Overexpression of PAI-1 has been strongly associated with insulin resistance in human subjects (29), and synthesis and elaboration of PAI-1 in vitro and in vivo are increased in diverse types of cells and tissues (2, 30–32) exposed to increased concentrations of insulin such as those seen with compensatory hyperinsulinemia associated with insulin resistance. Accordingly, it is possible that the increased incidence and severity of heart failure seen with diabetes after MI reflects in part a profibrotic impact of increased expression of PAI-1 on the heart. Thus, pharmacologic down regulation of overexpression of PAI-1 is an intervention that may be promising for retardation of development of heart failure in conditions associated with cardiac overexpression of PAI-1 after MI such as insulin resistance typical of type 2 diabetes.
Blood Pressure, Body Weight, and Left Ventricular Weight in Hearts from Normal C57BL6 and PTG Mice of 16 Weeks of Age a
PAI-1 in Plasma in C57BL6 and PTG Mice of 16 Weeks of Age a
PAI-1 in Left Ventricular Tissue in C57BL6 and PTG Mice of 16 Weeks of Age a
Left Ventricular Dimensions Determined Echocardiographically in C57BL6 and PTG Mice of 16 Weeks of Age a
Diastolic Function Reflected by PW Doppler Ultrasound of Transmitral Flow in C57BL6 and PTG Mice of 16 Weeks of Age a
Fibrosis in C57BL6 and PTG Mice 6 Weeks After MI a
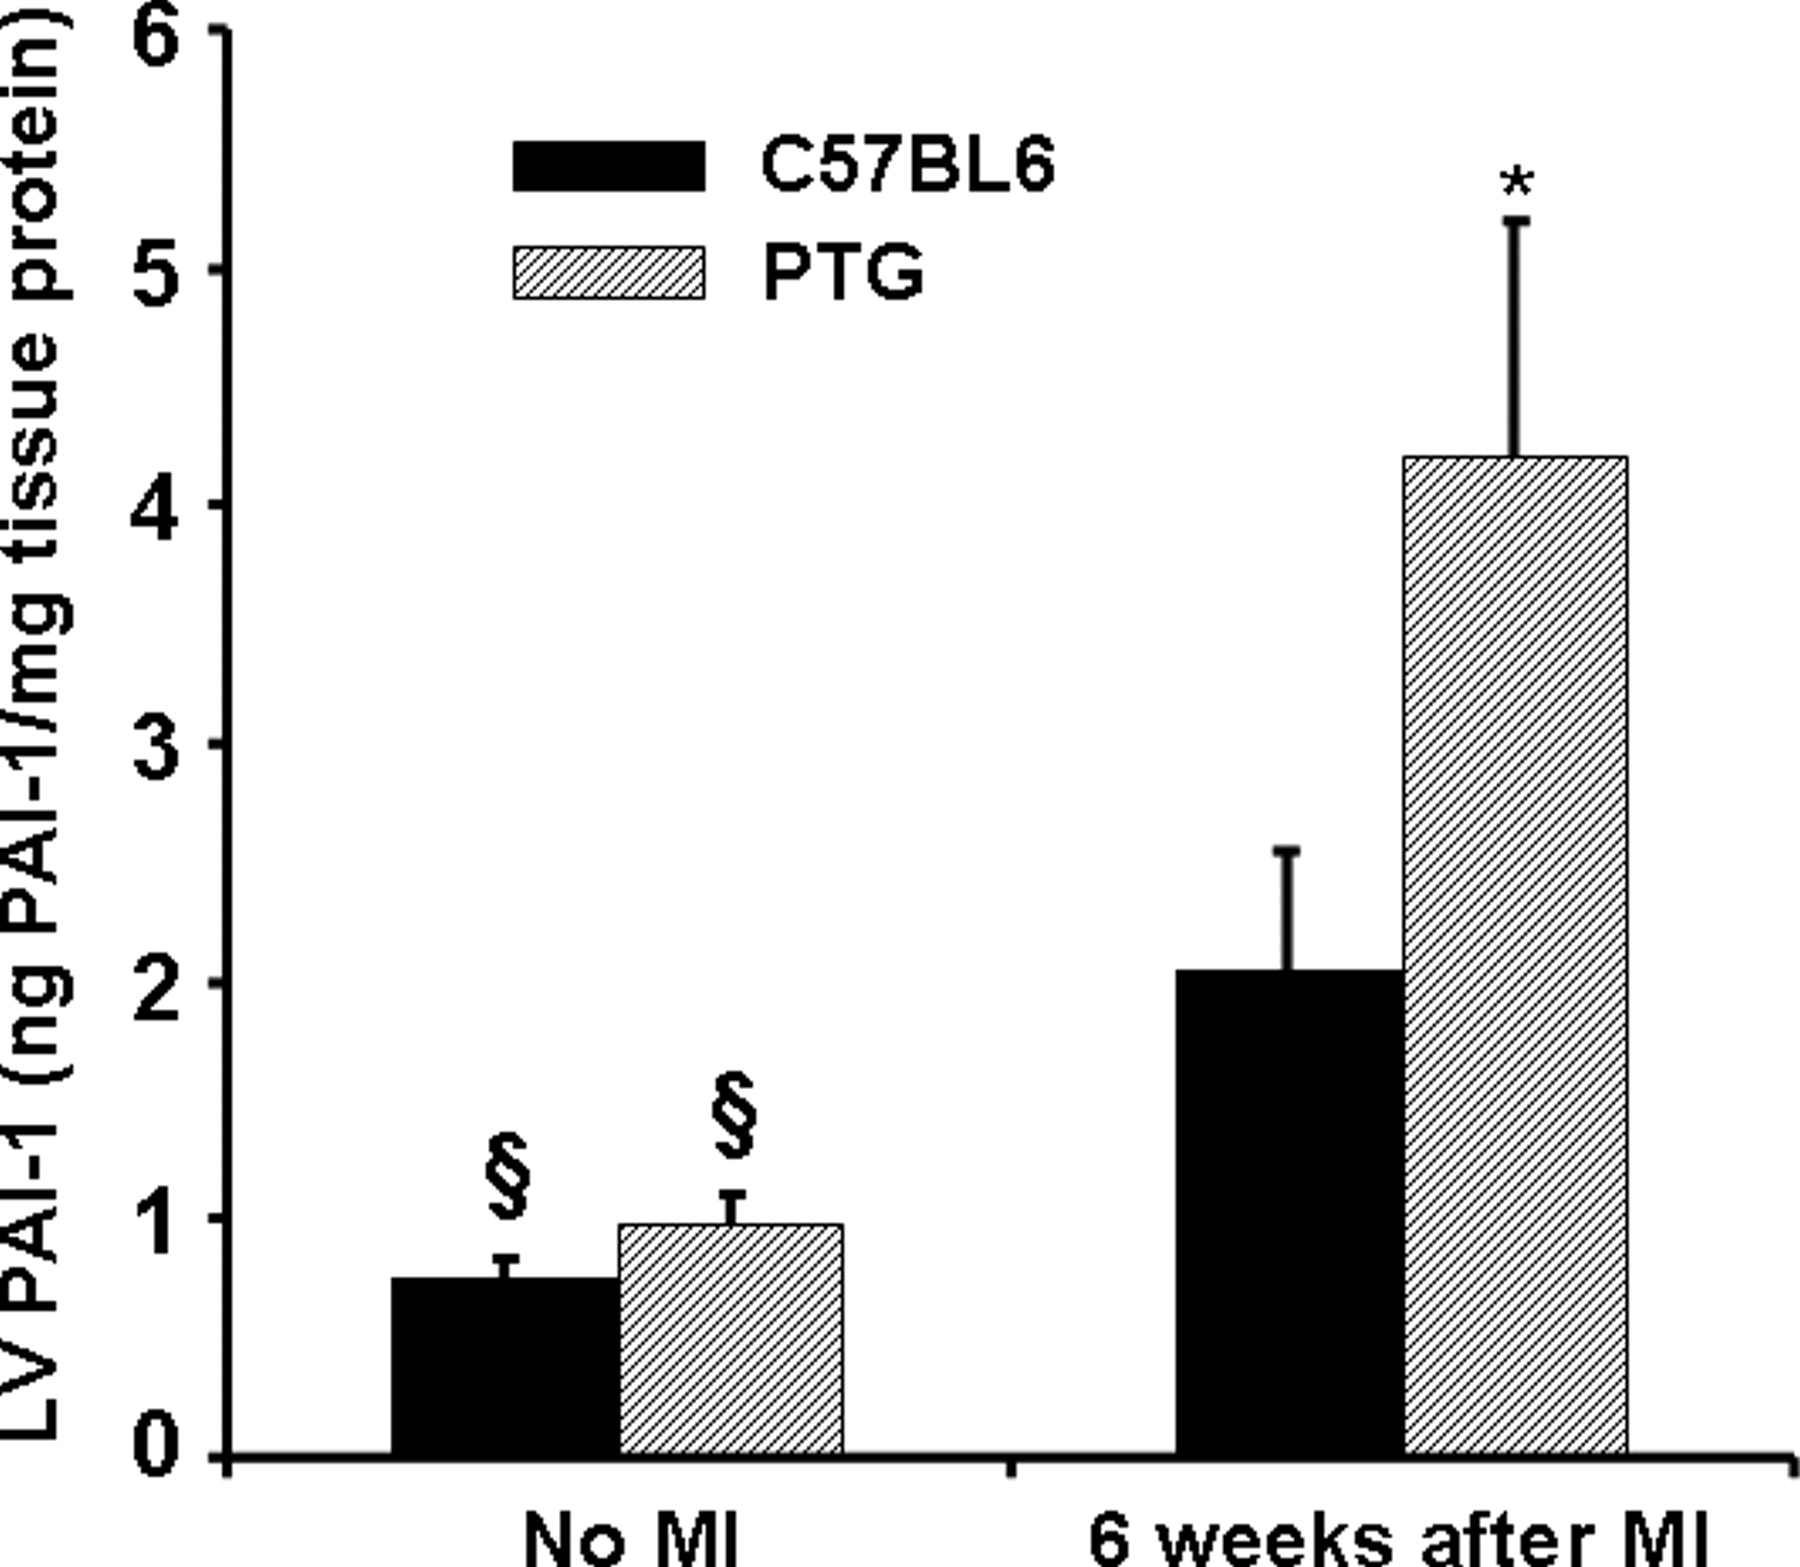
A bar graph showing LV myocardial PAI-1 content in C57BL6 and PTG mice. § Significantly different from that in the same strain 6 weeks after MI (P ≤ 0.05). * Significantly different from results in C57BL6 mice (P ≤ 0.05). Eleven normal C57BL6 and 5 normal PTG mice were studied, and 11 C57BL6 and 9 PTG mice were studied 6 weeks after MI.

Representative 2-dimensional M-mode and PW Doppler echocardiographic recordings from control 16-week-old C57BL6 and PTG mice and mice subjected at 10 weeks of age to MI. LVEDD, left ventricular end diastolic dimension; LVESD, left ventricular end systolic dimension; DWTA, left ventricular anterior end diastolic wall thickness; SWTP, left ventricular posterior end systolic wall thickness; MVE, mitral valve E-wave peak velocity; MVA, mitral valve A-wave peak velocity. Results in each group of mice are shown in Table 4 and Table 5. A color version of this figure is available in the online journal.

Bar graph showing fractional shortening values expressed as means ± SEM. § Significantly different from that in the same strain 6 weeks after MI (P ≤ 0.05). * Significantly different from results in C57BL6 mice (P ≤ 0.05). Nineteen normal C57BL6 and 10 normal PTG mice were studied, and 19 C57BL6 and 19 PTG 6 weeks after MI were studied.
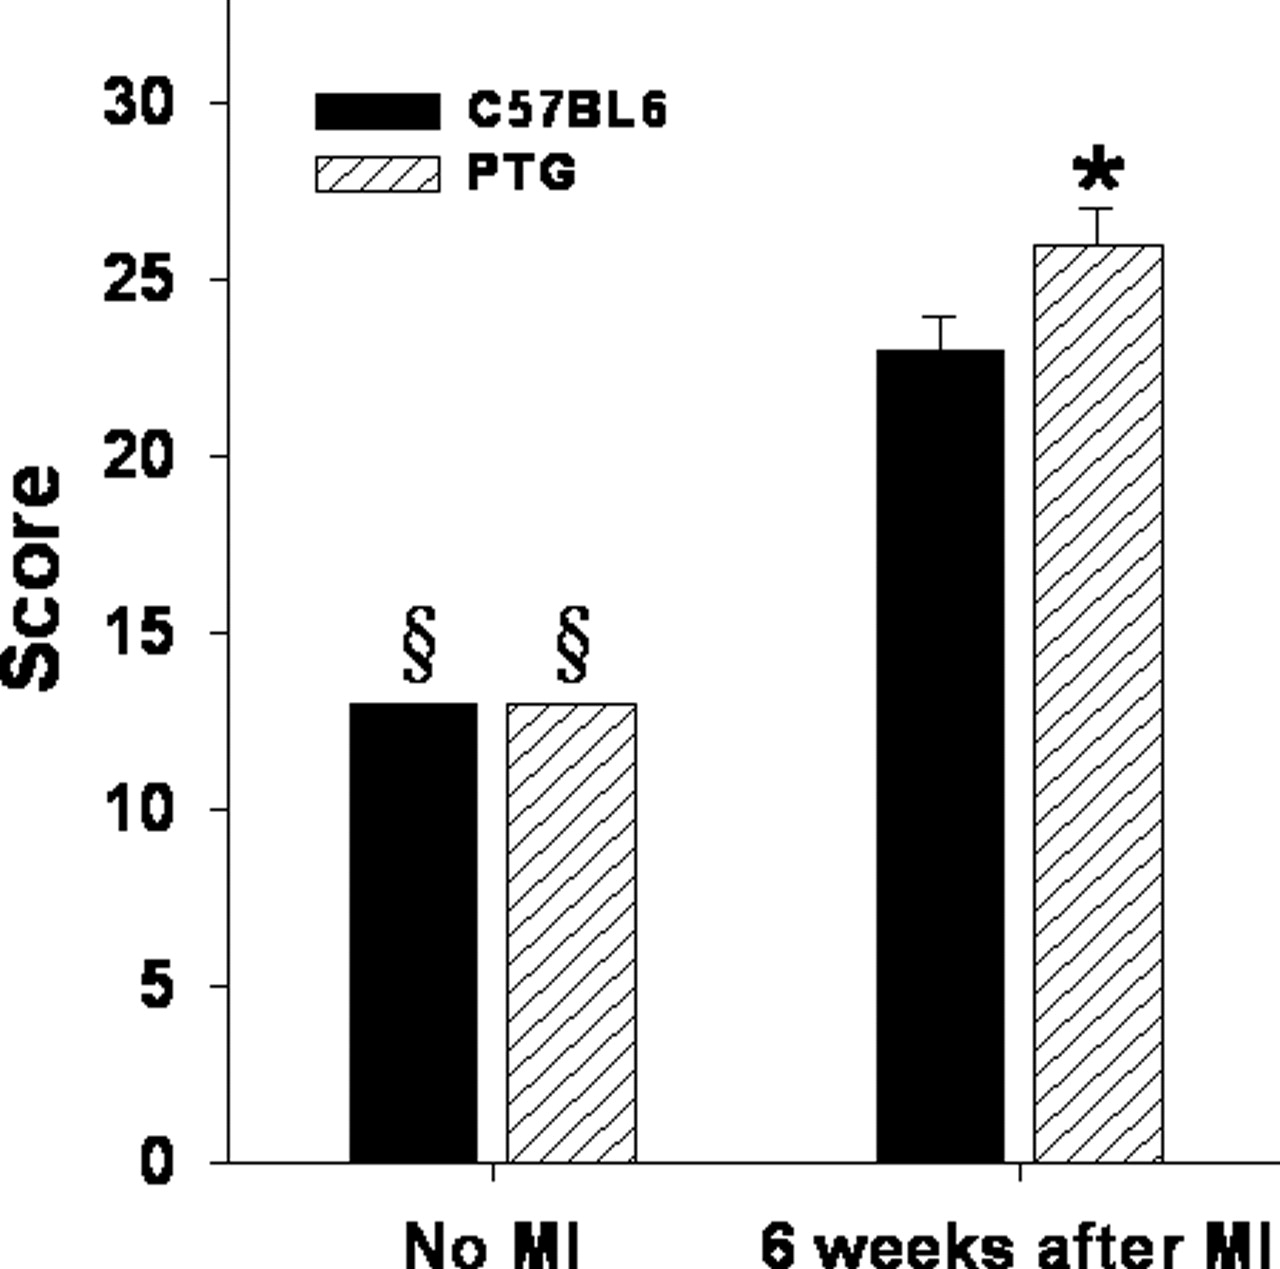
Bar graph showing echocardiographic score values expressed as means ± SEM. § Significantly different from that in the same strain 6 weeks after MI (P ≤ 0.05). * Significantly different from results in C57BL6 mice (P ≤ 0.05). Nineteen normal C57BL6 and 10 normal PTG mice were studied, and 19 C57BL6 and 19 PTG 6 weeks after MI were studied.
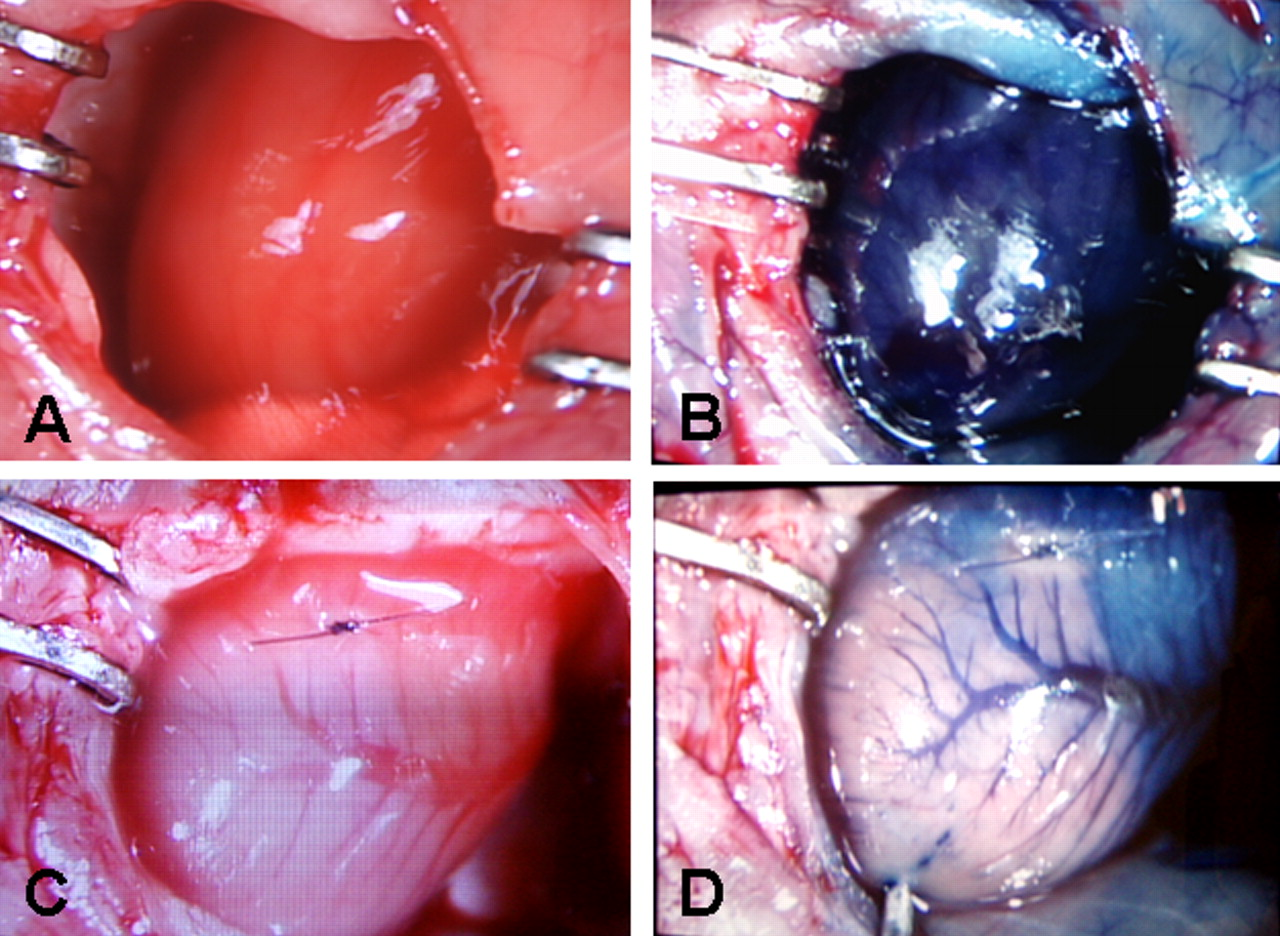
Gross macroscopic view of hearts obtained from normal C57BL6 mice (A and B) and from C57BL6 mice after LAD ligation (C and D). Figures B and D were obtained after intracavitary LV injection through the apex of 500 μl of 1% Evans blue dye. A well defined pale white infarct zone is seen distal to the site of ligation. Exclusion of Evans blue dye from this region indicates the impact on myocardial blood flow of the ligation of the LAD. A color version of this figure is available in the online journal.

Photographic assessment of fibrosis delineated with the use of Masson trichrome staining. Representative photographs of left ventricular cross sections obtained from C57BL6 (A) and PTG mice (B) 6 weeks after MI. Extensive remodeling and LV wall thinning is evident (blue color) in mice of both types. A color version of this figure is available in the online journal.
Footnotes
This work was supported in part by a grant from the Leducq Foundation (Transatlantic Networks of Excellence for Cardiovascular Research).
Acknowledgements
We thank Professor Dr. H. R. Lijnen at the Center for Molecular and Vascular Biology, Campus Gasthuisberg, O & N, Box 911, Herestraat 49, B3000 Leuven, Belgium for providing us with PAI-1 overexpressing breeding pairs of mice from which our colony was developed. The expert technical assistance of Patricia Baumann, Keara McElroy-Yaggy, and Dagnija Neimane, and the secretarial assistance of Lori Dales are deeply appreciated.