
Abstract
Staphylococcal enterotoxin B (SEB) is a biothreat agent, etiologic agent of food poisoning, and potent inducer of toxic shock syndrome. This heat-stable exoprotein is thought to act as a superantigen to induce T cell–specific pathology. Most animal models do not accurately map the clinical syndrome of human SEB exposure. Previously, we have demonstrated the utility of the weanling piglet model of SEB intoxication. Here, we analyze gross and histopathologic specimens from lymphoid tissue of these animals. Hematological testing was completed to observe changes in circulating leukocytes. Further, these leukocytes were differentiated and the subsets were subsequently analyzed using flow cytometry. Cytokine mRNA was quantified in lymphoid tissue and peripheral blood cells and compared to actual protein concentration using ELISA. The mRNA expression levels for several cell markers implicated in T and B cell differentiation were quantified and compared to control animals, as were levels for apoptosis-related genes. Lymphadenopathy was constantly seen post mortem. SEB-exposed animals had a leukocytosis which increased linearly over the time course. Monocyte levels increased over time, while lymphocyte levels peaked at 6h and then returned to baseline. Most cytokines had mRNA levels that were upregulated after exposure. Detection of serum cytokine changes was accomplished; however, these patterns did not always follow those seen in the differentially expressed genes. Both pro- and anti-apoptotic genes were differentially expressed in exposed animals. This paper reports, for the first time, the immunological findings in the weanling piglet model of SEB intoxication. From this work it is clear that there is not one absolute cell-mediated pathway contributing to the pathology these animals exhibit as a result of SEB exposure.
Introduction
Staphylococcal Enterotoxins (SEs) and Toxic Shock Syndrome Toxin 1 (TSST-1) are members of a family of pathologic proteins that are produced by coagulase-negative and -positive staphylococci (1–3). These pyrogenic exotoxins have the characteristic ability to simultaneously bind both HLA-DR (or DQ) and the T-cell receptor (TcR). This superantigenic interaction creates an immunological synapse that has the potential to produce inflammatory cytokines at pathologic levels both locally and systemically (4–8).
The epitopes associated with staphylococcal enterotoxin superantigenicity have been well documented. In particular, several regions of the Staphylococcal Enterotoxin B (SEB) crystal structure have been identified as key contributors to its immunomodulatory effects. The MHC-binding region of SEB consists of residues in helix 5 and β-sheet 2, while the TCR-binding regions include four discrete sequences at the top of the molecule: helix 2, the β-sheet 2–3 loop, the end of β-sheet 4, and the β10 to helix 5 loop (9, 10).
Currently, SEB is the only member of this family listed as a biothreat agent, as the potency and swift time-course of intoxication lends itself to a particularly high priority for therapeutic investigation. The plethora of biological activities collectively impact several organ systems of a susceptible host and, thus, contribute to the clinical syndrome that may culminate in lethal shock (11, 12). These include pyrogenicity, immunosuppression, toxic shock induction by a variety of cytokines, and stimulation of mitogenesis in T-cells (13). The variety and severity of SEB-induced lesions depend greatly on the route of exposure, and symptomatology can range from nausea/emesis to toxic shock syndrome (TSS) (13).
Eliciting the full spectrum of SEB pathology has been difficult to achieve in animal models. Commonly used laboratory animals (mouse, rat, and rabbit) are not suitable for SE studies, as these animals lack an emetic reflex. The rhesus monkey has been used to study toxin effects (14–16). However, use of non-human primates is severely inhibited by cost, safety, and ethical considerations. Studies involving ferrets and house musk shrews demonstrated that these models possess an emetic response to SE. However, few clinical or laboratory markers were used in these studies (17, 18).
Weanling piglets have been used to study SE as early as the 1980s. Taylor et al. reported that piglets exhibited both emetic and neurobehavioral adverse effects in response to SEA (19). Recently, we have described a piglet model capable of producing clinical findings (neurobehavioral, blood pressure, and temperature changes) seen with administration of SEB. This model also demonstrated multi-organ gross and histological lesions associated with shock (20).
As previously presented, our model failed to quantify the immunological response mounted by these animals once exposed to toxin. To remedy this, we monitored the population size changes of all components of circulating leukocytes as well as the expression profiles of a number of cytokines at both transcriptional and translational levels. To investigate the mechanisms of peripheral blood mononuclear cell (PBMC) population change, gene expression profiles of several pro- and anti-apoptotic proteins were monitored with RT-PCR. In order to clarify the source of initial circulatory cytokine burst in response to SEB challenge, we monitored the kinetics of expression of genes that are involved in T cell activation, differentiation, and cytokine synthesis.
Materials and Methods
Animals.
Litters of approximately eight 12-day-old male and female Yorkshire piglets were obtained from Archer Farms (Darlington, MD) and maintained as previously described (20). At approximately 18 days of age, piglets were anesthetized with isoflurane and injected with a lethal dose of SEB (150 μg/kg) or an equivalent volume of saline administered into the ear vein using a 26 gauge, ⅓-inch catheter. At 2, 6, 24, 48, 72h following exposure to SEB, animals were again anesthetized with isoflurane and blood and spleens were harvested.
Toxin Preparation.
Staphylococcal enterotoxin B Lot 14–30, purified by the method of Schantz et al. (21), was stored as a dry powder. A working stock solution was made by dissolving the SEB in sterile pyrogen-free water to achieve a concentration of 5 mg/ml. The solution was aliquoted and stored frozen. At the time of use, an appropriate aliquot was thawed and diluted with IV-injectable saline to 300 μg/ml. The lethal concentration of SEB was determined to be 150 μg/kg.
Peripheral Blood Mononuclear Cell Harvest.
Whole blood was collected into BD Vacutainer® CPT™ Cell Preparation Tube with Sodium Heparin (BD Bioscience, San Diego, CA). Plasma and Buffy Coat layers were harvested as per the manufacturer’s protocol. PBMC layer was washed with phosphate buffered saline (PBS) and dissolved in Trizol (Invitrogen, Carlsbad, CA) for total RNA isolation. The plasma was stored at −80°C.
Isolation of Splenic Lymphoid Cells.
Aseptically harvested spleen was placed in sterile petri dishes containing PBS. After removal of adipose tissue, the spleen was carefully minced and passed through a wire screen. Homogenate was collected and diluted in PBS. Pellets were collected via centrifugation and re-suspended in PBS. Suspended cells were then layered on top of Ficoll histopaque (Invitrogen, Carlsbad, CA) and centrifuged. Following centrifugation at ×700 g for 30min at 20°C, the buffy coat was transferred into a fresh 20ml tube containing cold PBS and centrifuged again at ×200 g for 10min at 4°C. The pellet was re-suspended in Trizol for total RNA isolation.
Gene Expression Analysis Using RT-PCR.
Total RNA was subsequently isolated from PBMC and spleen lymphoid cells using Trizol reagent (Invitrogen, Carlsbad, CA) following the manufacturer’s protocol. Equal amounts of total RNA were reverse transcribed to cDNA using oligo (dT)12–18 and Superscript reverse transcriptase II (Invitrogen, Carlsbad, CA). The cDNA obtained was used as a template for PCR reactions, using PCR master mixture (Roche, Indianapolis, IN). Primer pairs for PCR were designed based on known mRNA sequences (Genebank at PubMed) with free online primer design software Primer3 developed at MIT. Each cDNA was subjected to 25–30 PCR cycles using a GeneAmp 9600 thermal cycler (Perkin Elmer, Norwalk, CT) with conditions that resulted in a single specific amplification product of the correct size. Amplification was empirically determined to be in the linear range. Amounts of mRNA were normalized relative to 18S rRNA. The same cDNA template was used for PCR reactions with 18S primer pairs (Ambion, Houston, TX) under the same PCR conditions for each specific gene PCR. Reaction products (10μl) were visualized after electrophoresis on a 1% agarose gel using SYBR Green I (Kemtek, Rockville, MD). Gels were digitized using a BioRad Molecular Imager FX (BioRad, Hercules, CA) and band intensities were used to calculate mRNA abundance.
Cytokine Protein Array.
Interleukin 1 β (IL1β), IL2, IL4, IL6, IL8, IL10, IL12 (p70), interferon γ (IFNγ), and tumor necrosis factor α (TNFα) concentrations in plasma were measured at Pierce Boston Technology Center on the Searchlight Porcine Cytokine Array (Pierce, Woburn, MA). Plasma cytokine concentrations were also measured with the Biosource swine sandwich ELISA kits (Biosource, Camarillo, CA).
Flow Cytometric Analysis.
Whole blood samples (0.1ml) obtained from the piglets were immediately stained with FITC-, PE-, and biotin-conjugated mouse anti-porcine monoclonal antibodies to T cells (anti-CD3ε, CD4α, and CD8α) and B cells (anti-CD21) for 30min in the dark. Erythrocytes were subsequently lysed using erythrocyte lysis buffer (Sigma, St. Louis, MO). Cells were stained simultaneously with two antibodies bearing FITC or PE, or one bearing either FITC or PE fluorochrome and the other bearing biotin, which was incubated with PE or FITC-conjugated streptavidin. Isotype-matched pure mouse immunoglobulins were used to determine non-specific fluorescence of controls. A total of 10,000 events were collected on a Becton Dickinson FACScan (San Diego, CA) flow cytometer and analyzed using the accompanying CellQuest software. To determine the relative population of different components of lymphocytes, cells were electronically gated to exclude small debris and granulocytes.
Complete Blood Cell Counting.
Whole blood collected in sodium EDTA tubes was analyzed using a Coulter Gen-S
Hematology Analyzer
Immunohistochemistry.
Lymphoid tissue was fixed and sectioned in accordance with standard operating procedures. After sectioning, specimens were stained with Hematoxylin and Eosin and subsequently analyzed using light microscopy. Five-millimeter paraffin-fixed samples were solvated and incubated with anti-CD3 antibody. After washing, the sample was incubated with secondary antibody conjugated with horseradish peroxidase (HRP), washed, and treated with 3,3′ diaminobenzidine tetrahydrochloride (DAB), creating a brown reaction product. The same protocol was followed for CD-79. All counterstaining was preformed with hematoxylin.
Results
Gross Pathology and Immunohistochemistry of Lymphoid Tissue.
Postmortem examination revealed dramatic changes in the spleen and lymph nodes. As was reported previously in this animal model, splenomegaly was consistently present as early as 48h post-SEB exposure (20). Severe hemorrhagic mesenteric lymphadenopathy is also a consistent feature of this syndrome. These nodes showed a marked increase in the numbers of lymphocytes (Fig. 1A). Cortical and paracortical areas are markedly expanded by CD3+ lymphocytes and not B cells (Fig. 1C–D).
Changes in Circulating Leukocytes.
The absolute number of circulating leukocytes increased linearly over time, with the exception to this pattern being the 24-h post-exposure samples (Fig. 2). All time points reached statistical significance as compared to control (except the 72-h sample, which did not have replicates). Subpopulations of these cells also exhibited marked alterations (Fig. 3). Interestingly, the level of circulating neutrophils did not fluctuate drastically throughout the time course. Monocyte levels increased steadily over time, while levels of lymphocytes were lowest at 6h before returning to baseline levels.
Flow cytometry revealed that a large proportion of CD4+CD8− cells declined steadily to a nadir at 6h post-exposure (Table 1). This subpopulation returned to baseline levels at 24h but had plummeted dramatically by 72h. The CD4+CD8+ subpopulation did not appreciably change until the 72h timepoint. Levels of circulating CD3+CD8+ lymphocytes exhibited similar behavior.
CD3−CD8+were minimally represented 6 and 24h after SEB exposure. At 72h, the percentage of CD3−CD8+ was elevated beyond baseline levels. CD3+CD4−CD8− lymphocyte levels increased at 6 and 24h, but dipped below pre-exposure levels at 72h. The percentage of CD21-expressing lymphocytes (B cells) decreased gradually after SEB exposure.
Cytokine Expression at the Transcription Level.
Figure 4 shows that both Th1 and Th2 family cytokine transcription was induced by SEB in PBMC and spleen lymphoid cells. This figure also demonstrates that the expression of these cytokines peaked earlier in splenic lymphoid tissue than in PBMC. IL6 message was up-regulated in PBMC, whereas IL10 message was more up-regulated in spleen lymphoid cells. The genes for the cell growth factors IL15, IL12, IL18, IL1α, and IL1β were upregulated after SEB injection.
Plasma Cytokine Concentrations.
IL2, IFNγ, IL12, and IL6 levels in plasma peaked at 2h and decreased sharply at later time-points. IL4 was not detectable in plasma from either SEB-treated piglets or saline-treated piglets (data not shown). IL1β, IL8, IL10, and TNFα levels were detectable. IFNγ, TNFα, IL6, and IL10 had two peak values, one appeared within 6h and one emerged at or after 48h post exposure. Interestingly, IL1β reached peak value at later time points and had a continuous upward trend. IL2 and IL12 peaked at 2h and went back to control values at 24h (Fig. 5).
SEB Induces Expression of Genes Involved in T Cell Activation, Differentiation, and Cytokine Synthesis.
CCR7 (CC chemokine receptor 7) is required for dendritic cells (DCs), T cells, B cells, and one set of natural killer cells (NK cells) to migrate to lymphoid organs, where the CCR7 ligands CCL19 and CCL21 are expressed. Up-regulation of CCR7 (Fig. 6) is observed after SEB exposure. CD25 (IL2RA) and cytotoxic T lymphocyte antigen-4 (CTLA4) are expressed on activated T cells. The up-regulation of these two genes (Fig. 7) indicated that T cells were activated immediately after SEB injection.
Up-regulation of CD40, CD40 ligand (CD40L) or CD154, CD54, CD58, CD80 (or B7.1), and CD86 (or B7.2) was most pronounced in PBMC; however, modest increase in message was also detected in the splenocytes. IL12 receptorβ2 (IL12RB2) and Class II transactivator (CIITA) are selectively expressed in Th1 cells and up-regulated in PBMC and spleen lymphoid cells. cJUN was up-regulated at all time points in PBMC after SEB exposure. However, its expression did not significantly change in spleen lymphoid cells. STAT2, STAT4, and STAT5B were up-regulated in PBMC and spleen lymphoid cells. However, the expression of these three genes reached their peak values at different timepoints (Fig. 6).
SEB Induces Differential Expression of Pro-and Anti-Apoptotic Genes.
SEB induced the expression of several pro-apoptotic genes in piglet peripheral and spleen lymphoid cells. Up-regulation of apoptosis-specific protein (ASP) in PBMC (Fig. 7A) is seen soon after SEB injection. Caspase 3, Caspase 1, p55 tumor necrosis factor receptor 1, CD95 ligand, RAD21, prothymosin alpha (PTMA), and Bak were all up-regulated, as were Anti-apoptosis genes BclxL, defender against apoptotic death-1 (DAD1), and Survivin.
Discussion
Weanling Yorkshire piglets exposed to intravenous SEB exhibited typical and severe pathological signs including prostration, emesis, diarrhea, and pyrexia as well as terminal hypotension and death. As we reported previously, this model is superior to rodent and nonhuman primate models in terms of mirroring the human clinical course and physical signs of SEB intoxication. In the present study, we again encountered impressive gross pathology in several lymphoid tissues and, specifically, the mesenteric lymph node (Fig. 1). Although terminal edema in primates and humans tends to localize in the thorax, this post-mortem finding is more abdominally focused in swine. However, the virtually identical biphasic clinical response in swine and humans led us to further investigate the molecular and immunological manifestations in this study.
We found the porcine immunological response to be varied. The initial trend was consistent with an immediate burst of the innate immune response followed by a predominantly adaptive response 24 to 48h after SEB exposure (Fig. 8). Although SEs are well known for their effects on T cell activation and cytokine mobilization (7, 22), few studies have examined the contribution of other cell types such as granulocytes (particularly neutrophils). The absolute leukocyte count increased linearly over time, with a slight reduction 24h post-exposure (Fig. 2). This reduction seemed attributable to a 24-h post-exposure decline of circulating neutrophils to pre-exposure levels (Fig. 3). Schuberth et al. (23) observed that in vitro SEB exposure of granulocytes in the presence of blood mononuclear cells resulted in accelerated death of bovine neutrophils, with only 20–50% survival after 24h. This may indicate a potential indirect effect of SEB on neutrophil cell death.
The decrease in neutrophil count from 6h to 24h also appeared to coincide with the previously observed development of vascular congestion and vascular leakage in the liver, spleen, lymph nodes, and brain (20). This concurrence seemingly indicates a pivotal role for neutrophils in the development of vascular decompensation and terminal shock. The associated development of severe hypotension may be due in part to the potent vasodilator nitric oxide (NO). In current studies, we are detecting a sharp increase in NO release between 6h and 24h (measured as plasma nitrite and nitrate concentrations). However, a comparable increase in the mRNA synthesis of inducible NO synthase (iNOS) or endothelial NO synthase (eNOS) was not observed in peripheral blood mononuclear cells (PBMC) (24).
Monocytes did not significantly increase until 24h post-exposure. This gradual rise in the monocyte subpopulation peaked at 48h post-intravenous injection of labeled cells. Van Furth et al. (25) demonstrated a similar trend in a murine model. In addition, they detected a concurrent decline in neutrophil count at 24h after the inflammatory insult that also returned to baseline levels.
Although it has not been determined to what extent SEs can stimulate porcine alpha/beta T cell response, it is conceivable that porcine T cells can be stimulated in a similar fashion. SEB-specific T cells are activated in secondary lymphoid organs and returned to the circulation. Within 2h, 90% of SEB-specific T cells disappear from the blood. This initial depletion is believed to be due to sequestration in peripheral lymphoid organs (26, 27). Subpopulations of CD4+CD8− and CD4+CD8+ cells are able to respond to in vitro mitogenic stimuli, which might account for their migration out of circulation at 6h post-SEB exposure (28) (Table 1). It has been reported that CD4 cell proliferation in SEB-exposed mice was maximal after 16–24h and that many of these cells remain in grossly enlarged secondary lymphoid tissues (27, 29).
We detected immediate post-exposure IL4 mRNA in PBMC and spleen lymphoid cells (Fig. 4) but did not detect circulatory IL4 (data not shown). This seems to indicate an alternative mediator is involved in Th2 activation.
All upregulated plasma cytokines, except IL2, may be produced by monocytes and NK cells as well as by T cells (30, 31–36). Therefore, in this model, we purport that the early cytokine burst may also be due to activation of the innate immune system and not just a T-lymphocyte function (Fig. 5).
IL2, IFN-gamma, IL6, and IL12 concentrations in plasma peaked between 2 and 6 h, similar to observations in SEB-exposed monkeys (37). IL2 and IL12 are important early mediators of SEB-induced shock, consistent with their contribution in promoting naïve T helper cells to proliferation and differentiation (36).
More effector memory cells, which could release effector cytokine such as IFN-gamma, IL6, and IL10, were generated after 24h, as indicated by the down-regulation of CCR7 expression and up-rising T cell proportion in the PBMC (Figs. 4 and 5). Consequently, the plasma cytokine detected at 48h should be mainly due to newly generated functional effector T cells. As a result, the late spike of IFN-gamma in plasma might be produced by T cells.
STAT4 is an essential component of IL12 signaling pathway and consequently plays an important role in Th1 differentiation (36). IL12, IL18, STAT4, and IFN-gamma expression was upregulated in response to SEB (Fig. 6), similar to responses observed in mice, humans, and non-human primates (36, 38).
CD25 (IL2RA) (39) and cytotoxic T lymphocyte antigen-4 (CTLA4) (38) are expressed on activated T cells. The up-regulation of these two genes (Fig. 6) could indicate that T cells were activated immediately after SEB injection.
IL12 receptor (IL12RB2) (36) and Class II trans-activator (CIITA) (30) are selectively expressed in Th1 cells. Class II transactivator (CIITA) regulates the expression of MHC-II molecules and is inducible by IFNα. Up-regulation of IL12RB2, CIITA, and CTLA4 in PBMC and spleen lymphoid cells (Fig. 6) suggests that Th1 differentiation was promoted and induced soon after SEB injection. They were up-regulated in both PBMC and spleen lymphoid cells as early as 6h after SEB injection, which is much earlier than naïve CD4+CD8− T helper cells (T helper cells) became CD4+CD8+ memory cells.
cJUN, an immediate early response gene, is a major component of transcription factor AP-1, which regulates various aspects of cell proliferation (40). Up-regulation of cJUN in PBMC (Fig. 6) is consistent with the immediate cell proliferation and differentiation in response induced by SEB. cJUN was up-regulated at all time points in PBMC after SEB injection to piglets, whereas its expression had almost no change in spleen lymphoid cells, suggesting that most of the activated cells might have migrated out of the spleen soon after the activation. STAT2, STAT4, and STAT5B were up-regulated in PBMC and spleen lymphoid cells at some or all time points; however, the chronology of their differential expression varied.
SEB induced the expression of a number of pro-apoptotic genes in piglet PBMC (including lymphocytes, monocytes, and NK cells) and spleen lymphoid cells, suggesting that cell apoptosis might have been induced soon after the SEB injection (Fig. 7). This apoptosis seemed to follow caspase-dependent pathways, as indicated by the two-fold increase in the expression of the apoptosis marker apoptosis-specific protein (ASP) in PBMC at 6h (Fig. 7), and by the up-regulation of caspase 3, caspase 1, p55 tumor necrosis factor receptor 1, CD95 ligand, the novel caspase substrate RAD21, and prothymosin alpha (PTMA). However, we were not able to detect CD95 expression with RT-PCR (data not shown). The lack of CD95 expression suggests that Fas-FasL (or CD95-CD95L) might not contribute to the apoptosis in piglet PBMC or CD95 is not required in the apoptosis. The early up-regulation of anti-apoptotic genes BclxL, defender against apoptotic death-1 (DAD1) in PBMC (Fig. 7), indicated that anti-apoptotic pathways might have also been triggered by SEB simultaneously with the pro-apoptotic pathways.
In summary, our model shows that the immune response to SEB in this piglet model is multifaceted (Fig. 8). Clearly, many cell types are affected by intoxication and it is still unclear how these responses work in concert to create the clinical syndrome observed. Further in vivo, ex vivo, and in vitro studies will need to be conducted in this model system to fully understand the superantigenic nature of SEB in this system. It is, however, evident from this work that there is not one clear-cut cell-mediated response that predominates to create the toxic shock syndrome seen in these animals.
FACS Analysis of Lymphocyte Service Markers a
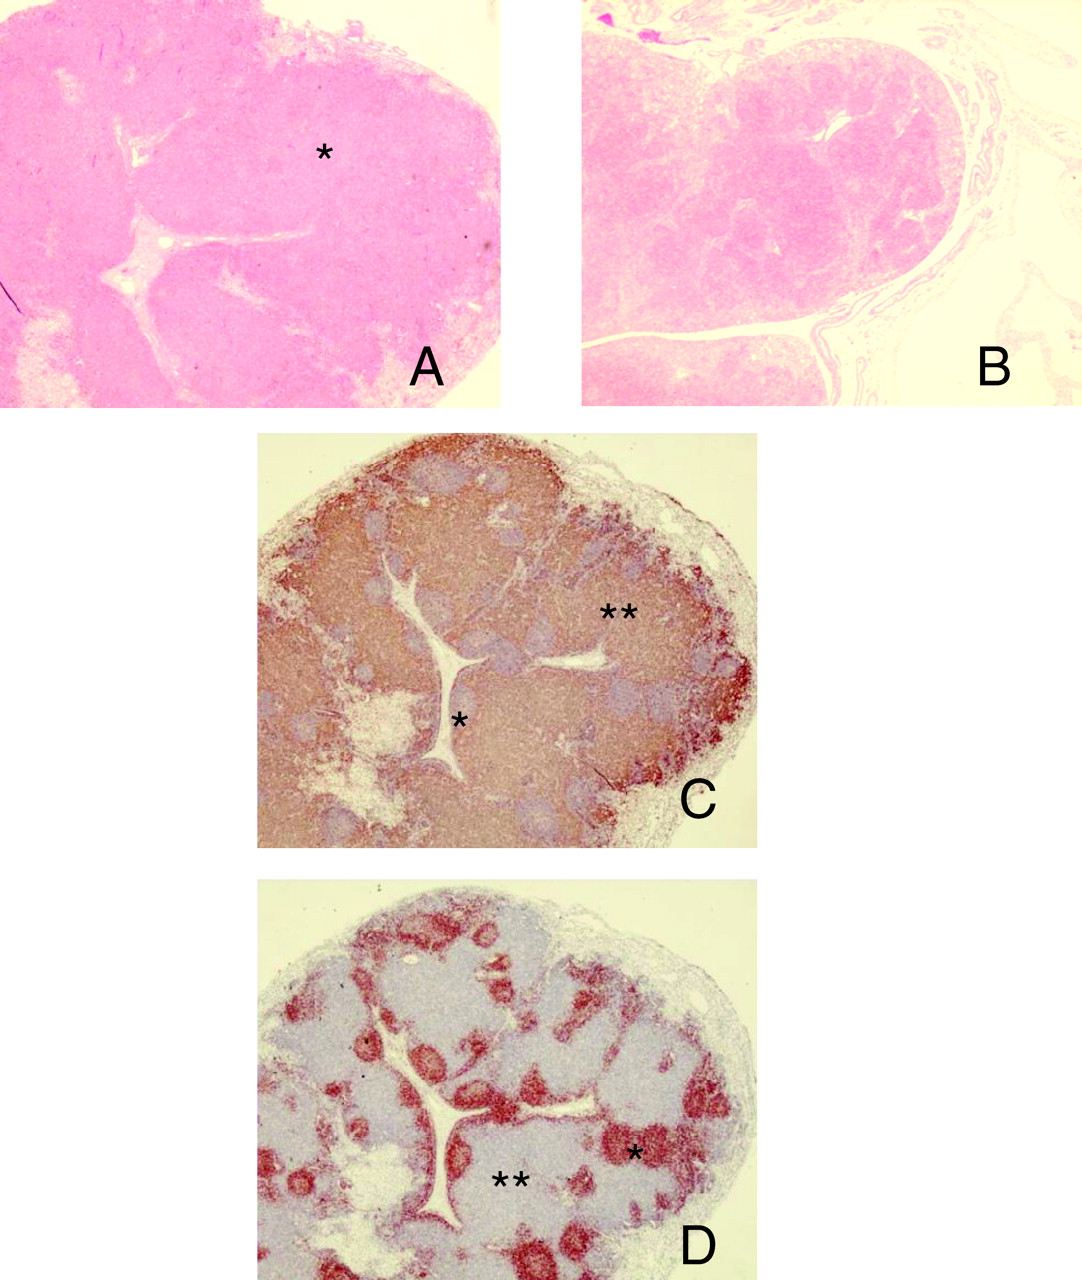
Histopathology and immunohistochemistry of a representative lymph node. All photographs were taken at ×10 magnification (samples were obtained from animals 48h post-exposure). A. Hematoxylin and eosin–stained section of mesenteric lymph node from a staphylococcal enterotoxin-B (SEB) exposed piglet demonstrating markedly increased numbers of lymphocytes distributed throughout the lymph node (*). B. Hematoxylin and eosin–stained section of mesenteric lymph node from a saline control animal. C. Section of mesenteric lymph node from SEB-exposed piglet labeled with the pan-T-cell marker, CD3. Cortical and paracortical areas are markedly expanded by CD3+ lymphocytes labeled with 3,3′ diaminobenzidine tetrahydrochloride (DAB) reaction product (brown) and counter-stained with hematoxylin (***). Germinal centers (B-cell areas) are spared (*). D. Section of mesenteric lymph node from SEB-stained piglet labeled with the B-cell marker CD79 and counter-stained with hematoxylin. Cortical and paracortical areas remain unlabeled (**), while germinal centers stain intensely with the DAB reaction product (*).
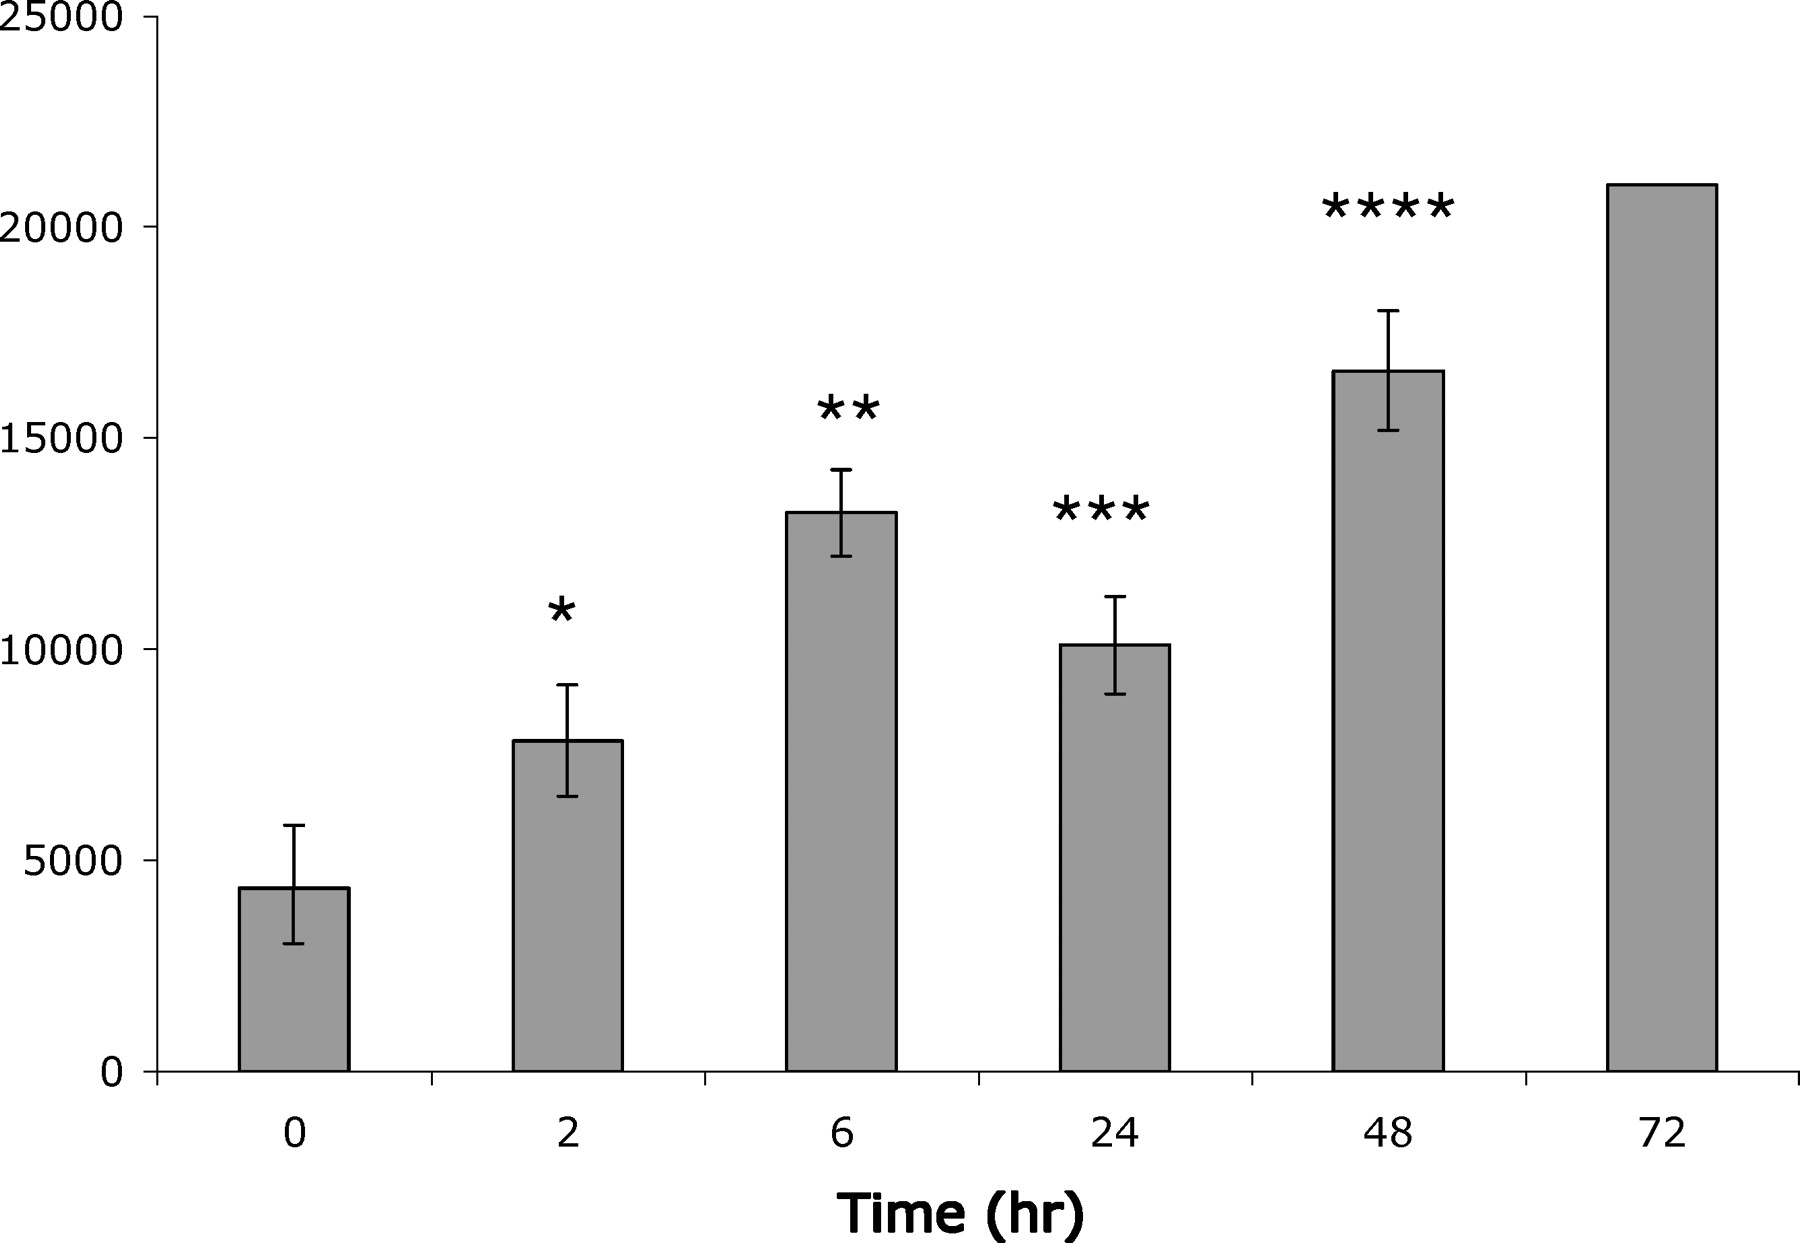
SEB-induced changes in leukocyte count. White blood cells were counted in blood samples drawn from piglets at time intervals 0, 2, 6, 24, 48, and 72h. Each bar represents the mean of at least 3 animals ± SD. Statistical significance compared to the zero time point was determined using the Student’s t test (P values: * = 0.03; ** = 0.001; *** = 0.006; and **** = 0.001).

SEB-induced changes in differential analysis of leukocytes. Gray bars = Monocyte; White bars = Neutrophil, and Black bars = Lymphocyte. Each bar represents the mean of at least 3 animals ± SD.
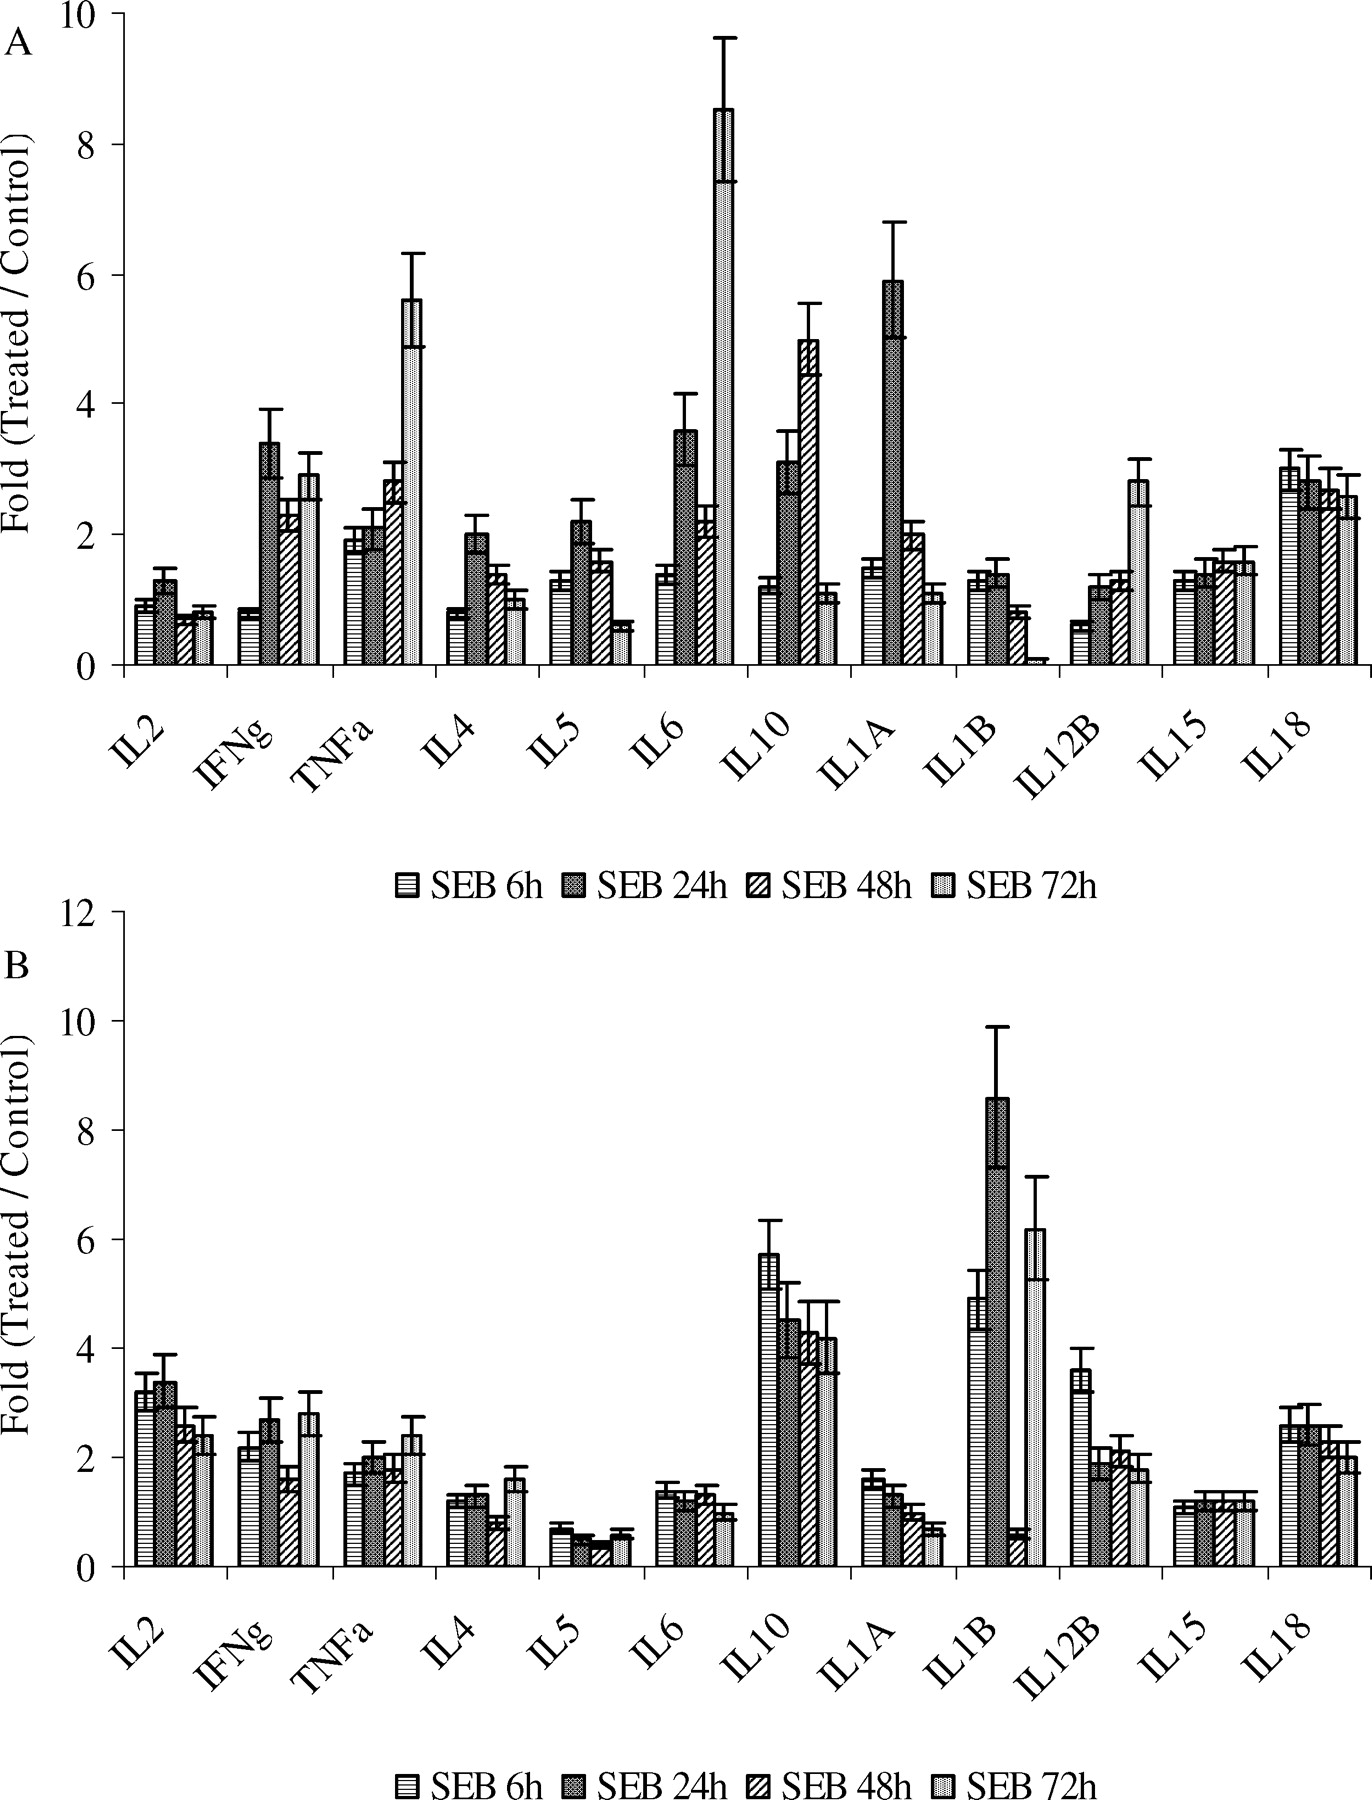
SEB-induced expression of cytokines in PBMC as compared to spleen. RT-PCR was done with total RNA extracted from PBMCs and spleen lymphoid cells, which was isolated from whole blood and spleens collected at 6, 24, 48, and 72h after piglets were exposed to SEB or control. For each time point, at least two piglets were used. RT-PCR for each gene was repeated at least twice. Markers from PBMC are indicated in Panel A, while markers from spleen are indicated in Panel B. Values equal the mean ± SD.
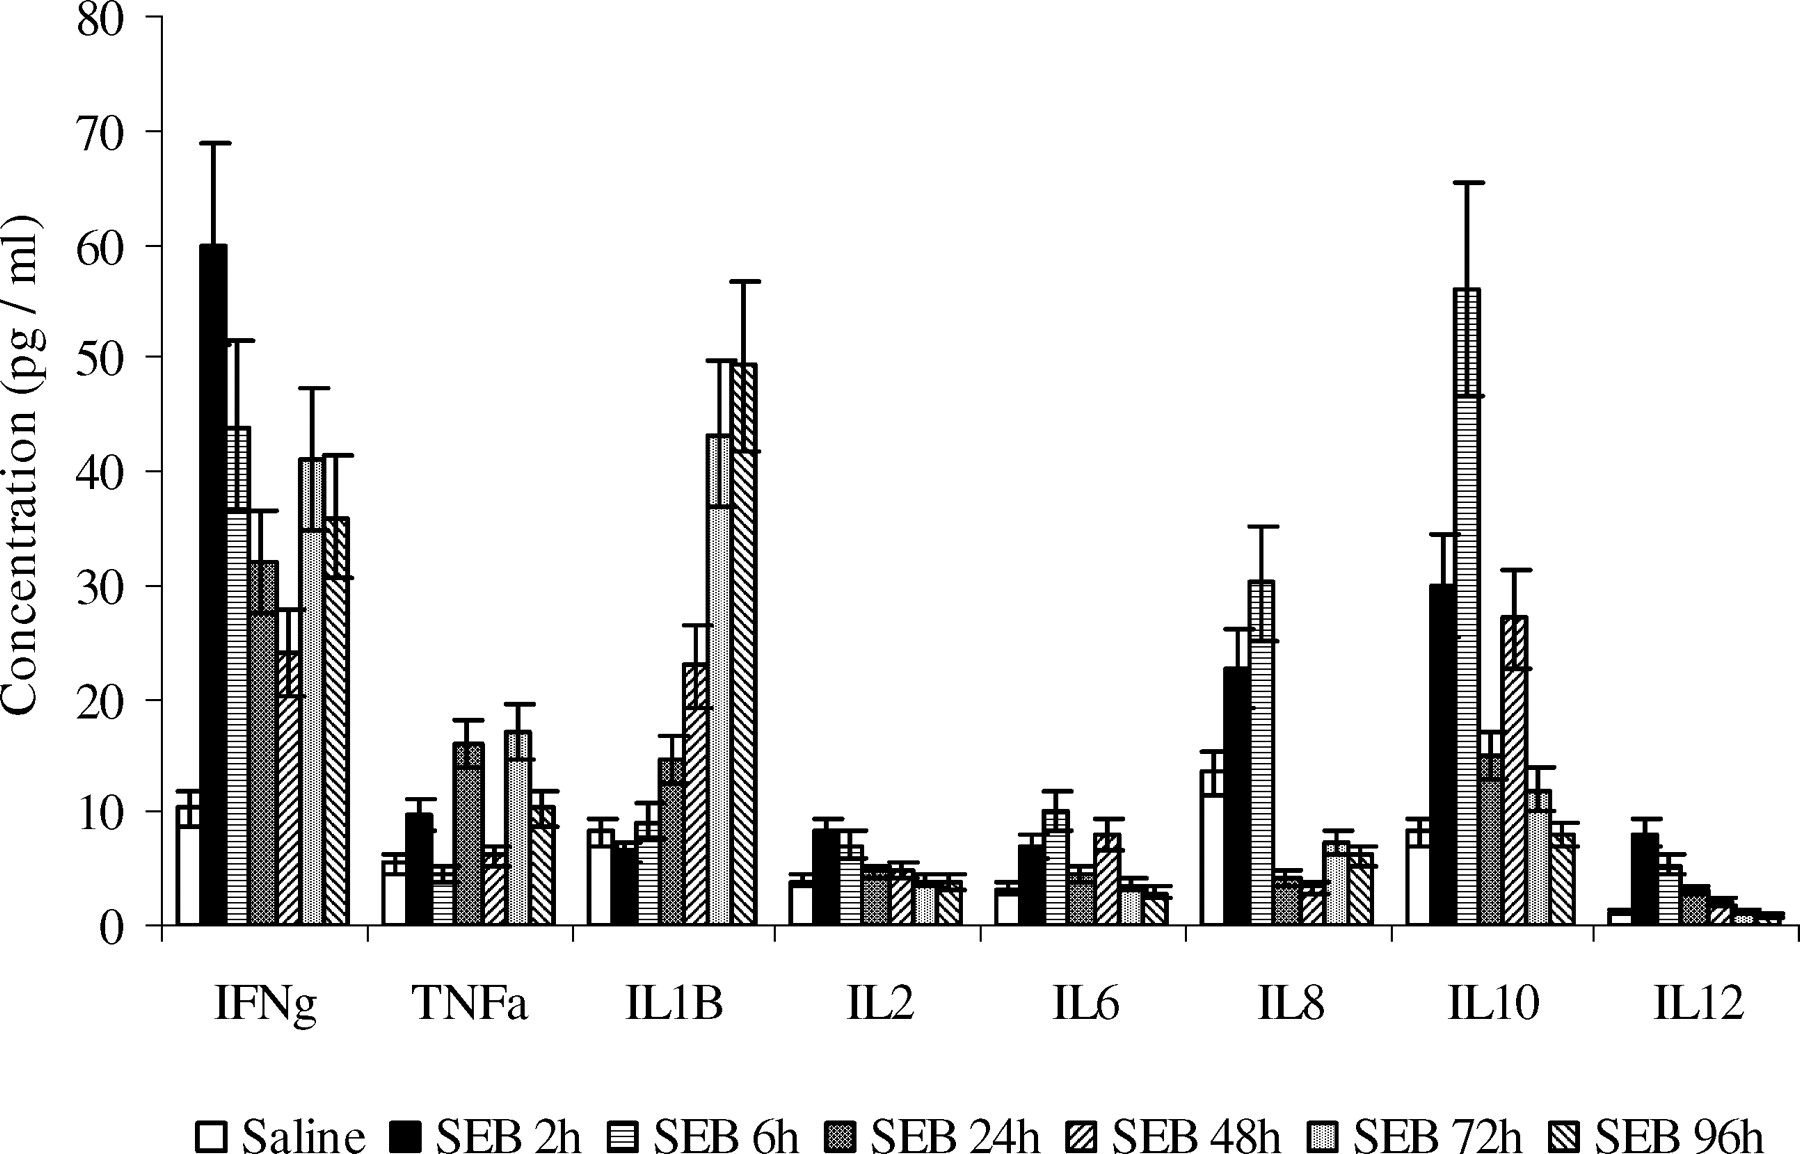
Plasma cytokine concentration changes in response to SEB. Plasma cytokine levels were determined with porcine cytokine array. For each time point, at least two piglets were used. Each assay was performed in triplicate and the data represent the mean ± SD.
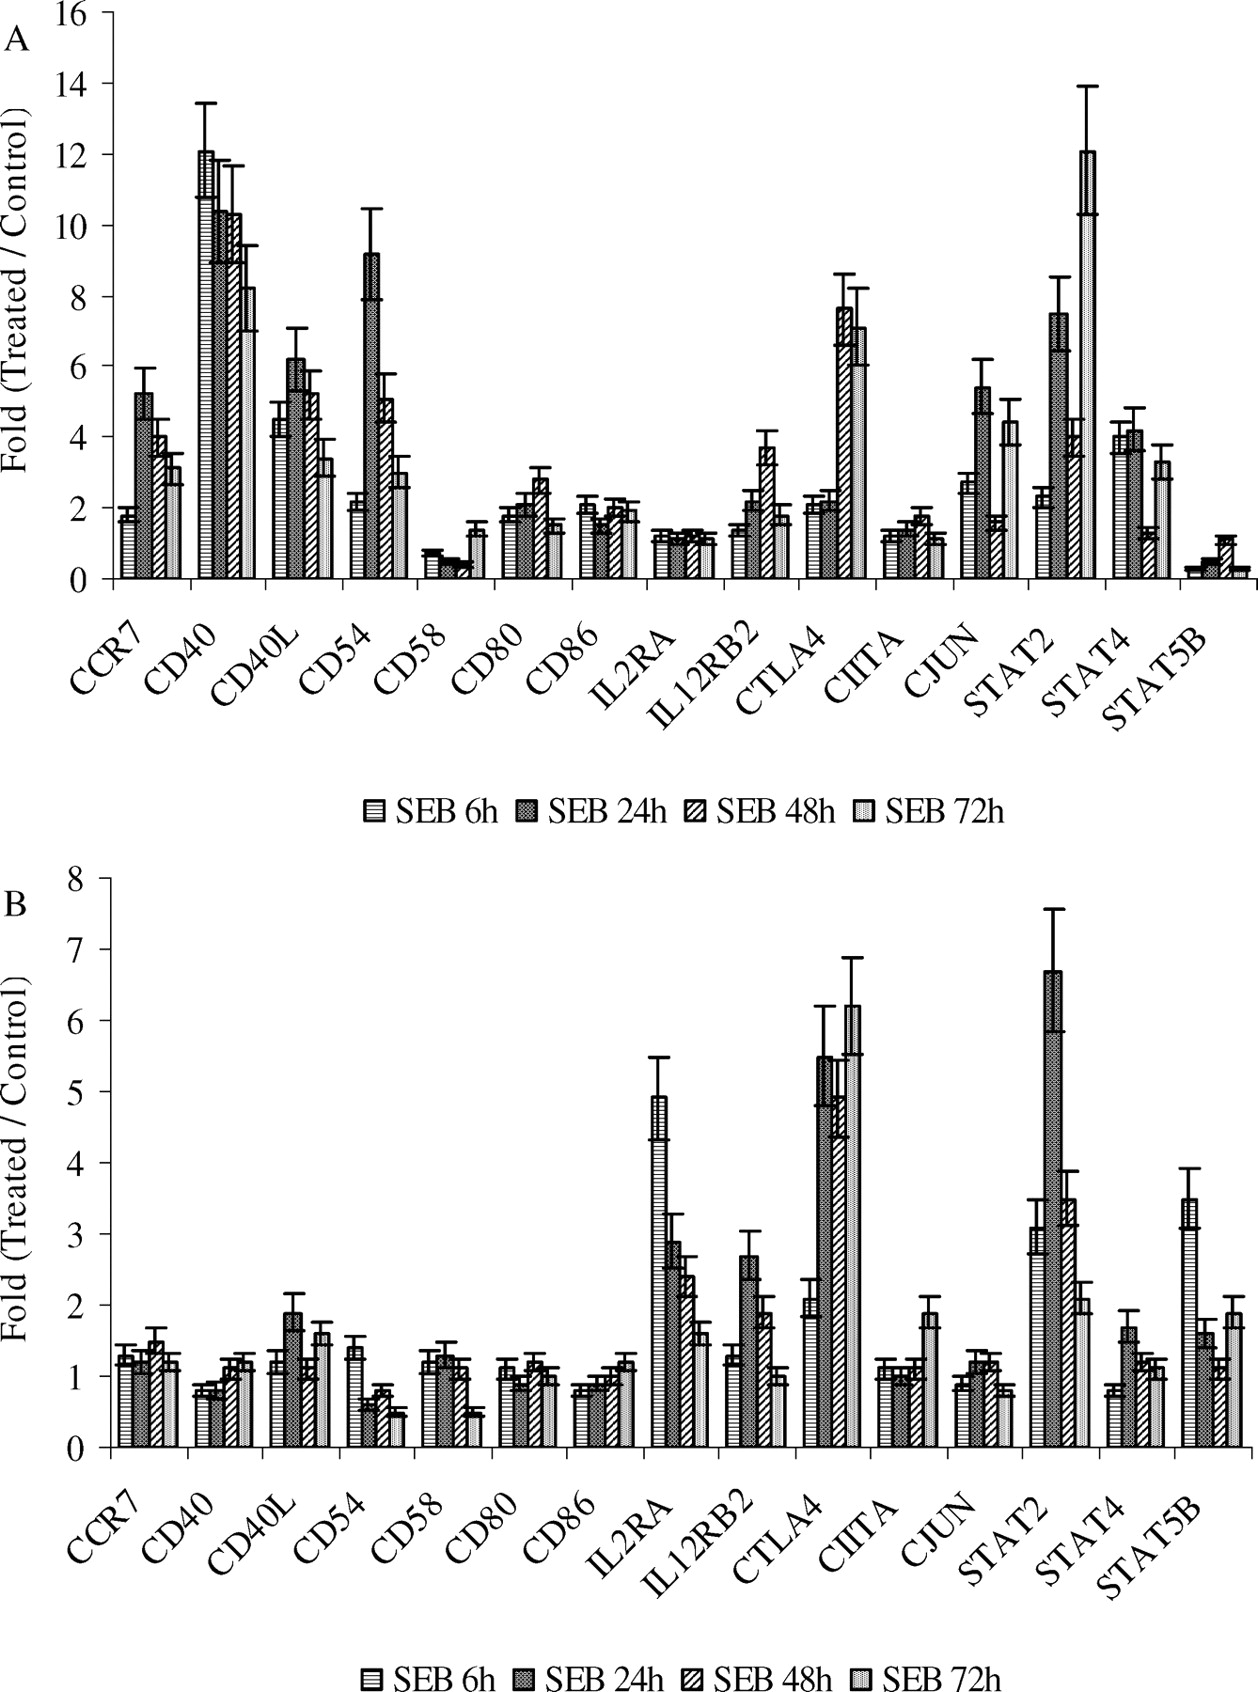
SEB-induced differential expression of genes involved in T cell activation, migration, and differentiation. RT-PCR was done with total RNA extracted from PBMC and spleen lymphoid cells, which was isolated from whole blood and spleens collected at 6, 24, 48, and 72h after piglets were exposed to SEB or control. Markers from PBMC are indicated in Panel A, while markers from spleen are indicated in Panel B.
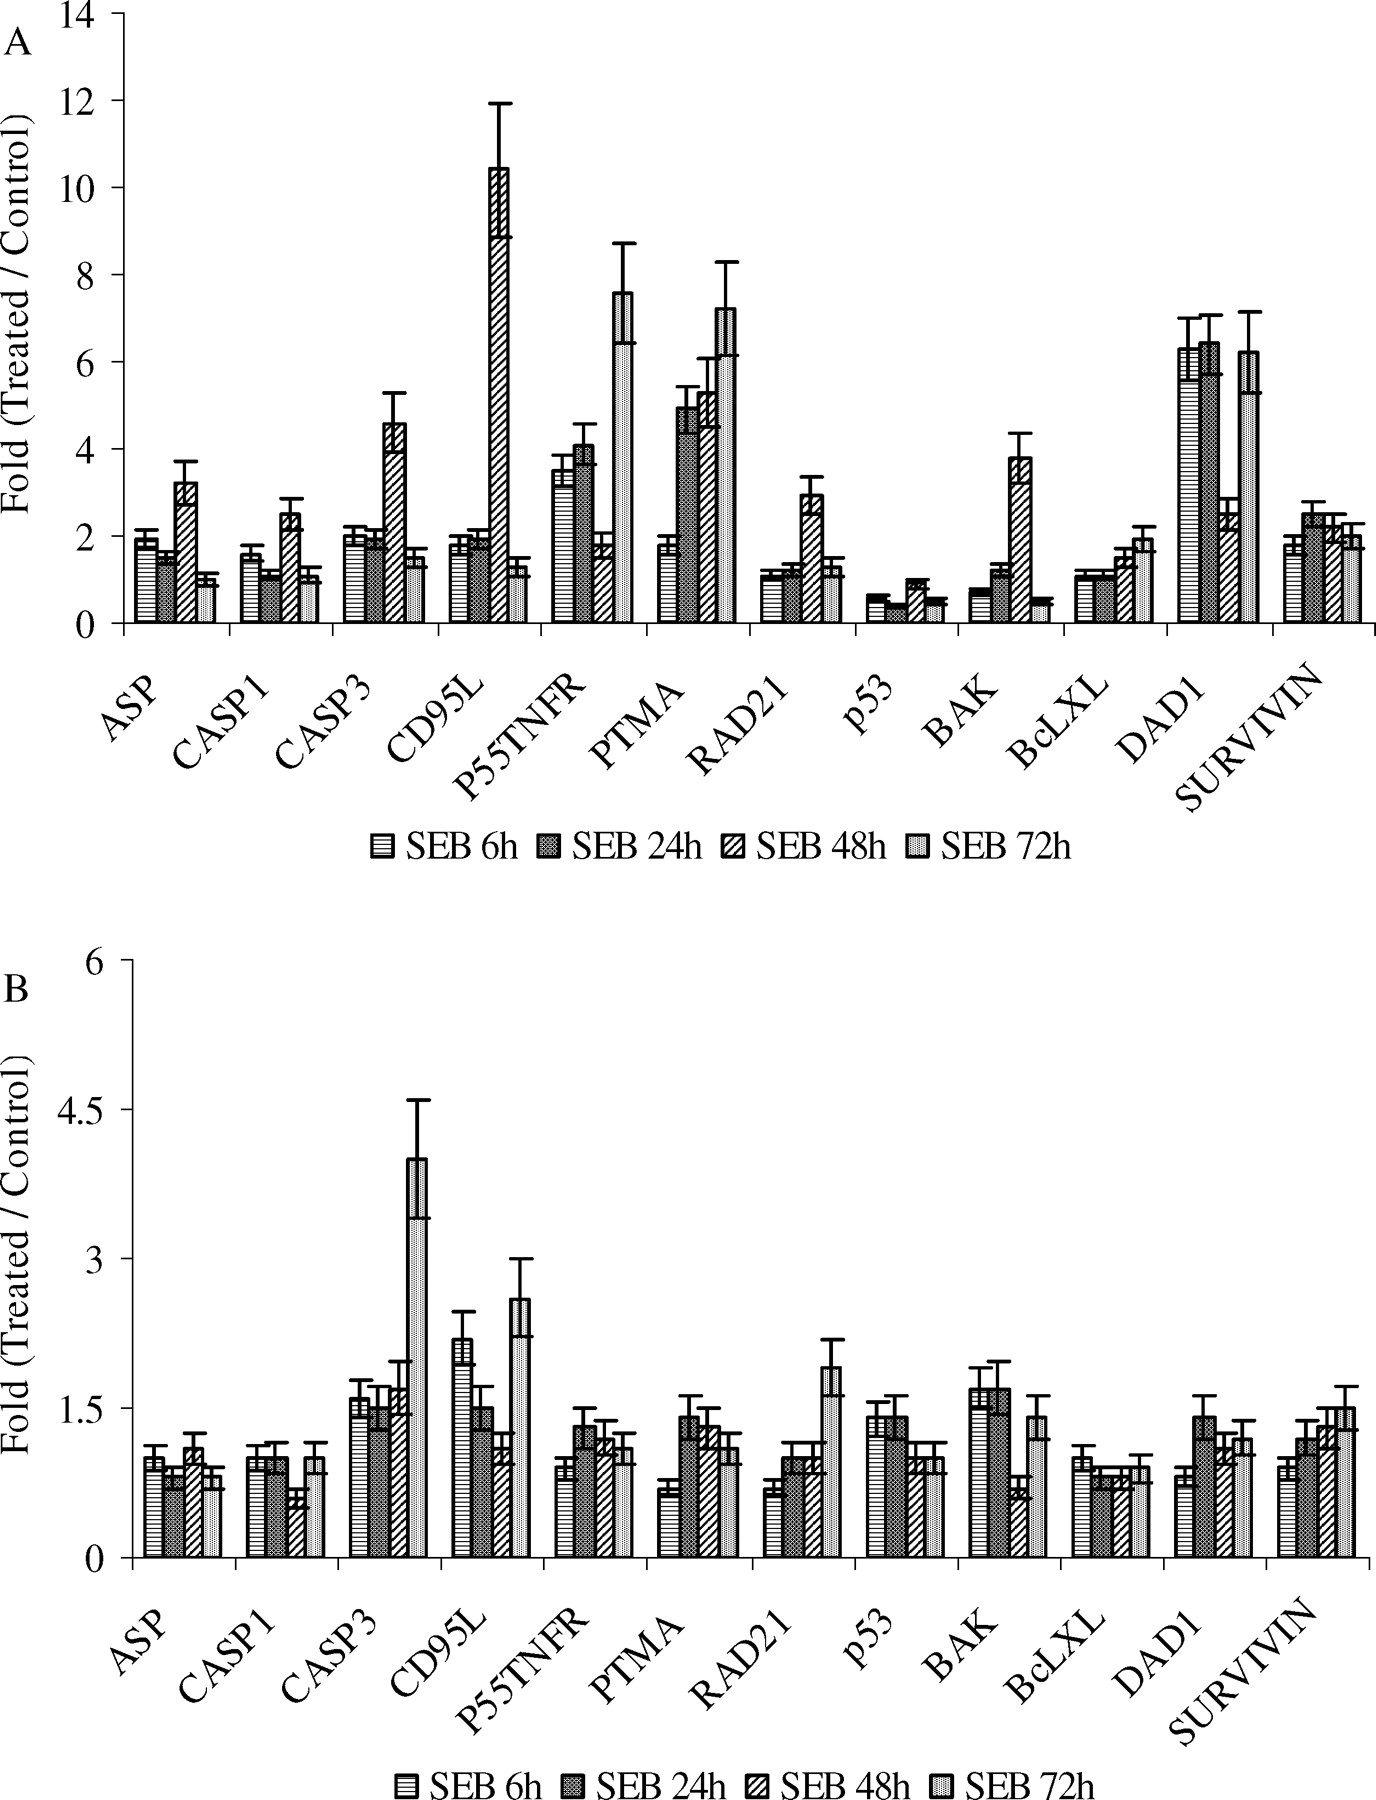
SEB-induced differential expression of pro-apoptotic and anti-apoptotic genes. RT-PCR was done with total RNA extracted from PBMC and spleen lymphoid cells, which was isolated from whole blood and spleens collected at 2, 6, 24, 48, and 72h after animals were treated with SEB or control. The deviation shown is the SD. ASP, apoptosis-specific protein; CASP3, caspase 3; p55TNFR1, p55 tumor necrosis factor receptor 1; CD95L, CD95 ligand; PTMA, prothymosin alpha; DAD1, defender against apoptotic death-1. Markers from PBMC are indicated in Panel A, while markers from spleen are indicated in Panel B.
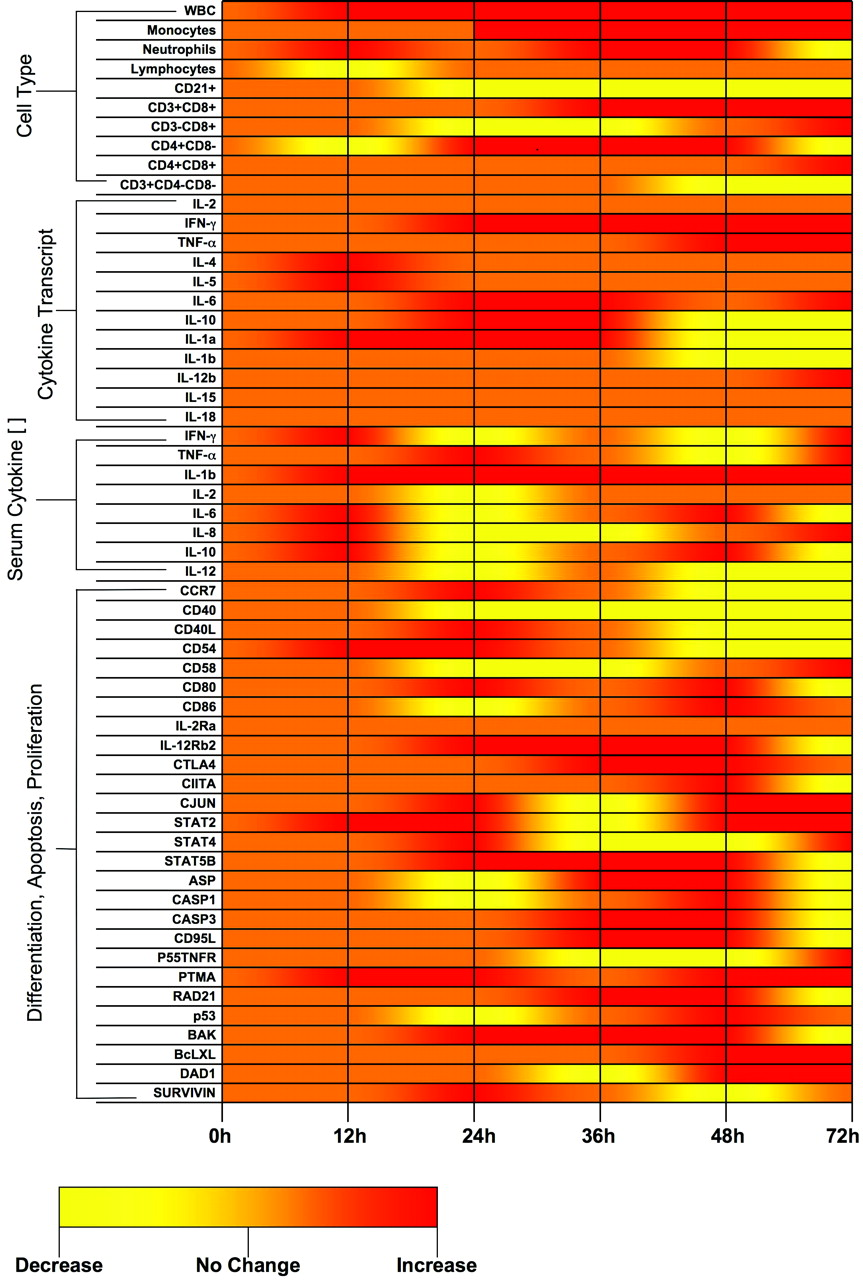
Cellular and molecular immune response to SEB summary. This graphic provides a qualitative summary of the data presented in this paper. The graphics depicted here are meant to highlight trends and should not be thought of as quantitative. Areas shaded “orange” indicate no change from baseline, while “red” indicates an increase and “yellow” a decrease.
Footnotes
Funding for this study was provided by the Defense Advanced Research Projects Agency (DARPA).
The views of the authors do not purport to reflect the position of the Department of the Army or the Department of Defense (Para 4–3) AR 360–5.
All animal use was carried out in accordance with AR 70–18, paragraph 12.d., in compliance with the Animal Welfare Act, adhering to the principles enunciated in The Guide for the Care and Use of Laboratory Animals.
Acknowledgements
The authors would like to thank Dr. Lawrence Tong for his review and suggestions in preparation of this manuscript.