



Abstract
Magnetic resonance imaging (MRI) and 1H magnetic resonance spectroscopy (1H-MRS) have been used in clinics for diagnosis of chronic liver diseases. This study was designed to investigate the relationship between MRI/MRS outcomes and the severity of liver damage. Of 50 patients examined, the MRI signal intensity in the globus pallidus as determined by pallidus index (PI) increased as the disease severity (scored by Child Pugh ranking) worsened (r = 0.353, P < 0.05). The changes in PI values were also linearly associated with Mn concentrations in whole blood (MnB) (r = 0.814, P < 0.01). MRS analysis of four major brain metabolites (i.e., Cho, mI, Glx, and NAA) revealed that the ratios of Cho/Cr and mI/Cr in cirrhosis and CHE patients were significantly decreased in comparison to controls (P < 0.05), whereas the ratio of Glx/Cr was significantly increased (P < 0.05). The Child Pugh scores significantly correlated with mI/Cr (−0.484, P < 0.01) and Glx (0.369, P < 0.05), as well as MnB (0.368, P < 0.05), but not with other brain metabolites. Three patients who received a liver transplant experienced normalization of brain metabolites within 3 months of post-transplantation; the MR imaging of Mn in the globus pallidus completely disappeared 5 months after the surgery. Taken together, this clinical study, which combined MRI/MRS analysis, autopsy exam and liver transplant, clearly demonstrates that liver injury-induced brain Mn accumulation can reversibly alter the homeostasis of brain metabolites Cho, mI and Glx. Our data further suggest that liver transplantation can restore normal brain Mn levels.
Introduction
Chronic liver diseases with the disease course lasting longer than half a year are comprised of chronic hepatitis (CH), alcoholic liver disease, cirrhosis, and liver cancer. In China, the major types of chronic liver diseases are due to chronic hepatitis type B infection and cirrhosis. According to the current estimation, the numbers of patients with chronic type B hepatitis and cirrhosis may have reached nearly 10 million in China (1). Many of these patients, due to the lack of timely and proper therapy, develop cirrhosis or liver cancer. Published studies estimate that about 25% of the cirrhosis cases have the clinical manifestation of chronic hepatic encephalopathy (CHE) with altered behavior, ataxia, tremor, disorientation, and, in severe cases, hepatic coma (1–4). The exact causes of CHE are unknown; however, substantial accumulations of toxic substances in the blood, which are normally eliminated by liver, may lead to their accumulation in brain and subsequently cause brain dysfunction. Traditionally in clinics, blood ammonia, a protein metabolic end product cleared by liver, has been suggested as a primary culprit in CHE (5). Nonetheless, recent studies indicate that a neurotoxic metal, manganese (Mn), may play a role in the etiopathology of CHE by acting in conjunction with ammonia on astrocytes as well as neurons (6, 7).
Mn is primarily eliminated from blood by the liver (8, 9). Excessive accumulation of this metal in brain does happen in persons who have been exposed to airborne Mn; the clinical signs and symptoms of Mn intoxication highly resemble those of Parkinson’s disease (10, 11). Since blood Mn is regulated by the liver, a damaged liver with decreased function can conceivably lead to the buildup of Mn in the blood and therefore in brain. Studies using magnetic resonance imaging (MRI) have revealed an abnormally high T1-weighted signal intensity in the brain globus palladium, expressed as palladium index (PI), among patients with severe chronic liver diseases (12, 13). Yet, the information on the changes of PI values as the function of the severity of liver damage is limited. While MRI studies among Chinese patients with chronic liver diseases are rare, Jin et al. reported a positive correlation between PI values and blood ammonia concentrations among 22 patients with acquired (non-Wilsonian) hepatocerebral degeneration (AHD) (14). The study, however, does not reveal whether and how the disease progression may affect the PI values among the patients.
Recently, the hydrogen proton magnetic resonance (1H-MRS) has been used to study the status of brain metabolites among CHE patients. Krieger and his colleagues reported a decline in choline compounds (Cho) and myo-inositol (mI) and an increase in glutamine/glutamic compounds (Glx) among CHE patients (15). Other studies have come to the similar conclusion (7, 16, 17). However, the correlation between the altered brain metabolites and the degree of hepatic damage has never been established. Even less is known about brain MRI and MRS outcomes among patients pre- and post- their receiving liver transplants.
The current study was designed to investigate whether MRI and 1H-MRI could be simultaneously used to reflect Mn accumulation in brain and changes in brain metabolites among patients with varying degrees of liver damage from minor chronic hepatitis (CH) to moderate cirrhosis and to severe CHE. In addition to MRI and MRS quantifications, the correlations between MRI/MRS outcomes and blood levels of Mn and ammonia were investigated. Moreover, MRI and MRS studies were performed among patients who have received a liver transplant in order to compare MRI and MRS outcomes in the same individuals before and after liver transplantation.
Subjects and Methods
Patients with Liver Diseases and Control Subjects.
A total of 50 patients with chronic liver diseases (44 males and 6 females) were recruited from a pool of patients admitted to the First Affiliated Hospital of Guangxi Medical University (GMU). The control group consisted of 20 healthy volunteers (13 males and 7 females). The mean ages were 41 years (range: 15–66) and 39 years (range: 21–65), respectively, for the patients and controls. The patients with chronic liver diseases were further divided into three groups. (i) The chronic hepatitis (CH) group had a total of 17 patients who suffered from liver disease for more than 6 months, were positive for hepatitis B virus surface antigen, demonstrated hepatic dysfunction by biochemical examinations, and showed clear clinical hepatitis symptoms. Of the patients in the CH group, 5 had persistent chronic hepatitis, and 12 had chronic active hepatitis. (ii) The patients in the cirrhosis group (n = 20) had clinically diagnosed cirrhosis, but without central nervous system (CNS) symptoms, and had no history of hepatic coma in the past. Among the cirrhosis patients, 2 were diagnosed as alcoholic cirrhosis and 18 as post-hepatitic cirrhosis. (iii) The chronic hepatic encephalopathy (CHE) group was comprised of 13 patients with clinically diagnosed severe chronic hepatitis or cirrhosis, accompanied by CNS symptoms. While all 13 patients had acute episodes of hepatic encephalopathy, 10 of these patients were in the prodromal period, and 3 suffered from the coma. Table 1 summarizes the demographic data of the study participants.
Prior to clinical examinations and MRI/MRS study, a written informed consent form was obtained from all study participants.
Clinical Examination and Liver Transplant.
The diagnoses were carried out by clinicians according to the clinical symptoms, physical signs, laboratory examinations, and results of computed tomography (CT) and ultrasound scans. In severe liver disease conditions, small pieces of liver tissues were obtained by needle biopsy and examined by certified pathologists in the clinical pathology department within the Hospital. The freshly biopsied tissue was fixed in 10% neutral buffered formalin. The fixed tissue was dehydrated in alcohol, cleared in xylene, and embedded in paraffin. About 6 μm sections were cut with a microtome, mounted to a glass slide, and then stained with Hematoxylin and Eosin according to the standard protocol (Fisher Scientific, Fair Lawn, New Jersey), and examined under a light microscope.
On the day when MRI and 1H-MRS were performed, a venous blood was collected from each study participant to determine the serum concentrations of Mn and ammonia.
A Child Pugh improved ranking (18) was used to evaluate the degree of liver damage. Accordingly, the chronic hepatitis group had 12 patients rated with Grade A, 4 patients with Grade B, and 1 patient with Grade C. The cirrhosis group had 1 patient with Grade A, 12 patients with Grade B, and 7 patients with Grade C. All 13 patients in the CHE group were rated Grade C (Table 1).
Three CHE patients eventually received liver transplants. The nodular cirrhosis was confirmed by pre-operational pathological examination. These patients were clinically examined with MRI/MRS along with other blood parameters 2 weeks prior to the surgery operations and were re-examined at 1, 3 and 5 months post-operation.
MRI and 1H-MRS Examinations.
MRI and 1H-MRS examinations were performed using a 1.5 T Signa superconduction system (Signa Horizon LX; GE Medical Systems, Milwaukee, WI, USA) with a quadrature T/R coil. Axial T1-weighted, T2-weighted, fluid attended inversion recovery (FLAIR), sagittal T1-weighted and diagonal coronal T1-weighted images, vertical to the long axis of hippocampal formation, as well as 1H-MRS data were obtained from each subject.
To obtain routine MRI data in the globus pallidus, the following parameters were used: for axial fast spin echo (FSE) T2-weighted images, repetition time (TR) = 4000 ms (millisecond), echo time (TE) = 102 ms, thickness = 8 mm, interslice gap = 2 mm; for axial T1 FLAIR, Tr = 2000 ms, TE =minimum, inversion time (TI) =750 ms, thickness =8 mm, interslice gap = 2 mm; for sagittal and coronal T1 FLAIR, TR = 2000 ms, TE = minimum, TI = 750 ms, thickness = 5 mm, interslice gap = 1 mm.
Upon obtaining brain T1-weighted images, the volume of interest (VOI) was located at symmetrical regions of bilateral occipital lobes and basal ganglia including the pallidal region with adjustments at 2 cm × 3 cm × 2 cm and 2 cm × 3 cm × 2 cm, respectively. For preliminary scans in spectra collection, the stimulated echo acquisition method (STEAM) sequence was applied with the following parameters: TR = 2000 ms, TE = 30 ms, stimulated times = 250. According to the water resonance frequency in preliminary scans, the computer automatically adjusted the impulse angle of collected sequences to obtain the optimal water-inhibition effect.
On the T1-weighted MR images of the brain axial surface, the pallidal index (PI) was calculated using the method reported earlier (19, 20). The PI is defined as the ratio of the signal intensity in the globus pallidus to that in the subcortical frontal white matter in axial T1-weighted MRI planes multiplied by 100. 1H-MRS data were analyzed using the Functool software, which comes with the equipment. The baseline and phases of obtained spectral line were adjusted to the same level, and the peak height of each metabolite was then obtained. The ratios of NAA/Cr, Cho/Cr, and so on were calculated by using the peak height of Cr as the reference (20).
To obtain 1H-MRS, the referred graphs of anatomical allocation were collected by using spin echo pulse sequences with the following parameters: TR =440 ms and TE =20 ms. The STEAM with the parameters of TR =2000 ms, TE =30 ms, and stimulated times =128 was applied to collect 1H-MRS. The point resolved spectroscopy (PRESS) was applied to collect sequences with the parameters of TR =1500 ms, TE =35 ms, stimulated times =64. The peaks of N-acetylaspartate (NAA), creatine (Cr), choline (Cho), glutamate/glutamine (Clx), inositol (mI) and lipids (Lip) detected by STEAM sequence were identified at 2.0, 3.0, 3.2, 3.78, 3.56, 0.9/1.3 ppm, respectively. Additionally, Glx peak heights in the metabolite peak height distribution curve were judged by the operator’s visual observation as: no Glx peak = 1, visible Glx peak = 2, and obviously visible Glx peak = 3.
Determination of Ammonia and Mn in Blood.
Ammonia levels in whole blood were determined by automated FUJI DRI-CHEM 100 diagnostic equipment (FUJI, Japan) with the kit of FUJI DRI-CHEM SLIDE NH3-W. The normal whole blood ammonia reference value was 10–60 μg/L. Blood levels of Mn were quantified by a model JY-70PII inductively coupled plasma-atomic emission spectrophotometer (ICP-AES, JY70P Type II, Jobin-Yvon Company, France). Aliquots (0.1 mL) of samples were diluted (5–20 fold) with an appropriate volume of 0.8% Triton X-100/0.5% EDTA in distilled, deionized water prior to ICP-AES analysis. The standard curves were established using metal standards freshly made on the day of analysis. The detection limit of this method was 0.3 ng/mL for Mn. The normal reference value of blood Mn level is between 0.03–0.10 μg/L of whole blood.
Statistical Analyses.
Records of interviews and other reports were reviewed and abstracted for demographic data. All data are expressed as the mean ± SD. Comparisons of means in Tables 1 and 2 were accomplished by using a one-way analysis of variance (ANOVA), and the comparison of Glx peak heights among control, CH, cirrhosis and CHE groups was analyzed by applying Kruskal-Wallis test for the ranked data. For data presented in Table 2, a repeated measure of the generalized linear model (GLM) was used to determine the significant differences between the groups. Linear regression analyses were applied to determine the relationship among MRI/MRS variables, Child Pugh scores and other parameters; the Pearson correlation coefficients were obtained accordingly. A statistical software SPSS/PC+for Windows (V. 13.0) was used in data analysis.
Results
Pathology of Liver Damage.
Figure 1 illustrates the histopathological results of livers from (A) a 45-year old control volunteer subject who died due to a motor vehicle accident, (B) a 48 year-old male patient with chronic viral hepatitis type B, (C) a 46 year-old male patient with cirrhosis, and (D) a 48 year-old male patient with CHE. The MRI and MRS data of these same study subjects are provided in the figures followed. Under the microscope, the hepatocytes of patient (B) showed cytoplasmic granularity, vacuolization, and damaged bile ducts in the portal triad region (Fig. 1B). Liver pathological diagnosis of patient (C) displayed portal cirrhosis with the parenchyma consisting of micro-nodules surrounded by dense strands of connective tissues (Fig. 1C). The CHE patients (Fig. 1D) exhibited extensive degeneration and necrosis of hepatocytes, collapse of fibrous skeleton of hepatic lobules, anomalous dodulars, generation of regenerative hepatocytes mass, and formation of pseudolobuli and nodular cirrhosis, all of which were much more severe than the pathology seen in patient (C).
MRI Analysis.
A total of 20 health volunteers and 50 patients underwent MRI and MRS examinations. Of the liver disease patients examined, 30 patients (60%) showed the high signal intensity in T1-WI MRI in the basal ganglia region, particularly in the globus pallidus, while T2-WI signals were normal. Figure 2 illustrates representative MRIs of patients from the four study groups. The signal intensity in the chronic hepatitis patient was not visible (Fig. 2B). However, an intensified signal in the globus pallidus was evident in the cirrhosis patient (Fig. 2C), and the most intensified signal was in the CHE patient (Fig. 2D). Interestingly, the PI values of control (1.01), chronic hepatitis (1.06) and cirrhosis (1.18) patients appeared to be increased as the disease status advanced (P < 0.05) (Table 2). The average PI values of CHE patients (1.16) were significantly higher than those of control subjects and CH patients (P < 0.01), but not different from those of cirrhosis patients (Table 2).
Correlation analysis within the cirrhosis and CHE patients (n =31, 2 of the total 33 patients were excluded for missing MnB values) revealed that the PI values linearly increased as the MnB increased; this correlation was statistically significant (r = 0.814, P < 0.01) (Fig. 3).
1H-MRS Analysis.
Further MR spectrum analysis of four major brain metabolites (i.e., Cho, mI, Glx, and NAA) did not reveal any significant differences between the control and chronic hepatitis groups. Representative spectra are shown in Figure 4. In the cirrhosis and CHE groups, the peak heights of Cho and mI were significantly decreased in comparison to controls (Fig. 4C, D, Table 2), whereas the Glx peak heights were significantly increased (Fig. 4D). Noticeably, an increased Glx peak was more common among CHE patients group than among cirrhosis patients.
When the changes in blood ammonia (BA) and MRI/MRS parameters were evaluated with respect to liver damage, the Child Pugh scores were significantly correlated with BA (0.365, P < 0.05), PI (0.353, P < 0.05), and Glx (0.369, P < 0.05). The Child Pugh scores were inversely correlated with mI/Cr (−0.484, P < 0.01). MnB significantly correlated with Child Pugh scores (0.368, P < 0.05) and PI values (0.693, P < 0.01), but it did not correlate to any other MRS parameters (Table 3).
MRI and 1H-MRS Changes Pre- and Post-Liver Transplant Surgery.
Among the CHE patients, 3 patients underwent the liver transplant surgery. A representative male case displayed pathological damage in liver (Fig. 1D), an increased T1-WI intensity in the globus pallidus (Fig. 2D), a decreased Cho and mI peak heights, and an increased Glx peak height (Fig. 4D). One month after the successful liver transplant, the patient was re-examined by MRI and MRS. His PI values appeared to be reduced (Fig. 5A) and the altered Cho, mI and Glx as determined by 1H-MRS appeared to return to the normal range (Fig. 5B). Five months after the liver transplant, the T1-WI signal in the globus pallidus disappeared completely, and all Cho, mI and Glx returned to normal (Fig. 5C, D). It should be pointed out that all 3 liver transplant patients showed very similar progress in brain MRI and MRS examinations.
Discussion
This large human clinical study (50 patients including 3 liver transplants) combines MRI/MRS analysis, pathological examination and liver transplant and, for the first time in literature, compares MRI and MRS outcomes in the same individuals before and after liver transplantation. The study clearly demonstrates that Mn accumulation in brain, due to severe liver damage, can reversibly alter the homeostasis of brain metabolites such as Cho, mI and Glx. Moreover, our data suggest that liver transplantation can restore brain Mn levels shortly after the patients’ hepatic function returns to normal. From the toxicological point of view, this study raises a novel question of whether the welders or smelters who are routinely exposed to airborne Mn and who have simultaneously suffered from liver disorders may be more vulnerable to Mn-induced parkinsonian syndromes.
Mn, as an essential trace element in the human body, is tightly regulated by the liver. While tissue retention of Mn is rather persistent, its blood half-life is relatively short (i.e., < 2 hours) (8, 9, 21). This is due primarily to an effective hepatic clearance of Mn, since more than 99% of a dose of Mn is eliminated in the feces by hepatic biliary excretion (8). Consequently, damaged hepatic function would be expected to slow down Mn clearance with an ensuing buildup of Mn in the body including a primary target organ of Mn toxicity—the brain. In fact, human autopsy studies on donors who died due to hepatic failure have revealed that patients suffered from cirrhosis or hepatic coma exhibited increased Mn concentrations not only in globus pallidus, putamen and caudate nucleus but also in frontal cortex by 38–300% as compared to normal Mn values in controls by conventional atomic absorption spectrophotometry (22, 23). Similarly, in T1-weighted MRI studies of welders and smelters known to be exposed to airborne Mn (19, 24–26), the noninvasive MRI technique has revealed an enhanced signal in the globus pallidus of patients with cirrhosis and chronic hepatic encephalopathy; a good correlation has been established between the increased pallidus signal and blood concentration of Mn (15, 27–29). The data presented in the current report are in a good agreement with these literature reports. Moreover, we discovered that the increased PI values not only correlated directly with blood Mn concentrations, but also with the severity of liver damage as determined by pathologic Child Pugh grading and by blood ammonia levels. Hence, it is evident that the increased PI is due to the failed hepatic clearance of Mn and increased Mn body burden among severe hepatic disease patients.
Interestingly, the patients who underwent the liver transplantation in this study showed a progressive reduction of PI in the globus pallidus, suggesting that a reversal of brain Mn levels could happen shortly after restoration of normal hepatic functions. This observation is similar to a literature report by Kim et al., where a welder with clinical manifestations of manganism showed a symmetrical high signal intensity in the globus pallidus (30); the intensity, however, nearly completely disappeared 6 months after the patient discontinued welding. Noticeably, Naegele et al. reported a complete recovery of the abnormal PI values between 10–20 months post-transplantation in 21 patients who successfully received liver transplant (17). It is, therefore, clear that brain Mn levels are not independent of systemic Mn homeostasis, but rather they are controlled by liver function. Any damage to hepatic function would likely increase the individual’s susceptibility to Mn neurotoxicity. This leads to a novel question, that is, whether or not those welders or smelters who are routinely exposed to airborne Mn and who simultaneously suffer liver disorders may be more vulnerable to Mn-induced parkinsonian syndromes. The answer to this question would be of interest to Mn neurotoxicological investigators.
It should be pointed out that the use of MRI to detect liver encephalopathy has its own limitations. Our own data show that while the damaged livers among CH, cirrhosis and CHE patients caused significantly higher PI values than in controls, the PI values failed to distinguish cirrhosis from CHE patients; the latter indeed exhibited the manifested encephalopathy. It is possible that the calculated PI values may not be sensitive enough within a rather small window (1.01–1.21). Yet, it is also possible that the accumulation of Mn in the globus pallidus may not be the sole cause of the hepatic encephalopathy. Further studies should be conducted to investigate whether increased brain Mn levels indeed contribute to the encephalopathy.
1H-MRS in this study indicates likely disease severity-associated declines of Cho and mI and an increase in Glx, three principle metabolic markers in brain. Choline (Cho) is the precursor of acetylcholine and phospholipidoyl choline. The status of Cho is known to be associated with memory and cognitive activity (with acetylcholine) and myelin sheath integrity (with phospholipidoyl choline) (31, 32). The nucleoside inosine (mI) participates in purine metabolism and maintains osmotic pressure and membrane integrity. A decline in the MRS ratio of mI/Cr has been associated with several degenerative diseases (33–35). While the ratios of Cho/Cr and mI/Cr appeared to progressively decline from the control subjects to CH and cirrhosis and further to CHE patients, the Child Pugh class scores were only significantly associated with mI/Cr. Noticeably, the average mI/Cr ratio in CHE patients was about 40% of that in control subjects. Clearly, the hepatic encephalopathy is partly due to damaged membrane integrity.
The neuroactive molecule Glx (glutamate and glutamine), on the other hand, increased significantly as the liver condition worsened (Child Pugh scores). In two CHE cases, patients exhibited cerebral symptoms; yet their blood ammonia levels were in the normal range. These 2 patients, however, had significantly increased Glx signals in 1H-MRS. It may be too early to predict whether the Glx peak could be a better indicator than blood ammonia to reflect the severity of brain damage. More studies in this area are warranted.
At present, it remains unknown if the alteration in the brain metabolites during hepatic encephalopathy is due to increased Mn levels in the brain or due to other causes. The blood Mn levels among patients are significantly associated with PI but not with any of brain metabolites. Among subjects known to be exposed to airborne Mn, only one study can be found in the literature reporting on changes in brain metabolites. In that study, Kim et al. (36) (2007) performed 1H-MRS and MRI among 20 male welders and 10 matched controls and found no significant differences between the welders and the controls in NAA/Cr, Cho/Cr, and NAA/Cho ratios obtained from the basal ganglia. Yet, they indicated that the NAA/Cr ratio in basal ganglia among Mn-exposed welders may reflect the cumulative effects of Mn exposure. From the toxicological point of view, our study provides the evidence to support a direct relationship between the altered brain metabolites and increased brain Mn in the hepatic encephalopathy.
Although the changes in Cho/Cr, mI/Cr, and Glx are suggestive of an altered brain structure due to severe liver damage, this alteration was apparently reversible. In patients who received liver transplants, the recovery of abnormal metabolites to normal levels after successful surgery usually occurred earlier than that of the globus pallidus MRI intensities. The ratios of Cho/Cr, mI/Cr, and Glx peaks returned to normal usually within 1–3 months after transplantation, during which the symptoms of hepatic encephalopathy gradually disappeared. However, at the same time, the PI intensity by T1-WI remained detectable, and the blood Mn concentrations in patients were still higher than normal. Thus, it appears likely that 1H-MRS of brain metabolites may be more sensitive than the MRI PI signal in estimating the psychiatric symptoms of hepatic encephalopathy.
In summary, the current study suggests that liver damage severity is associated with the accumulation of Mn in brains of patients. Changes in brain metabolites as detected by 1H-MRS may be sensitive markers for clinical monitoring of brain dysfunction. Further studies are needed to investigate whether Mn accumulation in brain is related to altered brain metabolites.
Summary of Demographic Data Among Control and Patients with Liver Diseases a
Comparison of MRI and 1H MRS Data Among Control and Patients with Liver Diseases
Correlation Coefficients by Linear Regression Analysis

Pathology of representative liver biopsy tissues. Tissues were obtained via a biopsy needle. H&E staining was conducted. (A): An autopsy liver tissue from a 45-year-old control subject who died from motor vehicle accident; (B): a biopsy tissue from a 48-year-old male patient with chronic viral hepatitis type B with HBsAg (+), HBcAg (−), HCV (−); (C): a biopsy tissue from a 46-year-old male patient with micronodular cirrhosis in active stage; (D) a biopsy tissue from a 48-year-old male patient with chronic hepatic encephalopathy, nodular cirrhosis evident in active stage. (×100). A color version of the figure is available in the online journal.

Representative MRI of liver disease patients and control subjects. (A): Axial T1-WI MRI from a 37-year-old male control subject; (B): axial T1-WI MRI of patient B in Figure 1B, very weak signal intensity in globus pallidus; (C): axial T1-WI MRI of patient C in Figure 1C, the signal intensity in globus pallidus visible; (D): axial T1-WI MRI of patient D in Figure 1D, strong signal intensity in globus pallidus.
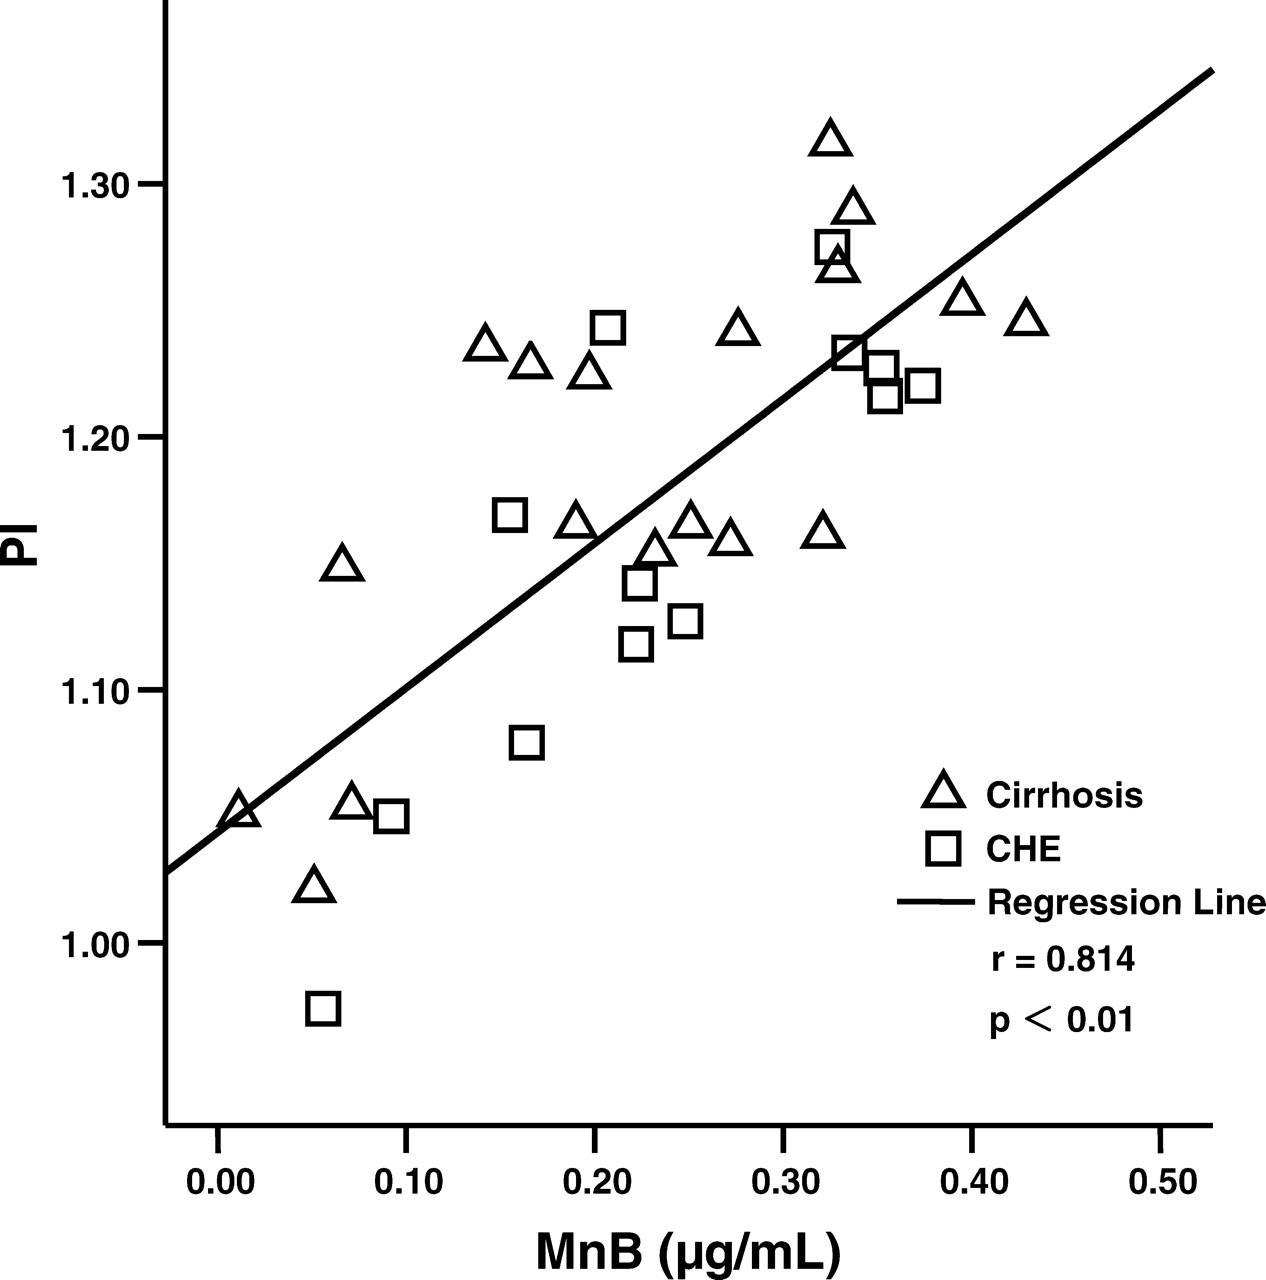
Changes in PI values as a function of MnB levels. Data (n = 31) were analyzed by correlation and linear regression analyses. Correlation coefficient (r) = 0.814, P < 0.01.

Representative 1H-MRS of liver disease patients and control subjects. (A): MRS from a 55-year-old female control subject; (B): MRS of patient B in Figure 1B; (C): MRS of patient C in Figure 1C, decreased Cho and mI and increased Glx can be seen; (D): MRS of patient D in Figure 1D, apparently decreased Cho and mI and increased Glx. NAA, N-acetyl aminosuccinic acid; Cho, choline compounds; Cr, total creatine; mI, myo-inositol; ppm, part per million.
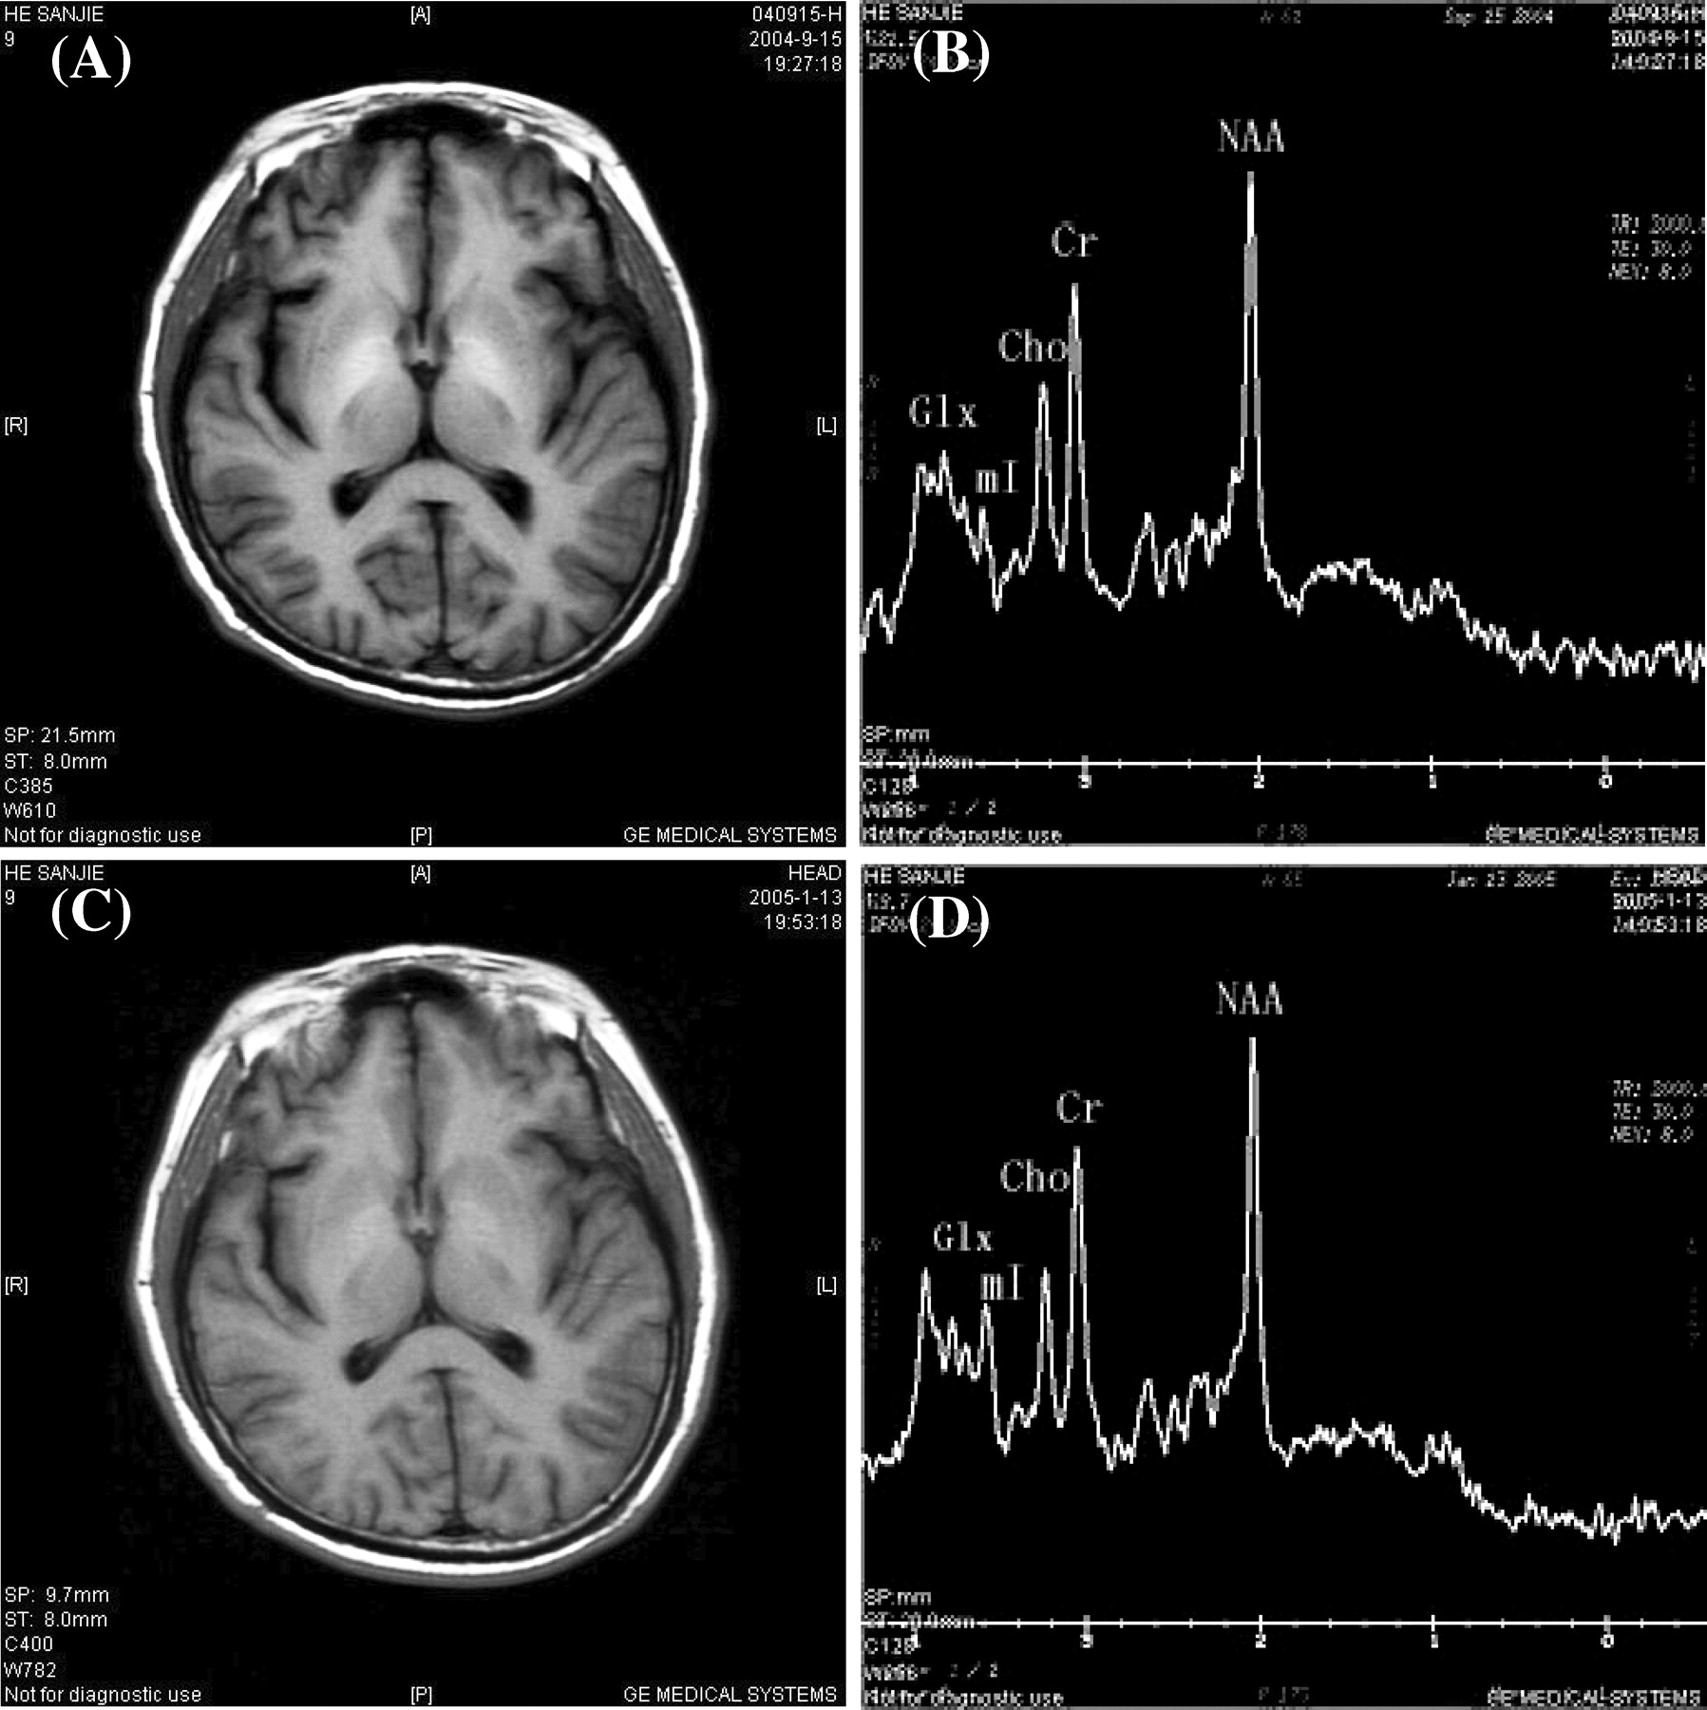
Representative MRIs of a liver disease patient in Figure 1D, Figure 2D and Figure 4D, 1-month and 5-month post-liver transplant surgery. (A) T1-WI MRI 1 month after surgery; (B): MRS 1 month after surgery, lower Cho and mI peaks and higher Glx peak; (C): Ti-MRI 5 months after surgery; (D) MRS 5 months after surgery.
Footnotes
This study was partly supported by National Science Foundation of China Grant #30070663 (YMJ), Guangxi Science and Technology Commission Grant #0443004–42 (YMJ), U.S. NIH/National Institute of Environmental Health Sciences Grant #ES-08164 (WZ), and U.S. Department of Defense Contract #USAMRMC W81XWH-05-1-0239 (WZ).
Acknowledgements
The authors thank Dr. Gary Carlson of Purdue School of Health Sciences for proofreading this article.