




Abstract
Background:
Sleep disturbances frequently affect Alzheimer’s disease (AD), with up to 65% patients reporting sleep-related issues that may manifest up to a decade before AD symptoms.
Objective:
To construct a nomogram that synthesizes sleep quality and cognitive performance for predicting cognitive impairment (CI) conversion outcomes.
Methods:
Using scores from three well-established sleep assessment tools, Pittsburg Sleep Quality Index, REM Sleep Behavior Disorder Screening Questionnaire, and Epworth Sleepiness Scale, we created the Sleep Composite Index (SCI), providing a comprehensive snapshot of an individual’s sleep status. Initially, a CI conversion prediction model was formed via COX regression, fine-tuned by bidirectional elimination. Subsequently, an optimized prediction model through COX regression, depicted as a nomogram, offering predictions for CI development in 5, 8, and 12 years among cognitively unimpaired (CU) individuals.
Results:
After excluding CI patients at baseline, our study included 816 participants with complete baseline and follow-up data. The CU group had a mean age of 66.1±6.7 years, with 36.37% males, while the CI group had an average age of 70.3±9.0 years, with 39.20% males. The final model incorporated glial fibrillary acidic protein, Verbal Fluency Test and SCI, and an AUC of 0.8773 (0.792–0.963).
Conclusions:
In conclusion, the sleep-cognition nomogram we developed could successfully predict the risk of converting to CI in elderly participants and could potentially guide the design of interventions for rehabilitation and/or cognitive enhancement to improve the living quality for healthy older adults, detect at-risk individuals, and even slow down the progression of AD.
INTRODUCTION
Alzheimer’s disease (AD), as the leading cause of dementia, is so far one of the most fatal, costly, and burdensome issues to the healthcare system [1]. Generally, preventive interventions following early identification of at-risk individuals for AD may provide an opportunity to delay or avoid the onset of severe cognitive impairment [2]. Studies with moderate to high levels of evidence have shown that sleep disorders are associated with a higher risk of all-cause dementia or cognitive impairment [3]. In turn, sleep disorders and related abnormalities are common in patients with AD, as around 65% of patients with AD reported having at least one sleep-related disorder [4]: they often experience alterations in sleep architecture and sleep-wake cycle which result in sleep disturbances such as elevated sleepiness during daytime, sundowning (agitation during nighttime), and insomnia [5]. Moreover, compared to their normal healthy peers, patients with AD have more disruptions in night-time sleep [6]. A bidirectional interaction has been demonstrated between sleep disturbances and crucial pathophysiological biomarkers of AD such as amyloid-β (Aβ) concentration, Aβ plague formation, and phosphorylated tau protein (p-tau) tangle formation [7, 8]. Nevertheless, these previous studies utilized positron emission tomography (PET) scan or cerebrospinal fluid (CSF) extraction, both of which have inherent limitations of high cost and low accessibility.
In comparison, blood-based AD pathophysiological biomarkers have lower operation costs and higher accessibility [9]. Previous studies have demonstrated the diagnostic predictability of plasma biomarkers on AD pathological progression including Aβ42/40, p-tau, and neurofilament light (NfL) [10, 11], yet very few of them included plasma biomarkers and other measurements such as cognitive performance. Excitingly, in the 2023 AAIC, a new biomarker categorification was introduced for staging and AD prognosis: biomarkers of inflammatory/immune processes (I), currently only reflected by fluid, e.g., plasma or CSF glial fibrillary acidic protein (GFAP) [12]. In the present study, we aim to integrate data on plasma biomarkers (including Aβ, p-tau, NfL, and GFAP), cognitive function performance, and overall sleep quality in predicting AD pathological progression. To further evaluate the overall sleep quality, we hereby proposed a composite indicator named Sleep Composite Index (SCI). The goal of SCI was to capture the comprehensive sleep disturbances in both nighttime rest and daytime sleepiness in patients with AD.
To construct a statistical prediction model, a nomogram has been widely accepted as a reliable tool for its ability to quantify the risk of clinical outcomes [13, 14]. By combining a patient’s profile and the statistic model, a nomogram can provide individualized assessment and prediction. In conjunction with its user-friendly graphical presentation, the nomogram could be used during clinical encounters for disease prognosis, thus aiding in clinical decision-making [14]. Based on a Chinese multicenter cohort study, the present study aims to construct a nomogram that synthesizes sleep quality and cognitive performance, and plasma biomarkers for predicting cognitive impairment (CI) conversion outcomes.
MATERIALS AND METHODS
Study population
The study was part of the Sino Longitudinal Study on Cognitive Decline (SILCODE), an ongoing prospective cohort study [15], which centers on Xuanwu Hospital in cooperation with an alliance of 94 hospitals from 50 cities in China. Specific inclusion/exclusion criteria can be found at https://www.clinicaltrials.gov/ct2/show/study/NCT03370744). From a total of 2,763 patients, clinical information, neuropsychological assessments, blood samples, and imaging data were collected between January 2010 and December 2022. Both the baseline assessment and the first follow-up assessment were performed at Xuanwu Hospital, and the follow-up interval for each patient was one year. The study was approved by the Ethics Committee of Xuanwu Hospital of Capital Medical University and conducted in accordance with ethical standards. All participants provided written informed consent and authorized the publication of their clinical details. SILCODE is listed on the ClinicalTrials.gov registry (SILCODE: NCT03370744). A study flowchart is presented in Fig. 1.
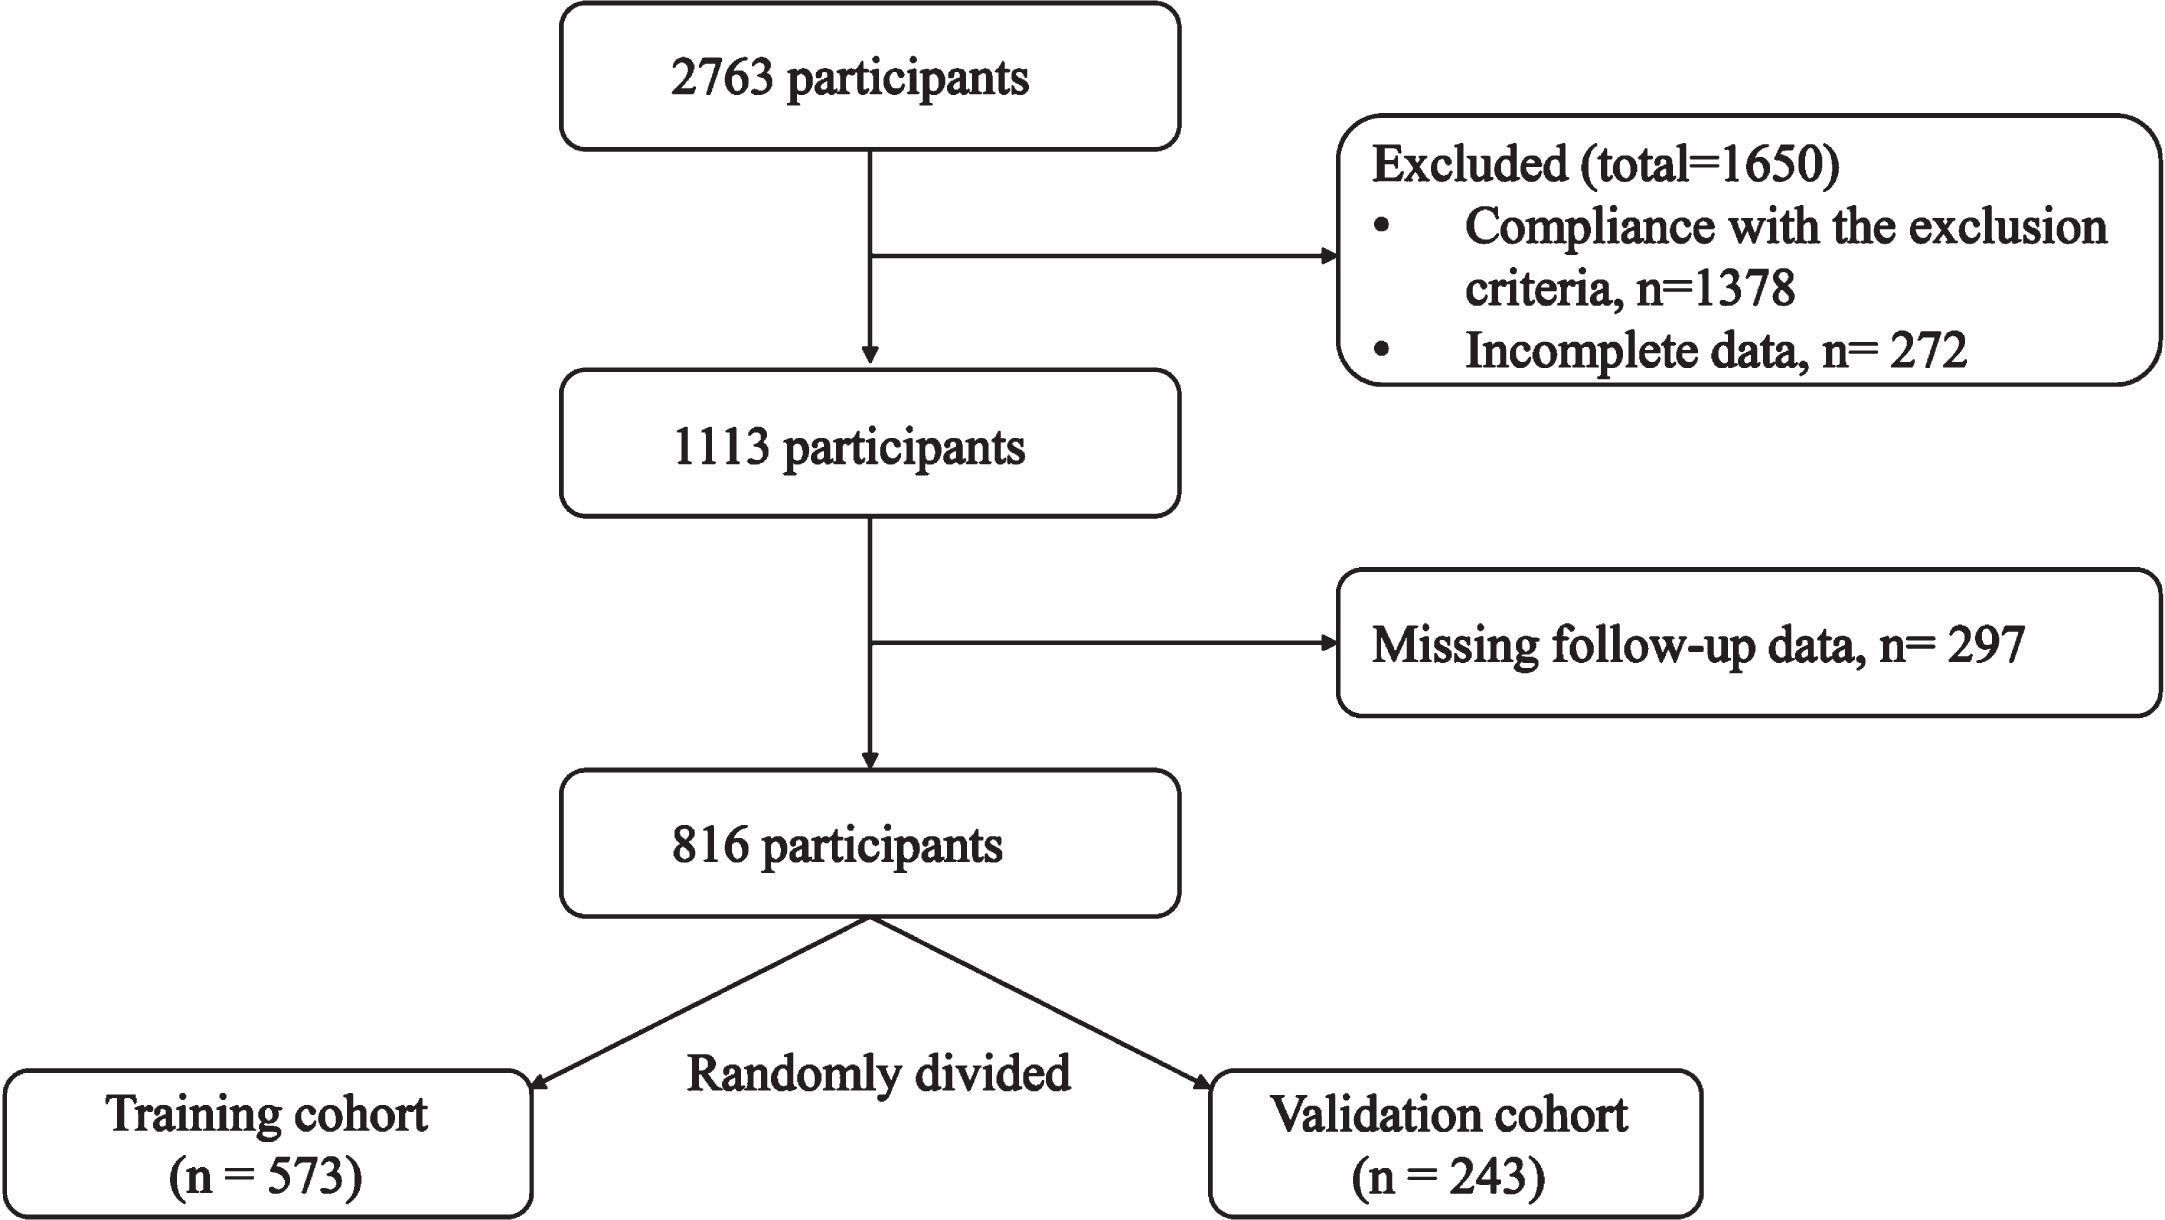
The flow chart of this study.
Data collection
Demographical data were collected including age, sex, number of years of education, as well as clinical data of history of hypertension, diabetes, hyperlipidemia, and coronary heart disease. General cognitive performance was measured by the Mini-Mental State Examination (MMSE) and the Chinese version of the Montreal Basis for Cognitive Assessment (MoCA-BC) [16]. To measure impairment in specific cognitive domains, performance in other neuropsychological measurements was also collected: 30-minute delayed free recall in Auditory Verbal Learning Test (AVLT) and AVLT recognition task [17], Verbal Fluency Test (VFT-animal) [18], sections A and B in the Shape Trail Test (STT-A and STT-B) [19]. Scores in Pittsburg Sleep Quality Index (PSQI), REM Sleep Behavior Disorder Screening Questionnaire (RBDSQ), and Epworth Sleepiness Scale (ESS) were collected to evaluate sleep quality, sleep disturbances, REM sleep behavior disorder (RBD), and daytime drowsiness.
In SILCODE, the Single Molecule array (Simoa) p-tau181 Advantage Kit was used to measure P-tau181 concentration, and the Simoa Human Neurology 4-Plex E (N4PE) assay (Quanterix) was used to measure Aβ40, Aβ42, NfL, and GFAP concentrations. All measurements for the five analytes were above the detection limit, and the intra-assay variation coefficient was less than 10%. The data was then matched to phenotype information.
Constructing the Sleep Composite Index
We carefully selected three measurements that are clinically and academically widely used as components for SCI, namely PSQI [20], RBDSQ [21], and ESS [22]. Based on scores in the PSQI, RBDSQ, and ESS, a multivariate logistic regression analysis was used to build the SCI as a composite indicator reflecting an individual’s overall sleep situation. In detail, SCI was supposed to measure the quality of nighttime sleep, REM (sleep behavioral disruptions, and tendencies of daytime sleepiness.
Variable selection and the sleep-cognition model construction
Our predictive model was developed using R software (version 4.1.2). Results obtained by the COX regression and variables considered meaningful in previous studies were used to build the initial prediction model which was then optimized using bidirectional elimination. Based on the results, optimal predictors were selected to build the predictive model using COX regression (adjusted for age, education, and sex) to predict five-, eight-, and twelve-year event-free conversion probabilities [23], which would be presented in the form of a nomogram.
Model performance and clinical utility
We assessed the model performance through two separate characteristics: discrimination and calibration. The discriminative ability of the model denotes its effectiveness in differentiating converters from non-converters and was assessed by the area under the estimated ROC curve (AUC) [24]. Model calibration refers to the level of agreement between model predictions and observed outcomes. Akaike information criterion (AIC) [25] and Bayesian information criterion (BIC) [26] were used in model selection and to assess the model’s calibration: a lower AIC or/and BIC value indicates proper calibration. Further, we used the calibration curve and Hosmer-Lemeshow test to evaluate the agreement between the predicted and observed outcomes, and for a well-calibrated model, we expected the predicted outcomes to fall on the 45-degree bisector in the calibration plot [27]. Finally, we used the Decision Curve Analysis (DCA) to quantify the net benefit to patients at different threshold probabilities, thereby evaluating the clinical utility of the model [28]. p > 0.05 was considered calibrated.
Statistical analysis
Data normality was verified by the Shapiro–Wilk test. Continuous variables were presented as the mean±standard deviation (for normally distributed data) or median [interquartile range, IQR] (for non-normally distributed data) and as the frequency [percentage] (for categorical variables). Differences between groups were examined using Student’s t-test or Mann–Whitney test for continuous data, and Chi-square test or Fisher’s exact test for categorical data. Statistical analyses were performed using R software (version 3.4.3) and statistical significance was defined as a two-tailed p-value<0.05.
RESULTS
Clinical and demographic characterization
Table 1 displays the demographic and clinical data of the participants. Except for CI individuals at baseline, a total of 816 participants with baseline and follow-up visits were included in the present study, and randomly divided into a training cohort and a validation cohort by a ratio of 7 : 3. In the Whole population, Training cohort, and Validation cohort, the ages of the patients were 67.14±7.61, 67.12±7.58, and 67.21±7.68 years old, respectively. The proportion of males was 37.08%, 37.52%, and 36.27%, respectively. There were also no significant differences between the Training cohort and Validation cohort on cognitive performance-related scales or sleep scales (p > 0.05). The overall follow-up time was 4.73±2.95. The training and validation cohorts were comparable in terms of demographic and clinical characteristics (p > 0.05).
Demographic and clinical characteristics
MMSE, Mini-Mental State Examination test; AVLT-N5, Auditory Verbal Learning Test-Huashan version long-delayed free recall (20 min); AVLT-N7, AVLT-Huashan version long-delayed recognition (20 min); STT-A, Shape Trail Test A; STT-B, Shape Trail Test B; VFT, Verbal Fluency Test (animal); BNT, Boston Naming Test; GDS, Geriatric Depression Scale; MoCA-B, Montreal Cognitive Assessment Scale; PSQI, Pittsburg Sleep Quality Index; RBDSQ, REM Sleep Behavior Disorder Screening Questionnaire; ESS, Epworth Sleepiness Scale; SCI, Sleep Composite Index; NfL, neurofilament light chain; GFAP, glial fibrillary acidic protein.
Constructing Sleep Composite Index
To comprehensively measure individual’s overall sleep quality from perspectives of nocturnal sleep quality and daytime drowsiness, we carefully selected three measurements that are clinically and academically widely used as components for SCI, namely PSQI, RBDSQ, and ESS, which respectively evaluate sleep quality, sleep disturbances, RBD, and daytime drowsiness. A multivariate logistic regression analysis was applied to build the SCI as a composite indicator reflecting an individual’s overall sleep situation. In detail, SCI was supposed to measure the quality of nighttime sleep, REM, sleep behavioral disruptions, and tendencies of daytime sleepiness. The formula for calculating the SCI is shown below: Sleep Composite Index = –3.914221 + PSQI * 0.0555522 +RBDSQ*0.7287495 + ESS * 0.0660809.
Variable selection and the sleep-cognition model construction
After calculating the SCI score, we used the median as the threshold to include the SCI as a dichotomous variable in the following steps. Then, we used bidirectional elimination to refine the model and selected the most optimal predictors: GFAP, VFT, and SCI. Finally, with a COX regression, the optimal model was constructed incorporating the said three significant variables to predict five-, eight-, and twelve-year event-free CI conversion probabilities. At the same time, three factors were identified as important independent risk factors for CI conversion: GFAP (HR = 1.018, 95% CI: 1.006 to 1.031, p = 0.020), VFT (HR = 0.862, 95% CI: 0.758 to 0.981, p = 0.024), and sleep (HR = 4.372, 95% CI: 1.057 to 18.080, p = 0.042).
The optimal model is presented in a nomogram (Fig. 2). In the nomogram, the points scale ranges from 0 to 100, and the corresponding point of each predictor can be obtained by projecting its own value to the point scale, all of which then sum up as the total points. By drawing a vertical line from the total points scale to the bottom three risk lines, the risk of converting to CI in 5, 8, and 12 years can be estimated. For the only categorical variable SCI, 0 indicates a decent overall sleep quality and 1 indicated a poor overall sleep quality, corresponding to the points of 44 and 75 on the points scale, respectively. Figure 2 shows the calculation for one randomized participant, and with a total point at 207, the risk of converting to CI for this patient in 5, 8, and 12 years was estimated to be at 41.1%, 75.4%, and 86.2%, respectively.
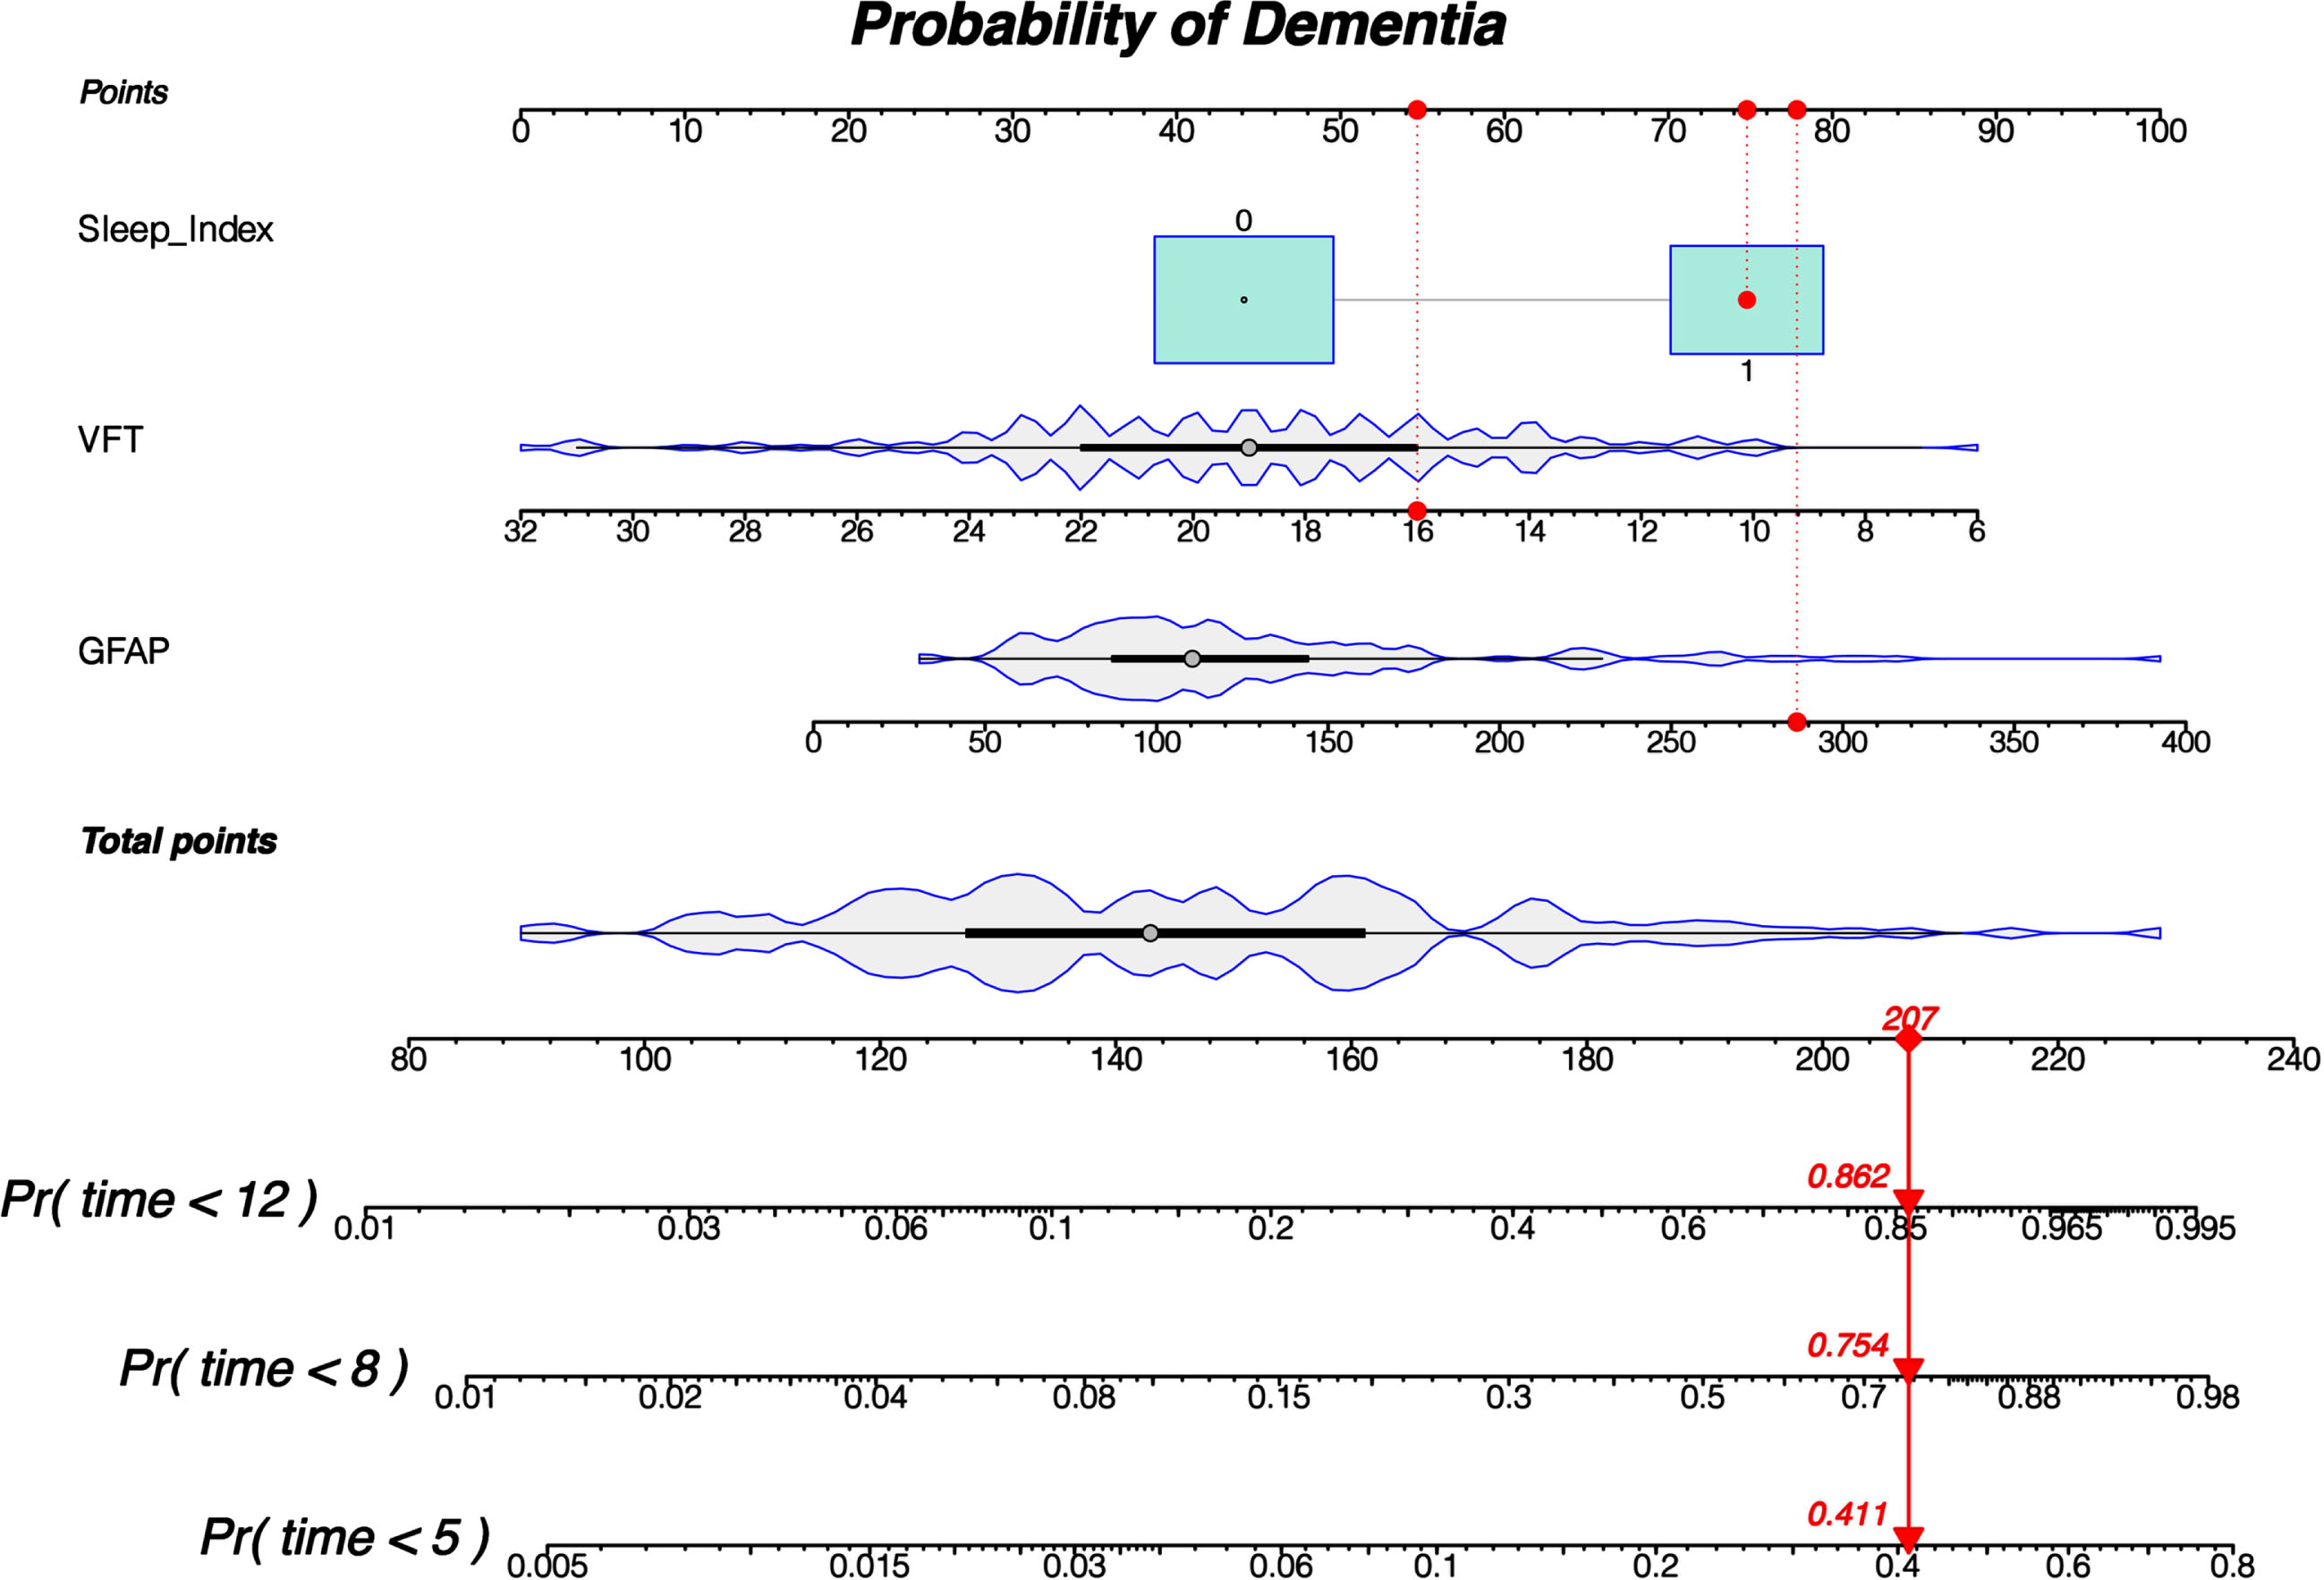
The nomogram shows the calculation of the final probability of the adverse outcome (CU converting to CI) in 5, 8, and 12 years. A total point needs to be firstly determined based on the value of individual predictors using the nomogram: a vertical line was drawn from each predictor’s line to the “points” line to obtain an individual predictor point, all of which were then summed up to the aforementioned total point. Then, another vertical line was drawn from the “total points” lines to the bottom three risk lines, getting the probability of converting to CI in 5, 8, and 12 years, respectively.
Model performance and clinical utility
In optimal model (GFAP + VFT + SCI), the AIC, BIC, and AUC were 70.367, 82.515, and 0.8773 (0.792–0.963) respectively, with the AIC being at 75.114, BIC being at 87.262, and AUC being at 0.809 (0.652–0.966). For reference, we also analyzed the predicting ability of models incorporating four common biomarkers (Aβ42/40, P-tau181, GFAP, and Nfl) and SCI (Table 2). The ROC curves for training and validation model (GFAP + VFT + SCI) predicting the CI conversion in 5, 8, and 12 years are displayed in Fig. 3A and 3B, where the results of AUC for all three are excellent, suggesting a great performance of the said model at distinguishing between the at-risk and non-risk individuals. The DCA of the nomogram suggested that it produced a significant net benefit at most threshold probabilities in the training cohort, especially between 0∼70% (12 years) (Fig. 3C), with a similar performance in the validation cohort, between 0∼60% (12 years) (Fig. 3D). Finally, in the calibration analysis, the observed and predicted conversion were well calibrated with the use of nomograms in both the training and validation cohorts (Fig. 4A, B).
Assessing predicting ability among different models
1The model optimized by bidirectional elimination.; 2The model selected by COX regression.

A, B) ROC curves using the nomogram to predict CI transitions at 5, 8, and 12 years for the training and validation sets, respectively. C, D) Decision curve analyses using nomograms to predict CI transitions in the training and validation cohorts at 5, 8, and 12 years, respectively. The graph plotted the net benefit against threshold probability. The gray line represents the treatment-for-all scenario in which all patients would transform to CI, and the thin black line represents treatment-for-none scenario in which no patient transforms to CI. The net benefit was calculated by subtracting the proportion of all false-positive patients from the proportion of true positives, weighted by the loss brought by no treatment to CI and unnecessary treatment.

Calibration plot of the optimal model in training (A) and validation (B) cohort. The actual observed rate of conversion is shown on the y-axis, and the nomogram-predicted probability of conversion is shown on the x-axis.
DISCUSSION
The present study developed a nomogram for predicting the risk of CI conversion in the Chinese population. Compared to using a single predictor that has limited prediction ability and may be subject to other factors, a nomogram incorporating various predictors enables individualized prediction and aids in the clinical decision-making process, ultimately promoting personalized treatment and generating greater net benefits for patients. To the best of our knowledge, the present study is the first to develop a nomogram integrating sleep quality, cognition performance, and plasma biomarkers as composite indicators in predicting an individual’s future risk of CI conversion. Compared to a traditional multivariate logistic regression analysis method, the present study applied the COX regression for variable selection and bidirectional elimination for further optimization. The ultimate goal of a nomogram is to help clinicians and patients estimate an individual’s need for additional interventions. Therefore, to demonstrate its clinical utility, a DCA was used to assess whether decision-making using the nomogram would improve patient prognosis. Our results showed that, when using the nomogram to predict the conversion risk in 12 years, the threshold probability was 0–70%, meaning that all patients could benefit from it at varying levels. Implementing interventions within this threshold could bring more benefits over intervention for all or intervention for none. Therefore, patients with high nomogram pretest results should undergo preclinical monitoring for AD as soon as possible.
In our study, we opted for a composite Sleep Composite Index (SCI) score instead of utilizing the individual variables PSQI, RBDSQ, and ESS for several reasons. The composite SCI offers a more holistic evaluation, considering multiple factors simultaneously and providing a comprehensive assessment of the patient’s condition. This approach minimizes the potential for multicollinearity among variables, enhancing the accuracy and reliability of statistical models. By consolidating the variables into a single score, we address this concern and further support the robustness of our analysis. While the computational cost of using three variables may not be significantly higher, practical considerations, such as the complexity and time involved in collecting and managing multiple variables in real-world settings, favor the use of a composite score. Streamlining the assessment process, a single composite score reduces the burden on data collection and management. Although it is technically feasible to train a prediction Cox model using the three variables directly, our objective is to develop a more practical risk assessment tool for clinical use. Condensing multiple variables into a single score enhances the usability and accessibility of our method. Notably, the three variables (PSQI, RBDSQ, and ESS) independently predicted the transition to dementia, focusing on reactive sleep, sleep quality, sleep disturbance, RBD, and daytime sleepiness. However, these indicators contribute differently to dementia transformation. The comprehensive coefficient obtained by combining the three indicators allows us to explore the weighted influence of the SCI on dementia transformation. This approach recognizes that some individuals, despite experiencing insomnia or poor nighttime sleep quality, may offset the adverse impact on dementia transformation by supplementing daytime sleep.
Previous studies have shown that sleep disorders are associated with the development of cognitive dysfunction even before the clinical onset of dementia. A community-based study discovered the association between delayed and reduced sleep-wake cycles and the likelihood of developing dementia [29]. Similarly, at 1-year follow-up, age-related sleep fragmentation was found to be associated with a 5.6-fold increased risk of developing dementia [30]. In our optimal model, SCI was calculated using scores from PSQI, RBDSQ, and ESS, all of which are considered important measurements in past research on AD. A total PSQI score larger than 5 is considered poor sleep quality, which was found to be associated with increased cerebrospinal fluid t-tau at baseline [30]. Specifically, a shorter sleep duration was associated with higher concentrations of cerebrospinal fluid p-tau and t-tau biomarkers, and on average, merely 1 h of sleep deprivation was associated with the accumulation of pathological tau protein [30]. Although this statistically significant association was only observed in one sleep duration group (6–7 h), it remained present in the analysis using dichotomous sleep durations (>7 h versus < 7 h) [30]. However, some studies came up with different evidence: no significant correlation was found between total PSQI score and plasma biomarker concentrations, and there was no significant difference in plasma biomarker concentrations between good (PSQI total score≤5) and poor (PSQI total score > 6) sleep quality [31]. In the research of AD and RBDSQ, a previous study found that smaller pineal parenchymal volume in AD patients is associated with increased symptoms of RBD (assessed by RBDSQ) [32]. An in vitro study on rat pineal glands has confirmed that Aβ peptides directly inhibit pineal melatonin synthesis and impair the melatonergic system, leading to a neuroinflammatory response within the gland [33]. Consequently, reduced melatonin production due to pineal atrophy caused by damages from Aβ may also indirectly increase the risk for RBD or exacerbate RBD symptoms in AD patients by decreasing the protection of the cholinergic system against Aβ toxicity [34]. Moving on to ESS, a longitudinal cohort study showed that sleepiness is associated with doubling the risk of developing dementia [30], suggesting that daytime sleepiness is also a predisposing factor for dementia. A study using ESS showed that higher levels of daytime sleepiness were associated with greater impairments of functional status, which was not only associated with impaired cognitive functioning but also with impaired functioning in patients with AD [35].
Another component in our optimal model is VFT, a common measurement used to assess cognitive performance. The results of a study by Gustavson et al. [36] showed that semantic fluency (animals and fruits) independently predicts the progression to amnestic mild cognitive impairment in cognitively normal males, suggesting that study aiming to identify at-risk individuals for mild cognitive impairment (and later dementia) may consider utilizing the predictive power of verbal fluency tests.
Compared to CSF biomarkers, blood-based biomarkers are minimally invasive, safe, less costly, and more available. Importantly, blood-based biomarkers may be useful for evaluating an individual’s eligibility for treatment and monitoring the effectiveness of AD treatment [37]. Our results showed that plasma GFAP was not only a significant predictor in the nomogram but also an independent risk factor for CI conversion. Similarly, in a study exploring the effects of acute sleep deprivation on diurnal plasma dynamics of central nervous system biomarkers in young men, researchers observed a significant 12.1% decrease in plasma GFAP from evening to morning (p < 0.001) [38]. In addition to GFAP, according to our results, the difference in plasma Aβ42/40 and plasma pTau-181 concentrations between Converters and non-converters was marginally significant. Also, plasma NfL concentration was significantly higher in Converters than non-Converters, once again suggesting the possibility that sleep deprivation may lead to neuraxial damage. Previous studies have shown that Aβ clearance in the brain parenchyma is highly dependent on the glymphatic system regulated by the sleep-wake cycle: compared to awake mice, Aβ was cleared twice as fast in sleeping mice [39]. Additionally, a study of eight males aged 30–60 years found that scheduled sleep deprivation resulted in an approximately 42% increase in cerebrospinal fluid concentrations of Aβ30, Aβ38, and Aβ40 [40]. However, another study found no change in plasma Aβ42/40 ratios after 1 night of sleep deprivation in a healthy population [41]. Similarly, in the present study, no significant difference in plasma Aβ concentrations between groups was found in our long-term follow-ups. Considering previous studies, there is a lack of evidence indicating peripheral Aβ peptides change in response to sleep deprivation, suggesting that measurements of peripheral Aβ biomarkers may be less accurate in reflecting changes in the central nervous system due to sleep deprivation. In another study, plasma concentrations of T-tau, GFAP, and NfL increased during the day and T-tau decreased significantly at night, suggesting the clearance during sleep, possibly through lymphatic fluid or CSF, although different changes in the said biomarkers were observed in other cohorts [31]. The above evidence suggests that certain AD biomarkers exhibit diurnal variation that may be independent of sleep, providing theoretical support to use SCI to reflect the combination of daytime and nighttime conditions.
The findings of the present study have to be seen in light of some limitations. First, participants were not screened for obstructive sleep apnea, a disease that was found to be associated with brain Aβ deposition [42]. Second, the present study constructed the nomogram based on a longitudinal study with a relatively small sample size, so further validation using a larger sample is needed.
In conclusion, the nomogram integrating sleep quality and cognitive performance could successfully predict the risk of converting to CI in elderly participants. Notably, our optimal model suggests that the risk of converting to CI would be greatly increased in CU individuals with poor sleep quality. As a result, research in sleep may guide the interventions for rehabilitation and/or cognitive enhancement to improve the living quality of healthy older adults, detect at-risk individuals, and even slow down the progression to CI.
AUTHOR CONTRIBUTIONS
Xianfeng Yu (Writing – original draft); Shuqing Deng (Writing – original draft); Junxin Liu (Writing – review & editing); Mingkai Zhang (Data curation); Liang Zhang (Writing – original draft); Ruixian Li (Data curation); Wei Zhang (Writing – review & editing); Ying Han, Ph.D. (Funding acquisition; Supervision).
Footnotes
ACKNOWLEDGMENTS
The authors have no acknowledgments to report.
FUNDING
This study was supported by the National Natural Science Foundation of China (Grant 61633018, 82020108013).
CONFLICT OF INTEREST
The authors have no conflict of interest to report.
DATA AVAILABILITY
The data supporting the findings of this study are available on request from the corresponding author. The data are not publicly available due to privacy or ethical restrictions.