
Abstract
Using an index fund is a popular strategy that is designed to simulate the behavior of a market index and obtain the excess return that is more stable than other mutual funds. In setting up an index fund, investors must first choose a small number of stocks and then assign a weight to each selected stock. However, with traditional methods, investors hardly determine how well the designed index fund can mimic the market index. The main objective of this paper is to demonstrate the improvement of index fund performance by using a multi-objective optimization algorithm that can assign weights automatically.
Introduction
Since the introduction of index funds over 40 years ago, they have become popular investing tools that are designed to simulate market indices. Moreover, they are generally considered to be more stable compared to other mutual funds. Setting up a perfect index fund entails including all stocks in the market; however, it can be difficult to achieve this in actual practice. Therefore, a typical index fund consists only of a few stocks, while still replicating the behavior of the indices.
Investors set up an index fund by first selecting a few stocks and then assigning weights to these stocks in a process called “asset allocation.” Traditionally, investors select stocks with higher market capitalization. This is because many market indexes, such as the Taiwan Capitalization Weighted Stock Index (TAIEX), are weighted by market values. Stocks can also be selected by ranking system risk Betas (Rudd, 1980) or by algorithms (e.g., Kwiatkowski, 1992; Jeurissen, 2005; Jeurissen, 2008).
At present, value-, price-, and equal-weighted portfolios are the most popular asset allocation options available. However, such methods are not directly related to the imitation of market behaviors, so it could be difficult to determine the extent of the similarity with the market. In comparison, more sophisticated methods have been used to design an objective function (or functions), after which mathematical approaches or evolutionary algorithms are employed to optimize their portfolios (e.g., Beasley et al., 2003; Dose and Cincotti, 2005; Oh et al., 2005; Rafaely and Bennell, 2006; Andriosopoulos et al., 2013; Chen and Yang, 2020).
In the past years, most algorithms considered only a single objective function. Faced with a problem of achieving multiple goals simultaneously, Beasley et al. (2003) proposed to weigh various objective functions and obtain their sum directly. Guided by the basic assumption that each objective function can be compared, weights are used to determine the importance of each objective function. In this case, the weights can be used to represent relative importance. However, this assumption is too strong for practical problems (Ni and Wang, 2013). Thus, in recent years, some authors tried to avoid this assumption by using multi-objective (e.g., a combination of tracking error, transaction cost, or excess return) optimization algorithms to deal with index tracking problems (e.g., Chiam et al., 2008; Chiam et al., 2013; Filippi et al., 2016). However, the most popular objective function (i.e., tracking error) can be divided by at least two components, namely, portfolio variance and covariance between a portfolio and its corresponding benchmark [e.g., Eq (5)]. In other words, tracking error itself is a weighted-sum objective function; therefore, it is actually unable to avoid the weighted-sum assumption at all.
The main purpose of the current study is to utilize the multi-objective optimization algorithm called non-dominated sorting genetic algorithm II or NSGA-II (Deb, 2002) with three objective functions to construct a Taiwanese stock index fund that can imitate market behavior and obtain excessive return. The three objective functions include portfolio return, portfolio variance, and covariance between the portfolio and its corresponding benchmark. We selected 30 stocks as components following traditional stock selection methods, such as choosing 30 of the most market capitalized stocks, or by individually choosing the most market capitalized stocks in an industry and then allocating assets with various methods.
Literature review
Index tracking problems have been studied for a long time. The methodologies used by past studies can be roughly classified into two categories: factor models and optimization.
The factor model refers to regressing the return of an individual stock on macro- or micro economic factors. For example, the single-factor model or CAPM is a simple model that regresses an individual stock’s return on the stock index return. In this case, the system risk of that individual stock is referred to as the regression coefficient beta. Using the factor model method, stocks are selected so that the sum of their beta equals 1. To achieve this, the behavior of that portfolio will be synchronized with the market index (when one regresses the market index return on the market index return itself, the coefficient must be 1). Rudd (1980) proposed a method to prevent excessive transaction costs by rebalancing and to integrate transaction costs into the factor model. Corielli and Marcellino (2006) employed a dynamic factor model to calculate the weights of component stocks.
In comparison, the optimization methods are first used to select a few stocks and objective functions, specify constraints, and then calculate the weights of the selected stocks by computational algorithms. Beasley et al. (2003) and Dose and Cincotti (2005) both considered a linear combination of excess return and tracking error as the objective function, from which they designed an evolutionary algorithm to solve the tracking problem. Oh et al. (2005) considered minimizing the variance of the portfolio beta and designed a genetic algorithm to track Korea Stock Price Index 200. Rafaely and Bennell (2006) used the squared difference between the market value of a portfolio and a market index as the objective function, after which they designed a genetic algorithm to track Financial Times Stock Exchange 100.
Meanwhile, Andriosopoulos et al. (2013) considered a linear combination of excess return and root mean squared error as the objective function to track Baltic Dry Index and Baltic Dirty Tanker Index via a genetic algorithm. Ni and Wang (2013) employed a heuristic search method to modify a genetic algorithm and considered tracking error, excess return and variance of tracking error as three objective functions. Then, they proposed to tackle the incompatible problem of objectives by designing a goal programming method. Meanwhile, Chiam et al. (2008) explored the use of a tri-objective optimization problem and designed an evolutionary multi-objective algorithm to solve such a problem. In another study, Chiam et al. (2013) considered minimizing the tracking error and the total amount of transaction costs simultaneously, after which they used a multi-objective evolutionary algorithm (i.e., MOEITO) to solve the tracking problem in a rebalancing context. Finally, Filippi et al. (2016) attempted to maximize the excess return and minimize the absolute deviation between an index and a portfolio, after which they designed a bi-objective mixed integer linear programming algorithm to solve the tracking problem with integer constraints.
Methodology
Problem description and objective functions
As previously mentioned, how to set up an index fund is viewed as an optimization problem. In the literature, several objective functions have been mentioned, such as variance of beta, excess return, and tracking error; their definitions are listed in Equations (1)–(3), respectively. Meanwhile, the information ratio (IR) is also a measurement of portfolio returns beyond the returns of a benchmark, usually an index; its definition is shown in Equation (4).
In the equations above, r p is the portfolio return, r m is the market return, cov(.) is the covariance function, var(.) is the variance function, and E(.) is the expected value and std(.) is the standard deviation.
A mathematical model can be used to present the problem of optimizing the index fund. Here we use IR as the objective function, and then rewrite Equation (4) to Equation (5) according to the theorem of probability. The whole optimization problem is shown in (P1) below.
In the equations above,
The constant part does not have to be considered in solving an optimization problem, because they are all the same in any possible solutions; thus, the expected value and the variance of the market return can be ignored. The objective function of (P1) is a nonlinear combination of three objective functions, which is not easy to optimize; nevertheless, this can be simplified. The three objectives of Equation (9) are as follows: (1) maximizing the return on portfolio returns, (2) minimizing the variance of portfolio returns, and (3) maximizing the covariance of portfolios and market returns. The first two goals are the mean-variance principle in the modern investment theory proposed by Markowitz (1952), while the third goal aims to imitate market behavior.
First proposed by Deb et al. in 2002, the NSGA-II optimizes multi-objective functions to overcome the limitations of traditional genetic algorithms (GAs) (i.e., a single objective function). Like GAs, the NSGA-II is still based on the evolutionary mechanism of the imitation of nature. Through genetic mechanisms, such as selection, crossover, and mutation, good genes are passed to the offspring and result in the evolution of many generations. The NSGA-II also has a fast sorting method and an elite strategy to effectively reduce the evolution time and to ensure the diversity of the evolutionary population. Typically, there is no single feasible solution that can simultaneously minimize all objective functions. Instead, there are solutions that cannot be improved in any of the objectives without degrading at least one of the other objectives; these are called “Pareto optimal solutions” (Deb et al., 2002). The steps of the entire NSGA-II are briefly described as follows: Initialization: Here, the genes on the chromo-some are defined, after which a set of chromosomes (i.e., solutions) of the initial population is randomly generated. Non-dominated sorting: The ranks for the objective function values of all solutions are defined, which are used to determine the dominating order. Then, the crowding distance for solutions is calculated on the non-dominated leading edge, in which the larger the distance, the greater the likelihood that the solution will be preserved. Selection: The degrees of diversity for all solutions are calculated. Then, the higher part is retained, and the lower part is eliminated to form a new generation. Crossover: After selecting better chromosomes, the information on the chromosomes, such as the mating behavior of nature, are exchanged to form new chromosomes. Mutation: Through the random variation of chromosomes, gene mutation can avoid being “stuck” in the local optima. Iteration and end: The new solutions are produced generation by generation. The evolution process of the NSGA-II stops only when the preset ending conditions are fulfilled. Then, the best chromosomes can be obtained.
Empirical results
Computation environment
The experimental environment of this study is as follows: the operating system is 64-bit version of Windows 8, the central processing unit is Intel® CoreTM i7-4770 3.4GHz, the memory is 32 GB, and the program is written by the Eclipse IDE in Java programming language. The GA and the NSGA-II are implemented with the free programming library JGAP and jMetal, respectively. The GA evolved 500,000 generations per run, and a single evolution run took 40 minutes. The NSGA-II evolved 50 million generations per run and consumed a similar length of time as the GA.
Data
This study took the daily returns of all stocks in the Taiwanese stock market and TAIEX between 1991 and 2013 from a database maintained by the Taiwan Economic Journal. Meanwhile, the missing daily returns are replaced with zeroes for stocks with non-trading days (e.g., merger or capital reduction).
In this study, 30 stocks were selected by following two stock selection methods according to data from the previous year. For example, we ranked stocks based on the 2012 market values and selected the top 30 stocks to set up the 2013 portfolio. To set up the index fund, the weights of stocks were calculated by simple weighting methods, GA, or NSGA-II. Furthermore, the ceiling of a weight for each stock was set at 10% to avoid the investment portfolios being too concentrated on a single stock. The objective functions to be tested are as follows: variation of Beta, i.e., Equation (1); IR, i.e., Equation (5); the linear combination of the three objectives of Equation (9), i.e., Equation (10); and the three objectives function, i.e., Equation (9)
We also formed equal-weighted portfolios as benchmarks without objective functions. This was achieved by weighting stocks equally (i.e., 1/30) and by value-weighting portfolios through the weighting of stocks based on a calculation of each stock’s relative value compared to the sum of all selected stocks. Table 1 presents a list of all stock selection and asset allocation pairings.
14 Index Fund Strategies
Tables 2 and 3 present the average performances of the 14 strategies with various stock selection and asset allocation pairings from 1992–2013, respectively. As shown in Table 2, the 7th strategy seems to be the best in terms of an IR or excess return. For the tracking error, the 2nd strategy is the best, although its excess return is bad. The results show that the NSGA-II can indeed set up a better index fund than by using linear or nonlinear combination methods, such as the 5th and 6th strategies, respectively. In addition, Figure 1 shows the average values of IR for various allocation methods with the “market” selection method. As can be seen, the performance of the 7th strategy is the best throughout the year. Finally, Table 3 and Figure 2 show similar patterns for various allocation methods with the “industry” selection method.
The average performances for the “market” stock selection method with various asset allocation methods from 1992 to 2013
The average performances for the “market” stock selection method with various asset allocation methods from 1992 to 2013
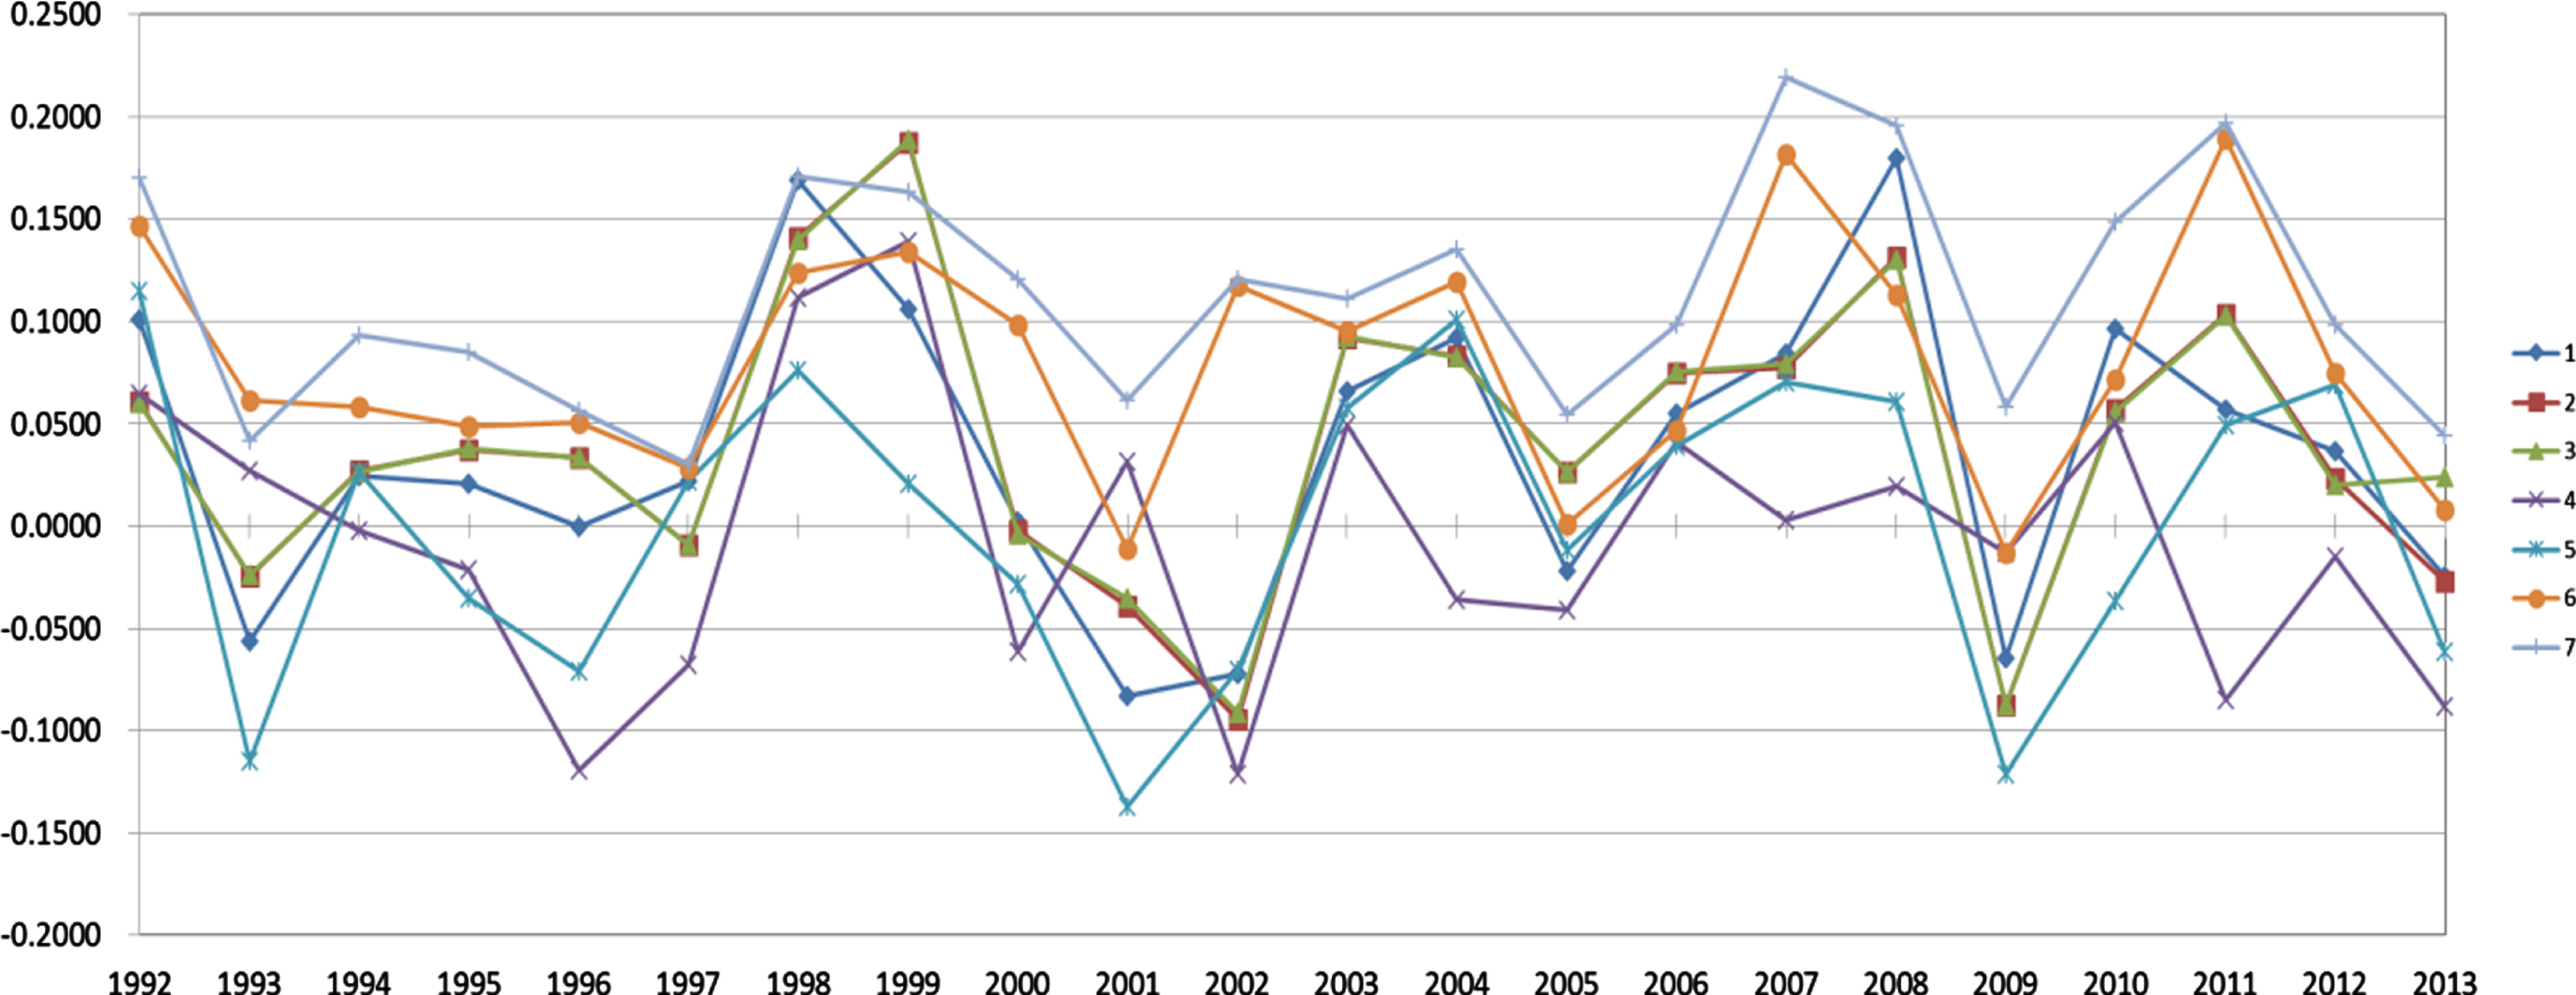
The performances of information ratio for the “market” stock selection method with various asset allocation methods from 1992 to 2013.
The average performances for the “industry” stock selection method with various asset allocation methods from 1992 to 2013
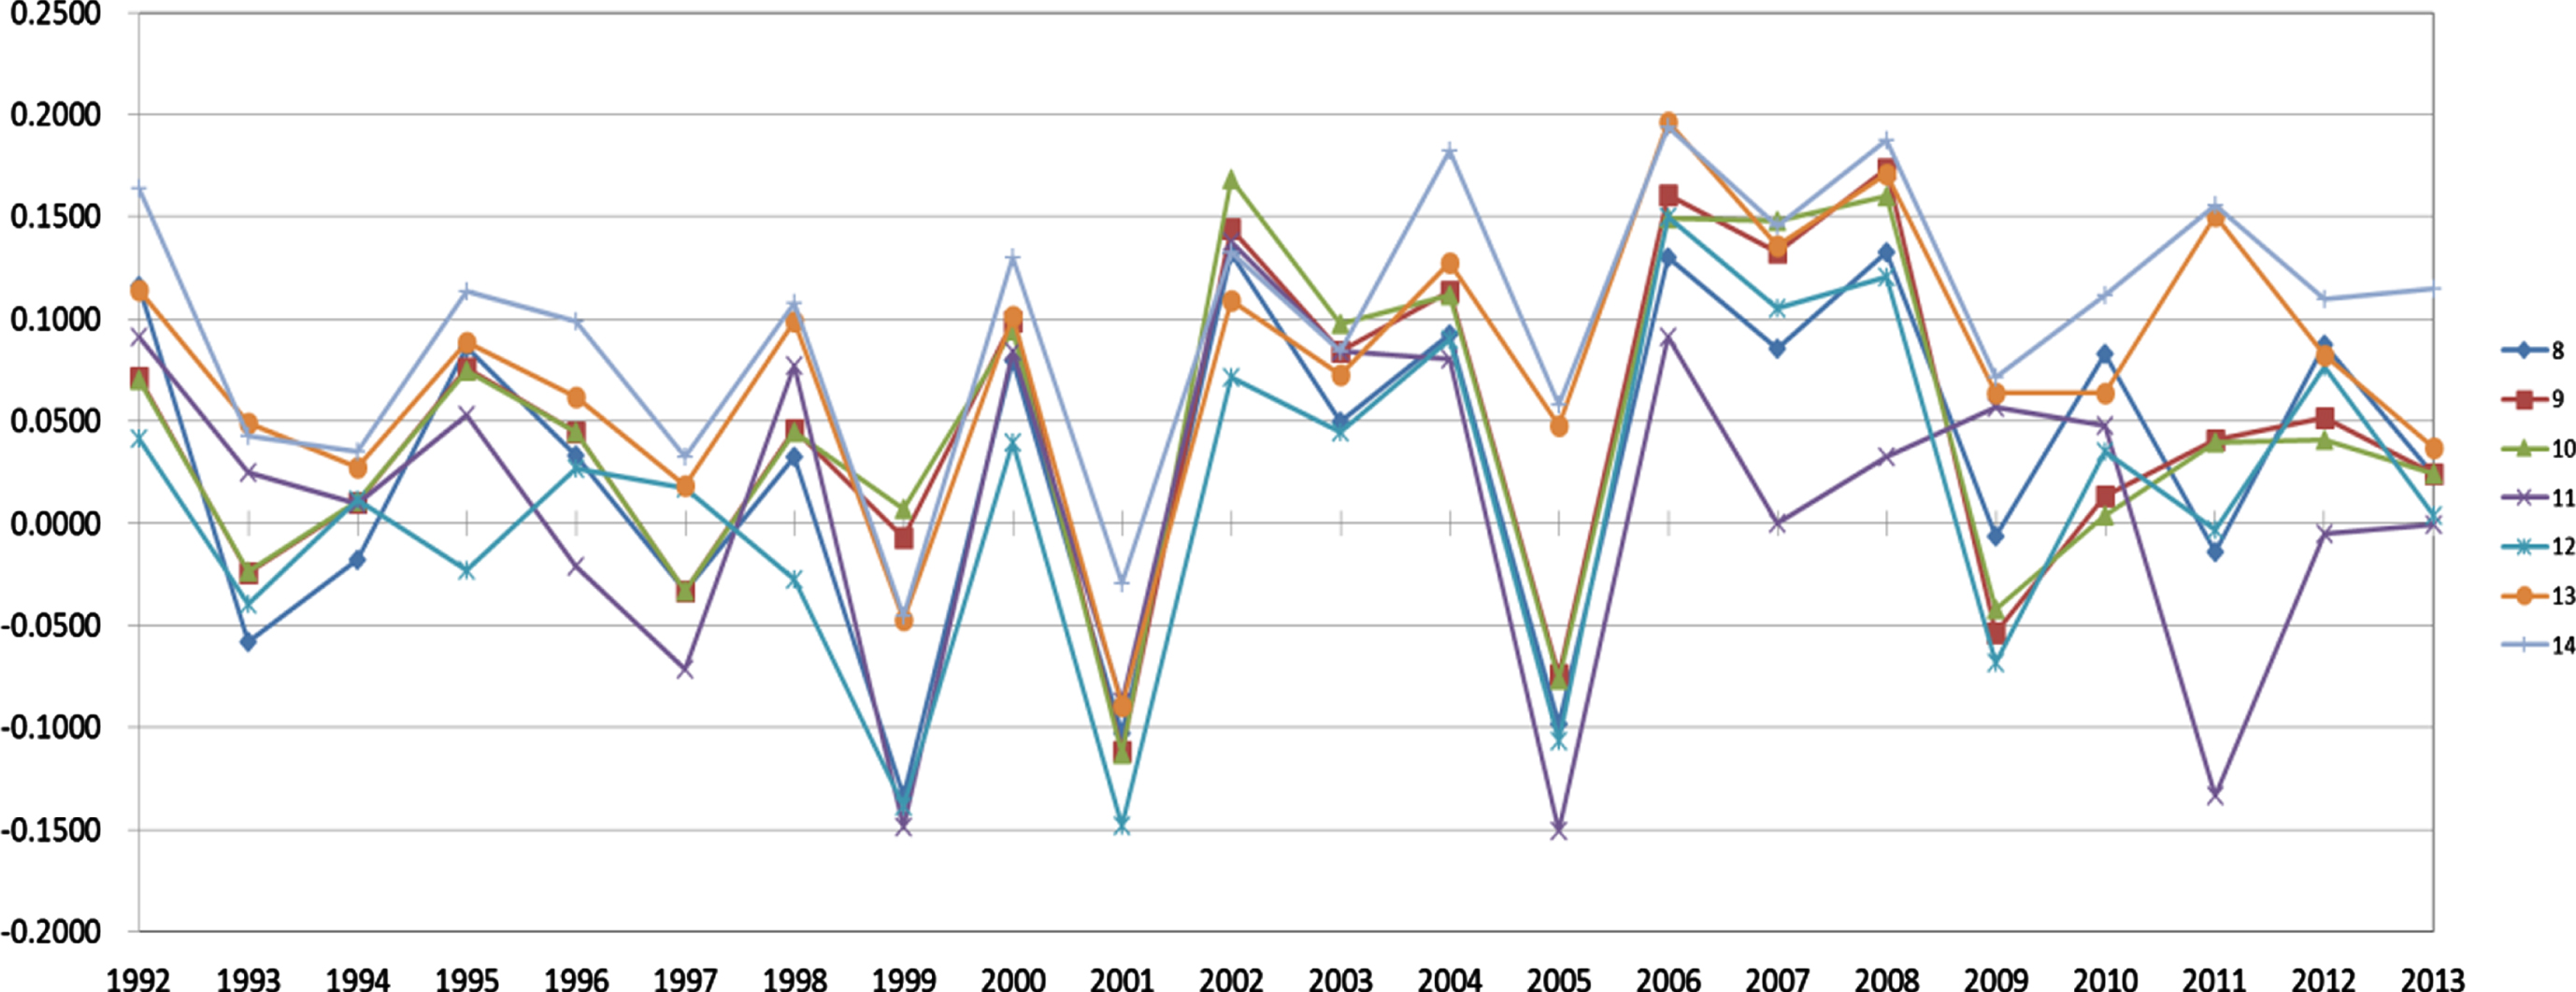
The performances of information ratio for the “industry” stock selection method with various asset allocation methods from 1992 to 2013.
In this study, 14 index fund strategies with various stock selection and asset allocation pairings are tested. Our results show that the index fund strategies with the NSGA-II generate the best excess return by scarifying a little tracking error (or variance of portfolio return). The empirical results further demonstrate that optimizing three objective functions [i.e., Equation (9)] simultaneously can achieve a better trade-off than optimizing a linear or nonlinear combination these functions [i.e., Equation (5) or Equation (10)]. Solving the index tracking problem by optimizing three objective functions simultaneously still follows Markowitz’s (1952) mean-variance principle with further consideration of the covariance between the portfolio return and the market return (i.e., the similarity between the portfolio return pattern and the market return pattern). Thus, following the NSGA-II’s suggestion, investors can achieve a better trade-off among maximizing returns, imitating market behaviors, and minimizing risks.
Footnotes
Acknowledgments
This research was supported in part by the Ministry of Science and Technology of Taiwan under contracts NSC 100-2410-H-346-003-.