



Abstract
In this paper, a shorter and more publication focused version of our recent article “A Bottom-Up Approach to the financial Markets” ( Mahdavi-Damghani, & Roberts, S. 2019.) is presented. More specifically we propose a new approach to studying the financial markets using the Bottom-Up approach instead of the traditional Top-Down. We achieve this shift in perspective, by re-introducing the High Frequency Trading Ecosystem (HFTE) model Mahdavi-Damghani, B. 2017. More specifically we specify an approach in which agents in Neural Network format designed to address the complexity demands of most common financial strategies interact through an Order-Book. We introduce in that context concepts such as the Path of Interaction in order to study our Ecosystem of strategies through time. We show how a Particle Filter methodology can then be used in order to track the market ecosystem through time. Finally, we take this opportunity to explore how to build a realistic market simulator which objective would be to test real market impact without incurring any research costs.
Keywords
Introduction
A call for a modelling revolution
Though used sometimes loosely partly because of a lack of formal definition, the interpretation that seems to best describe Big Data is the following. The definition is really twofold. The first is one associated with a large body of information that we could not comprehend when used only in smaller amounts (Cukier, & Mayer-Schoenberger, 2013). However this primary characterization indicates a second, deeper meaning. More specifically the realm of the definition goes fundamentally beyond simply reducing the confidence interval of a parameter whose estimation would benefit from an increase of the sample size. This latter intuition is the natural statistician point of view. In fact the term “datafication” has recently been introduced in order to replace the misleading term that is Big Data in order to make sure readers research the term instead of guess its meaning (Cukier, & Mayer-Schoenberger, 2013; Mahdavi-Damghani, & Roberts, 2019). A good way to illustrate this point with finance would be for instance to examine Figure 1 which represents new data at the high frequency domain. The latter allows us to shift our study of the market from the Top-Down 1 approach to the Bottom-Up approach 2 Indeed the Figure cannot be explained by the TD approach as the fluctuations seem to be more driven by systematic strategies interacting into a quagmire. The new candidate sector under inspection, after the sub-prime crisis, quickly became the one of algorithmic systematic trading which flash crash of May 6, 2010 (in which the Dow Jones Industrial Average lost almost 10% of its value in matter of minutes) exacerbated the scrutiny. However, the current state of the art risk models, are the ones inspired by the last subprime crisis and are essentially models of networks in which each node can be impacted by the connected nodes through contagion (Amini, & Minca, 2016) and is better suited to lower frequency models. Figure 1 suggests that the common, perhaps lazy view, that crashes occur through totally unpredictable (Nicholas Taleb, 2007) events may not be true for algorithmic trading. In fact market impact literature has gained noticeable momentum in the recent past (Mastromatteo, Benzaquen, Eisler, & Bouchaud, 2007). Market impact study is one of the rare areas of Quantitative Finance where interaction of strategies is taken seriously. In any case Figure 1 and the other multiple flash crashes has led the scientific community to encourage revolutionary changes to occur, possibly in the form of agent-based modelling (Bouchaud, 2008; Buchanan, 2009; Doyne Farmer & Foley 2009) in lieu of traditional financial mathematics models. It is in this fundamental opposition of views that part of the title of our original paper must be understood (Mahdavi-Damghani & Roberts, 2019).

Natural Gas flash crash of 06/08/2011 [45].
Bottom-Up vs the Top-Down
We learn about the Bottom-Up vs the Top-Down approach in introductory systems engineering classes at the undergraduate level but by the time one gets into the most advanced postgraduate financial mathematics classes, this essential beginners level scientific lesson, has long been forgotten and the models have become dogma. Indeed at these more advance stages of ones education it becomes much more important to be able to derive or infer meaning via these believes rather than understand the limitations of these core modelling assumptions and improve the models from inception. In fact these beliefs are so much anchored in our common academic psyches that wrong models get Nobel Prizes 3 and lead to market crashes and bankruptcies 4 .
Market impact’s importance
It has been shown recently that, in the context of correlated assets, synchronicity is key when it comes to optimal execution (Mastromatteo, et al., 2017). There are different ways to see how this is related to the Bottom-Up approach. For us, it suggests that quantitative asset managers who employ low frequency optimal index construction centered around volatility such as Risk Parity (Mahdavi-Damghani, 2018.) or more centered around historical return 5 act as a prey for predator algorithms in the higher frequencies 6 .
Evidence of an evolving strategy ecosystem
Being aware of their condition as “preys”, asset manager have deployed defense mechanism to protect themselves from the predator algorithms. For instance in a situation in which an asset manager needs to re-balance its portfolio in a sequential manner, then HFT act on the correlated assets before asset managers (at the lower frequency) had time to balance completely their portfolio. This has naturally created the need to synchronize the re-balancing execution process. If we were to take the situation in it historical context and perhaps re-introduce the concept of invasion into a strategy ecosystem, then we can say that the Robot A historical asset manager systematic trading which did not employ synchronicity was historically acting as a prey to Robot B 7 which led the asset managers who had designed Robot A to create now a Robot C 8 So we can see trading environments changing as a result of the frequency of certain strategies changing. Though interesting these hypothesis need to be understood more deeply, going back to the most simple infinitesimal granularity so to explain the extraordinary complexity into well understood incremental steps. Once these incremental steps are understood, can we apply our new understanding to a more practical business application? More specifically can we use this Bottom-Up approach to build a realistic market simulator 9 ?
Agenda
We have divided this paper in 3 Sections. More specifically in Section 2 we express some agent-based strategies in Neural Network format suggesting the incentive for going building complexity in simple steps going from Shallow to Deep Learning. We will use the HFFF format (Mahdavi-Damghani, 2017) recently introduced for this exercise, summarize some classic strategies as well as suggesting un-intuitive ones. This will then help us, in Section 2 to introduce a couple of methodologies for studying Ecosystems of strategies through time using tools in evolutionary dynamics and defining more rigorously the concept of regime change. The first method, the brute force genetic algorithm will be contrasted with the Path of Interaction methodology which will serve us in the last section,4, in which we study Particle Filter methods applied to Multi-Target Tracking (MTT). We will finish this section by providing guidelines on how to build a realistic market simulator, leveraging on the material introduced in the previous sections.
Agent-Based System: from Shallow to Deep Learning
Following Bouchaud 10 ’s call for a revolutionary change in economics (Bouchaud, 2008) via Agent-Based Models, this section will focus on the construction of these agents. More specifically we summarize some of the agents already introduced in our last paper (Mahdavi-Damghani, 2017) but also new agents we thought were interesting to discuss.
Electronic trading
Traditional order book (Cartea, Donnelly, & Jaimungal, 2018) consists of a list of orders that a trading venue such as an exchanges uses to record the market participants’ interests in a particular financial product. Typically a rule based algorithm records these interests taking into account, the price and the volume proposed (on either side of the Bid-Ask) as well as the time in which that interest was recorded (in situations in which interest at the same price is recorded by few different market participants, a referee decides which would win the trade: usually FIFO).


Order-book visual representation.
In this subsection we will use some of the material presented in the High Frequency Trading Ecosystem (HFTE) (Mahdavi-Damghani, 2017) recently introduced, we will therefore summarize the main points of the referred paper for that occasion.
The EWMA NN
When we first started our research we called this subsection the Trend Following HFFF but through the simulation exercises and with increased research experience we decided to rename this subsection EWMA NN. However, in many of our simulation when we refer to the TF strategies we really mean EWMA family. We will explain this rational next. A very common trading strategy is the trend following (TF). The idea of the TF is that if the price has been going a certain way (e.g. up or down) in the recent past, then it is more likely to follow the same trend in the immediate future.

We refer to our previous work (Mahdavi-Damghani, & Roberts, 2019; Mahdavi-Damghani, 2017) for the proof and the diagrams. One of the current hurdles in our research is our classification issue and the MACD strategy is a good example as to why. Indeed the MACD strategy which is technically associated to the EWMA family has an economical meaning which can potentially be classified as an antithetic TF strategies (which are in the EWMA family). This may be important for practitioners as the MACD(12,26) has for instance gained a great deal of momentum for algo traders as it can be seen on the various search results on youtube or on practitioners websites such as “investopedia” (Hayes, 2019).
The Moving Average Convergence/Divergence (MACD) was designed to reveal changes in the direction and duration of a trend. It essentially models difference between a “fast” (




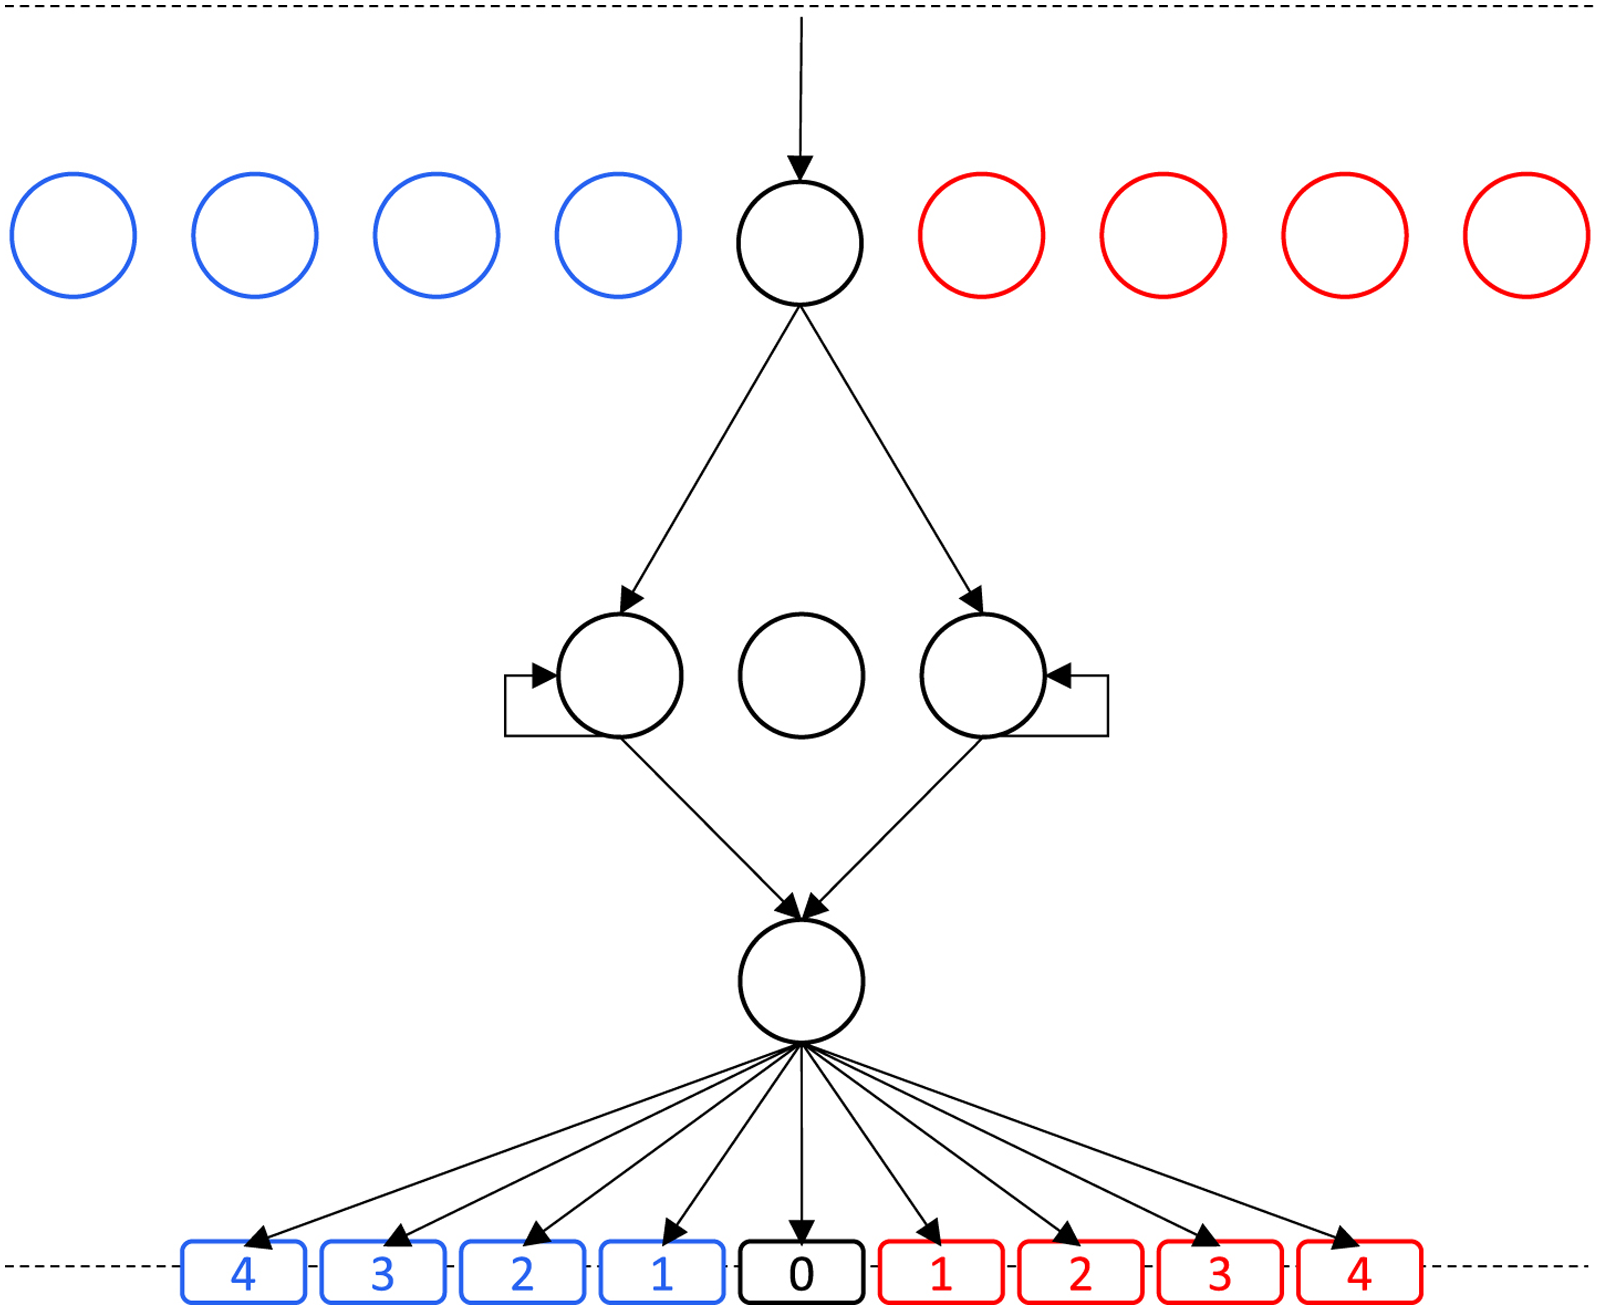
MACD (difference of EWMAs) in HFFF format.
The Multi Linear Regression (MLR) is another well known simple strategy traders have been using in the industry.


The bias-variance dilemma (BVD) is a technical term representing the optimization by constraints problem which aims at simultaneously minimizing the error from erroneous assumptions (bias) in our learning algorithm or commonly called “under-fitting” and the error from the out of sample analysis (variance) or commonly called “over-fitting”. One of the properties of DL is its dual ability to learn the most complicated functions but also makes it prone for over-fitting. It is therefore recommended that one applies conscious efforts in studying carefully the associated benefits to complexity ratio in the context of the BVD. Regularization is usually the term employed for the methodology that aims at finding the optimal model according to the BVD. The mathematical formalization suggests that we calibrate a function f which takes as input a potential infinite number of explanatory variable x1, x2, . . . x
n
so as to minimize the distance to a target y under some cost measure V subject to a penalization, or regularization term
13
R (f). Equation (8) refers to this generic Regularization.



Lasso regression strategy in HFFF format.
We recall here the truth table associated by the XOR function in Table 1. Let’s look at the following known HF rational, which will hopefully shed light on the reason why we are discussing the XOR function.
Relationship Between Open Interest, Price & XOR
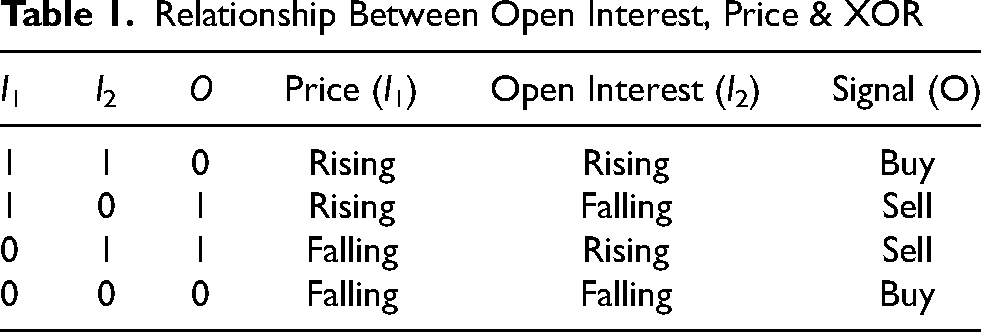
Relationship Between Open Interest, Price & XOR
We refer to our previous work (Mahdavi-Damghani, & Roberts, 2019; Mahdavi-Damghani, 2017) for the proof and the diagrams.
Lessons learnt in our recent research
Network HFFF & deep learning thoughts
The scientific methodology behind the construction of the game of GO is one we wished to apply to our HFFFs and created a dynamical ecosystem. For instance increasingly advanced strategies compete with each other and we eventually get an interesting portfolio of strategies as well as their co-evolution. However, the HFFF itself potentially suffers from similar kind of limitations that prevented the XOR function to be learnt without 1 hidden layer. Indeed a legitimate question can be asked on whether a single hidden layer is enough. The answer to this question is in fact negative as Convolutional Neural Network (CNN) have shown more potential extracting trading signal compared to shallow learning (Vargas, de Lima, & Evsukoff, 2017) 15 . Some other studies reveal universal features of price formation using Deep Neural Networks (Sirignano, & Cont, 2018) but lack a study on simpler benchmarks (e.g: Shallow Learning). For instance in (Sirignano, & Cont, 2018) a logistic regression is used for a benchmark. It would have been interesting to see some more complex benchmarks 16 . We have arbitrarily taken as hypothesis the HFFF to be good enough to model few critical strategies in the domain of QF and above all proceeding this way is important in unweaving the black box associated DL. With this in mind it is interesting to notice that the TF strategy has been designed to dominate a random swarm of strategies. In turn the MLR strategy has been designed to theoretically dominate the TF with the key point being that the MLR strategy capitalizes on areas of the orderbook the TF strategy does not have the DNA for (to perceive information of the OI). Similarly the XOR strategy has been designed to theoretically dominate the MLR by splitting the OI surface in additional zones that the MLR cannot understand (lacking the necessary hidden layer). Taking the argument forward, we could lay the hypothesis that this would eventually lead to a Farmer like strategy. The latter would consist of a highly sophisticated strategy that would understand its own impact to the ecosystem and would be able to take actions in it so as to both create long term stability as well as profit. An alternative hypothesis would be that Neural Network complexity would not matter beyond an XOR strategy and that we could eventually converge to a random swarm of strategy again after a certain point. Figure 6 illustrates these hypothesis.
A first attempt at formalizing the evolutionary process
With the aim of providing intuition with respect to the sort of interactions that occurs between strategies, we formalize the Evolutionary Process (EP). For this we summarize briefly the recent work we have done around this topic using the same jargon than in our initial papers (Mahdavi-Damghani, & Roberts, 2019; Mahdavi-Damghani, 2017).


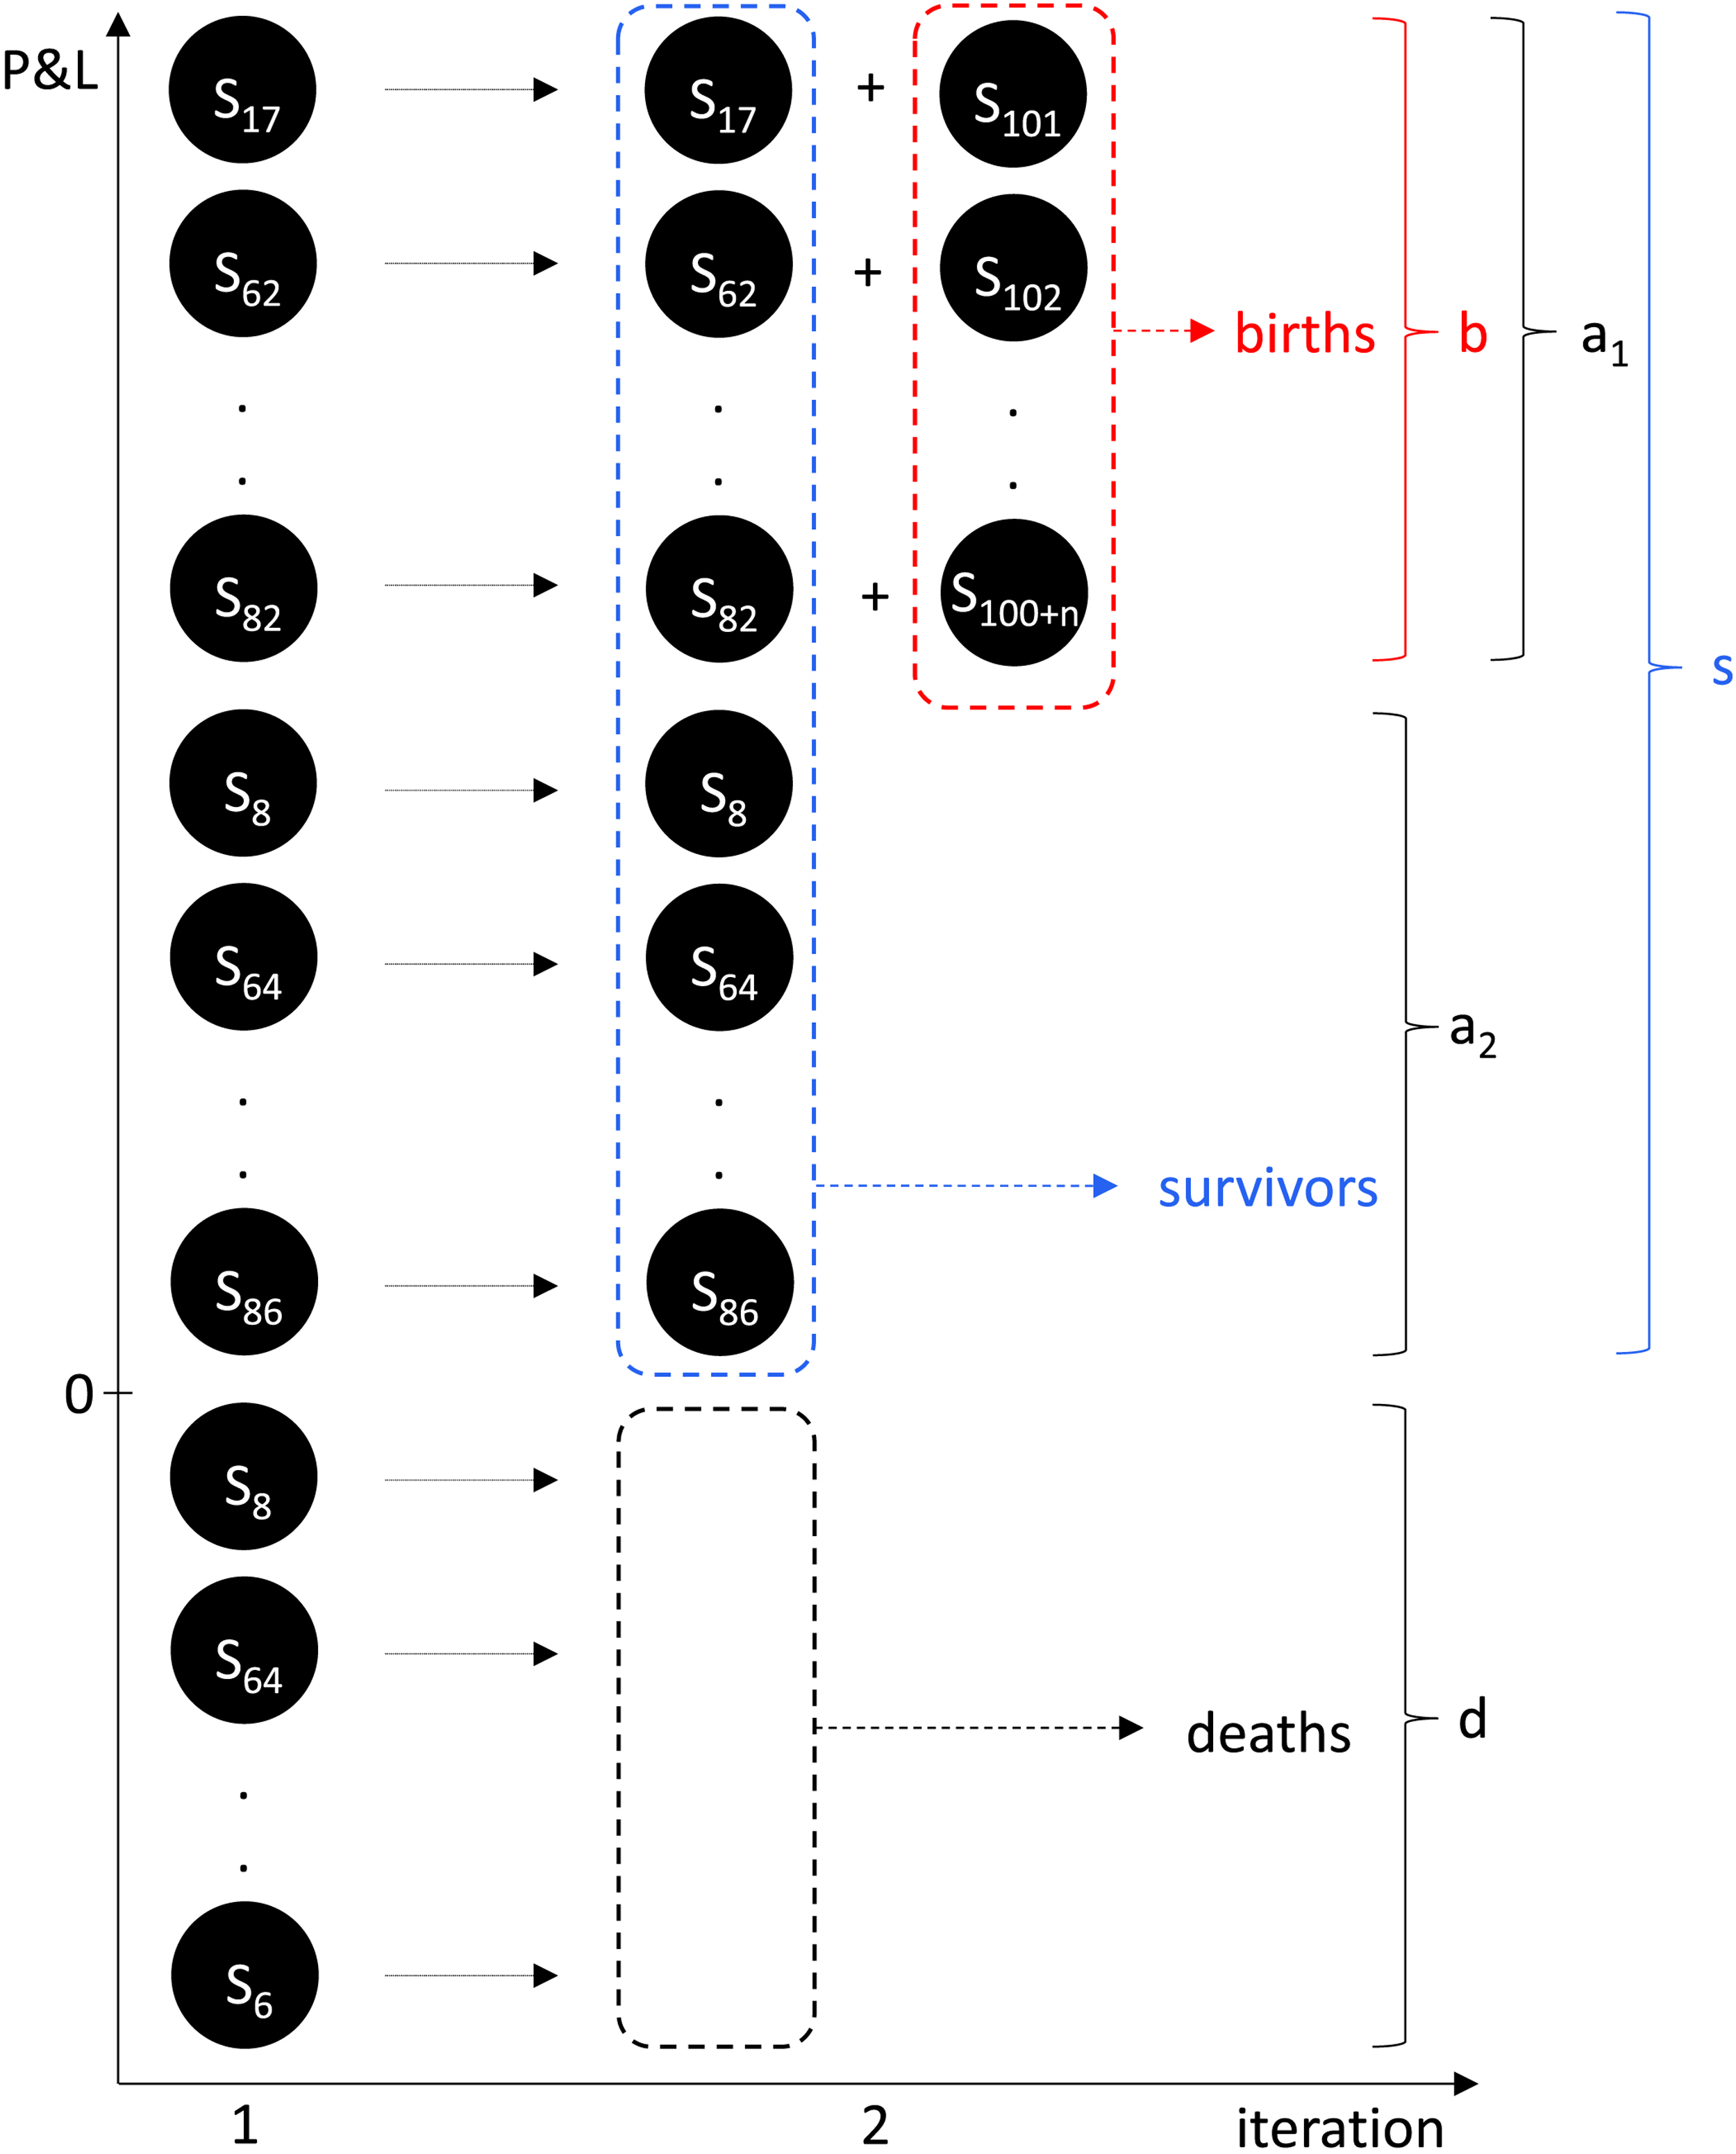
Death and Birth processes in our GA.
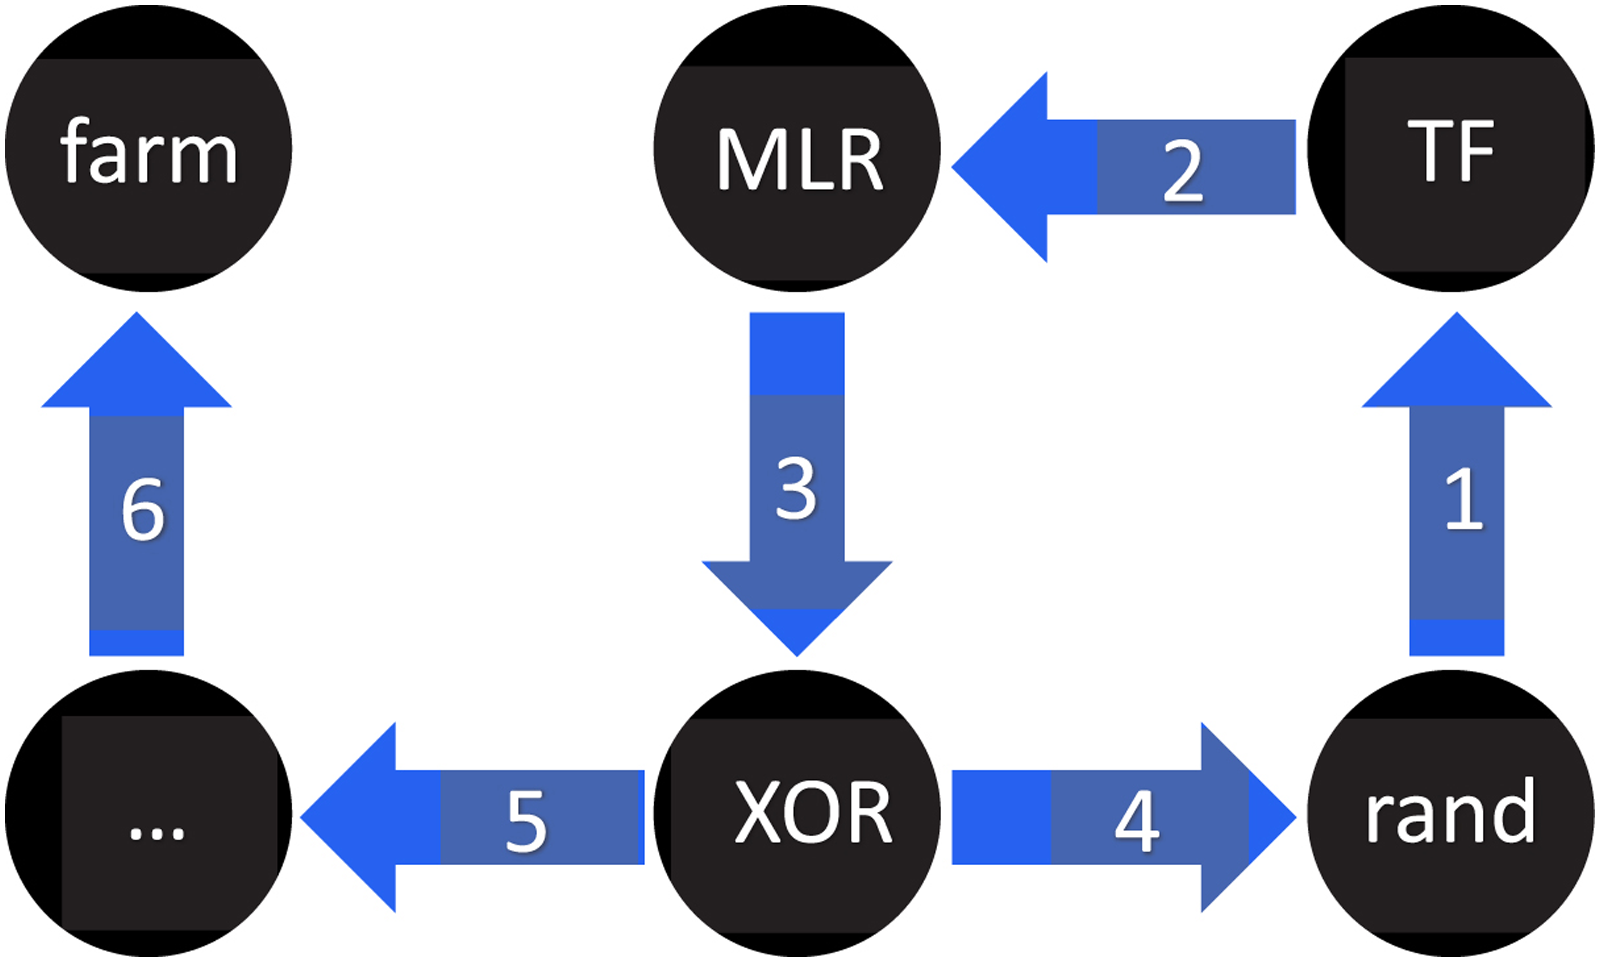
Illustration for a hypothetical Strategy Invasion Map.
Our first few simulations, despite not fulfilling the burden of proof, opened our eyes up to issues associated to optimality, need for more scientific rigour and perhaps an alternative way of fulfilling this burden of proof. The concept of Path of Interaction that we introduce next is an attempt at addressing this alternative methodology.
HFTE Game
One way to control our simulation issues, is to perhaps take a step back in complexity in order to gain momentum in constructing a theory with more rigor. With this in mind we have chosen to inspire ourself from the scientific method used by Axelrod (Axelrod, 1984, 1997) extended by Nowak’s (Nowak, 2006; Nowak, & Sigmund, 1993), and to introduce a mathematical object, similar in spirit to the PD matrix used as a battle ground by the name of Path of Interaction. In order to do this rigorously. Let us first go through few definitions.
Table 2 represents an example of the latter definition. The top row of the table points to the strategy involved in the relevant column. The row below (2nd row from the top) provides the stage of the HFTE Game. The 3rd row corresponds to the trading signal. The game starts in a states of in which none of the two strategies has a position (Signal = “N/A”) on the order book. Because each strategy needs some form of information on the order book, we take as assumption that there is a random seed on the order book. There is four possibilities of random seeds corresponding to whether the price has been going up or down last and whether the order book has increased its OI or decreased it. These four situations are symbolized by the following set of symbols: ↑↑, ↑↓, ↓↑ and ↓↓. We have chosen the case of ↑↑ to illustrate our examples arbitrarily. The 4th row corresponds to the order book state. The latter can be either scarse or full. We will see that this latter point matters but for now let us illustrate this point with an example. In Table 2 we start
Path of Interaction for 2 TF Strategies with ↑↑ Seeds and Full OB
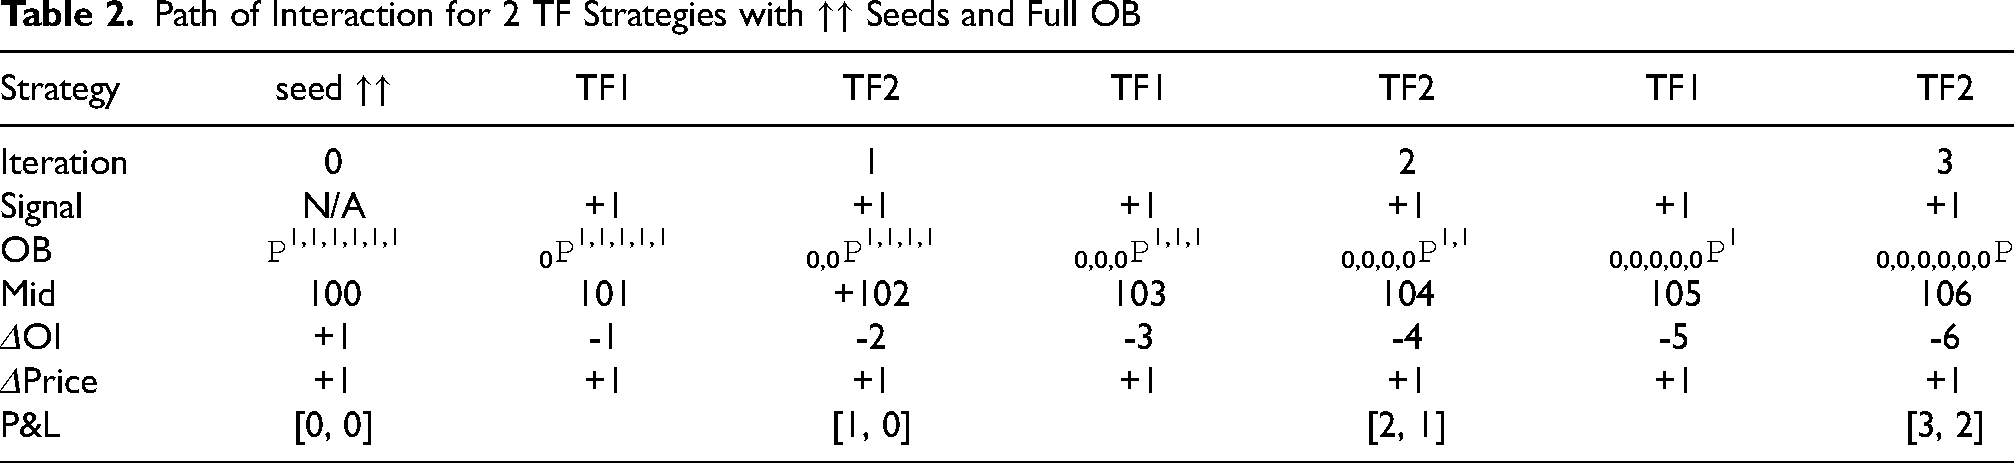
Path of Interaction for 2 TF Strategies with ↑↑ Seeds and Full OB

We would like to introduce the concept of Invasion Flow Chart. It can be intuitively understood as being the mirror concept of evolutionary dynamics applied to quantitative strategies through the mean of the HFTE Game instead of the Prisoners Dilemma Matrix.
New strategy tournament
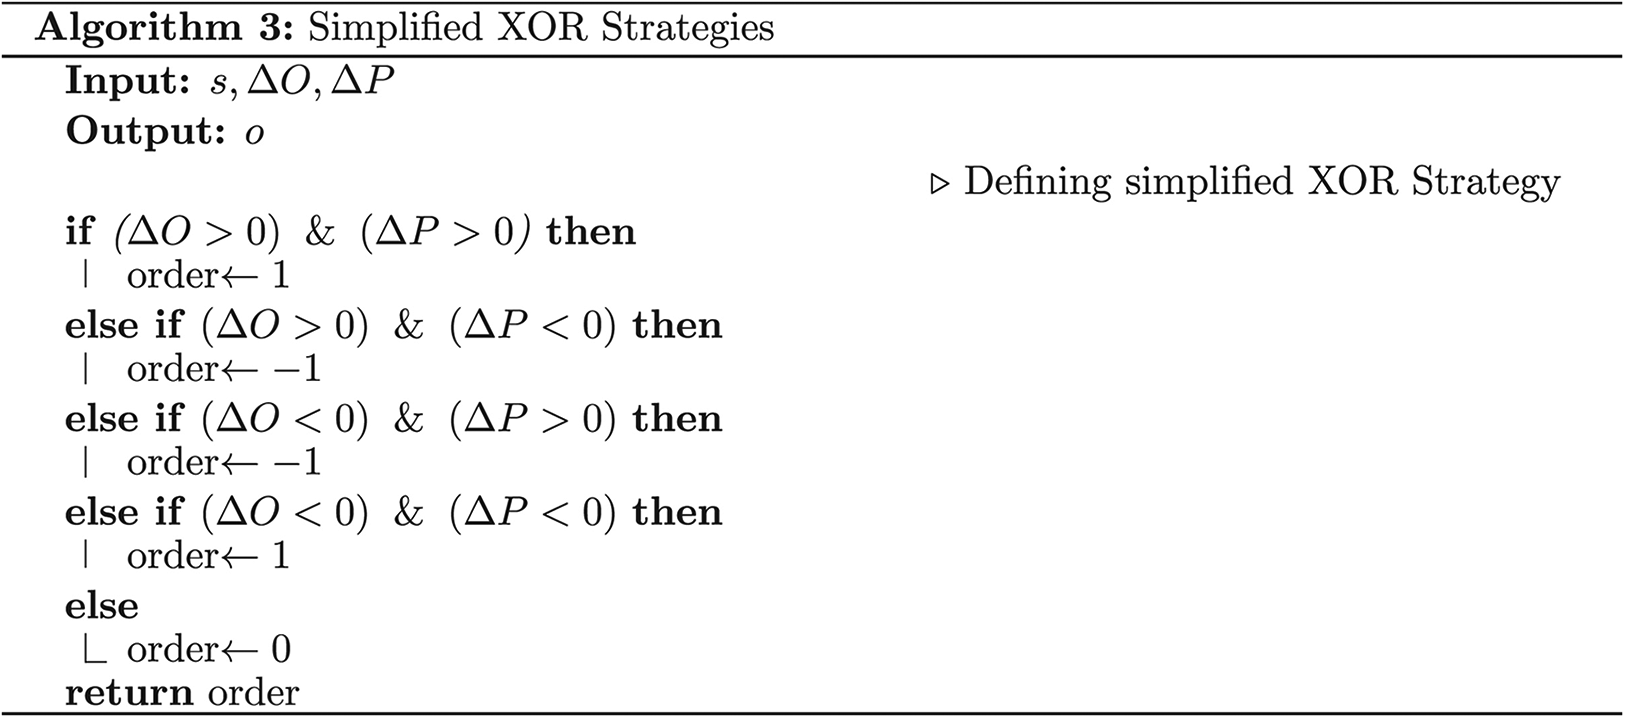
Before we discuss our Strategy Tournament, in order to avoid the classification issues mentioned earlier in our research (Mahdavi-Damghani, & Roberts, 2019; Mahdavi-Damghani, 2017), we decided for this new tournament to take three key strategies most simple forms. The first of these three strategies is the simplified TF strategy from Algorithm 1, the second is the simplified MLR strategy The idea of this simplified version is that Price and OB imbalance both contribute in defining the trading signal. formalized by Algorithm 2 and finally the simplified XOR strategy from Algorithm 3.

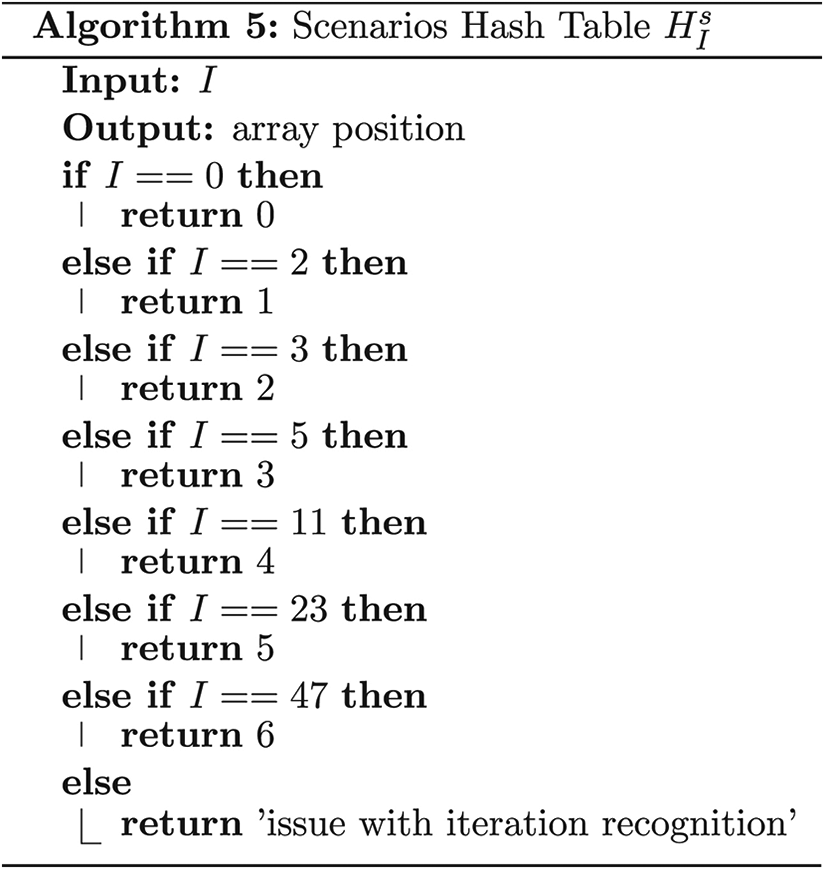
A Path of Interaction tournament was implemented in the context of 15 possible games on 7 different timescales: [0, 2, 3, 5, 11, 23, 47]. The choice of these timescales may be a little odd at first glance but the idea was to increase the timescale on average by a factor of two while at the same time picking prime numbers. Though, this may sound like unnecessary complexity, the idea of the latter is related to an intuition that we had over potential cycles occurring in these games. Though formalizing these possible cycles is potentially premature, we thought of putting them in place preemptively to avoid possible chances of getting into cycles (which would have made analyzing these interactions harder).
P&L in Path of Interaction for 2 Strategies with ↑↑ Seeds and Full OB

P&L in Path of Interaction for 2 Strategies with ↑↑ Seeds and Full OB
P&L in Path of Interaction for 3 Strategies with ↑↑ Seeds and Full OB

Table 3 represents the results of these games for two strategies interacting and Table 4 represents the same for 3 strategies. We can make several interesting observations.
Finally we wanted to end this part by suggesting few hypotheses based on some of our observations.
We noticed this interesting fact with our relatively small sample of HFTE games but have not been able to find a counter example yet nor been able to rigorously prove it. The proof might be easier than it seems, using perhaps the pigeonhole principle but we have not been able to formalize the proof or a sketch.
We explain next this seemingly odd and unexpected terminology. In the spirit of using simple rules at the agent level as a triggering point to complex interactions in the ecosystem that can turn into laws, we thought that this second hypothesis would also be inspiring. This latter proposed hypothesis might not be immediately obvious but there seems to be interesting connection between the TF strategy in an HFTE game and the TFT strategy in Axelrod’s (Axelrod, 1984, 1997;) computer tournament described our previous paper (Mahdavi-Damghani, 2017). As a reminder the TFT strategy cooperates first and continues doing so until it is deceited, upon which it deceits on the next move. However, the TFT has the ability to forgive. This means that, if the opponent agent decides to cooperate again then the TFT, starts cooperating on the next encounter. The TFT is therefore considered a nice strategy (Dawkins, 1976) but adaptable at the same time (Nowak, 2006). So how does that relate to the TF in finance? Both are successful strategies yet are very simple. They both replicate the last agent’s move: so they are both “cooperative” 19 but are adaptable 20 .

Instability increases with an additional strategy.
In this part we have built the humble start of a schemes involving the Bottom-Up approach to algorithmic trading. We first attempted to reach that objective by tackling the problem using a simple genetic algorithm methodology. Though intuitive an interesting, we abandoned this approach because of a series of problem associated, but not limited to, classification, lack of visibility and lack of optimality. We however, took this opportunity to shown possible connections to other STEM fields and how they could be brought in the world of QF through the regulatory door. To study the problem with more visibility, rigour, and in order to gain momentum, we took a step back in the scientific approach and formalized the HFTE game as well as the Path of Interaction concepts. We have also given 15 different kinds of HFTE games split on 7 different timescales and also presented few interesting observations about the interesting complexity in the relationship of these strategies, even when simplified. This study was done with the premise that we knew what strategies were involved in the ecosystem and in which sequence they act upon this ecosystem. Though simplistic, in the choice of the available strategies 22 , the current model give a good overview of how the method could be enhanced by simply adding more strategies including market makers. However, market participants are quite secretive in reality when it comes to their financial strategies. The only observable data on the market is essentially the price dynamics and the order book. We explore in the next chapter how inference can be constructed in the Bottom-Up approach when the price dynamic alone is available.
In this section we first go over a literature review of the Multi-Target Tracking (MTT). We then expand the study by connecting some of the concepts in the previous two Sections with particle filtering applied to scenario modelling and finally show how we can use this methodology to construct a realistic market simulators in which strategies can be tested.
Scenario tracking algorithm
A brief introduction
Recently, SMC methods (Doucet, de Freitas, & Gordon, 2001; Doucet, Godsill, & Andrieu, 2000; Liu, & Chen), especially when it comes to the data association issue, have been developed. An alternative wording for SMC is Particle Filters (PF) (Gordon, Salmond, & Smith, 1993; Kitagawa, 1996) [22, 29] and Multi Target Tracking (MTT) for data association. Their popularity is mainly due to their performancefor nonlinear and non-Gaussian problems Contrasting with classic linear methods like the KF/EKF (Haykin, 2000). When applied to our problem, we try to track the ecosystem of strategies through time. Namely we attempt a tracking our state space θ summarized by Equation (12).
For this simplified method we assume the state space is limited to a set of 15 scenarios spanned by up to 3 different types of strategies 24 acting on the OB in a sequence that is unknown. In order to manage complexity we have also assumed that there is no birth or death processes involved in our scenarios. Algorithm 4 describes our simplified study in pseudo code.

For this simplified methodology we assumed that the full OB is unknown. The only visible (indirect) information is the price process. The results from the series of simulations are presented partially in Figure 8 with more simulation available in our original paper (Mahdavi-Damghani, & Roberts, 2019). What we can observe is that every scenario had already clearly emerged by iteration 23, the second row from the bottom on all 15 scenarios (only 5 are shown in Figure 8). By iteration 47, the density is very clear, so much so that the only reason it is not a Dirac function is due to the resampling methodology introduced in that effect.
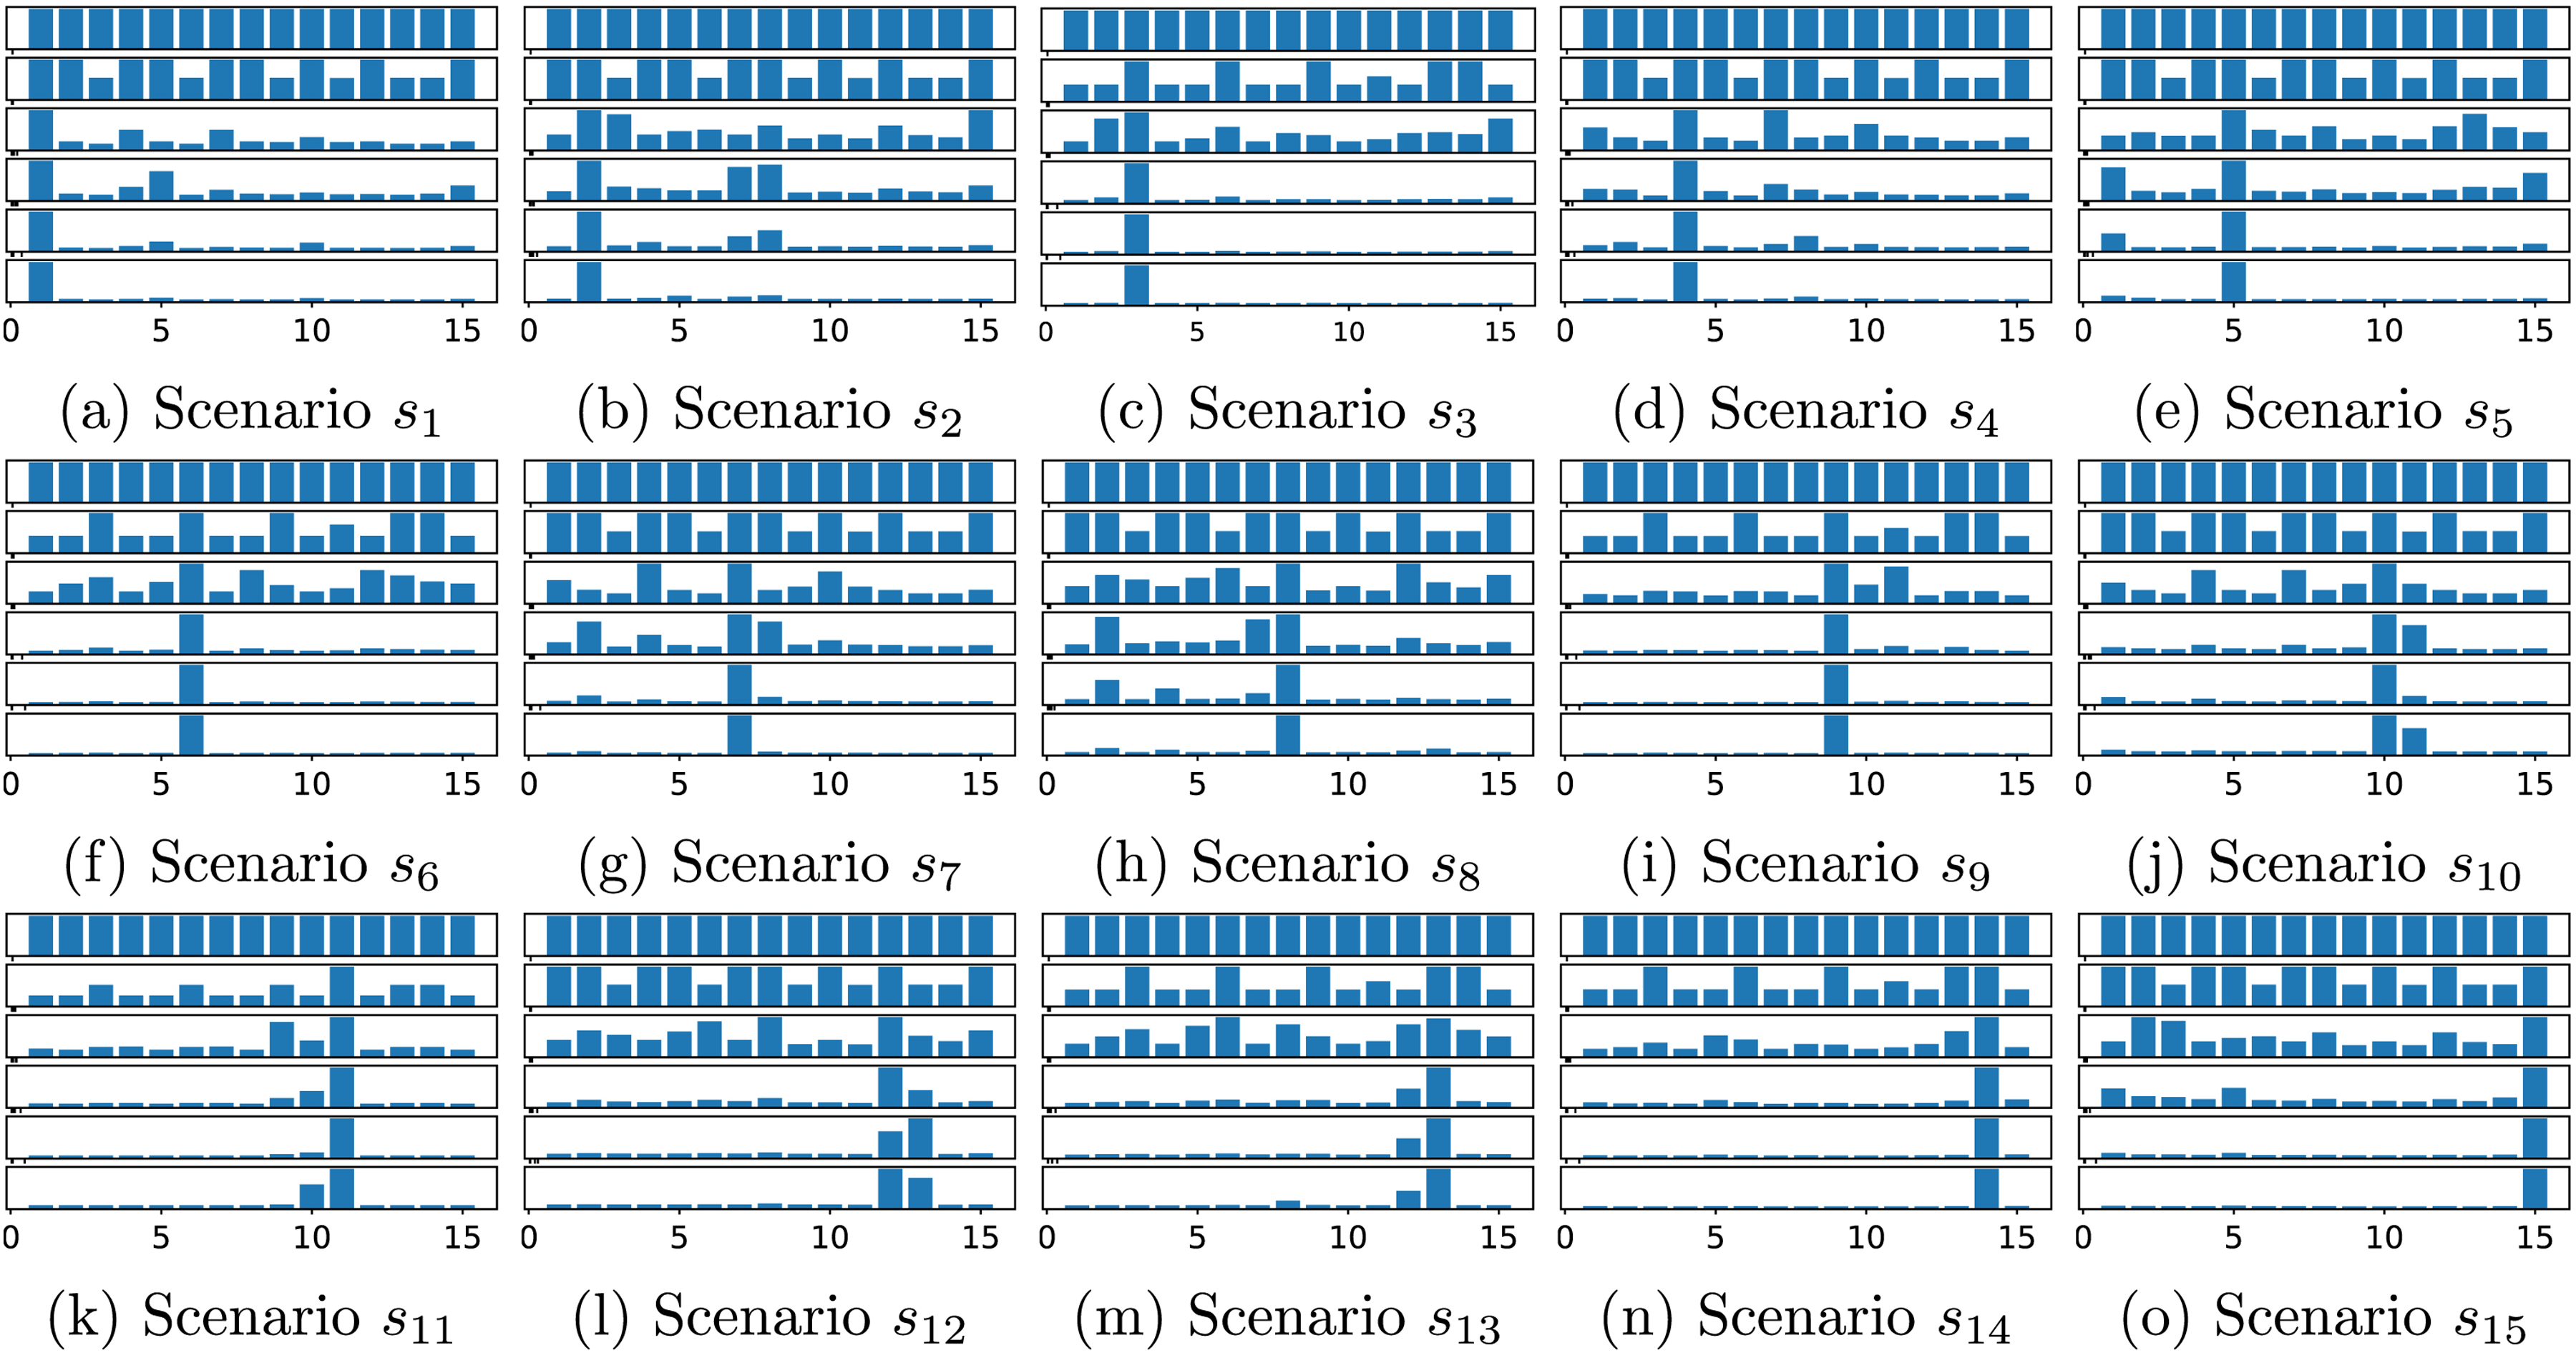
Particle Filter on market scenarios on [2, 3, 5, 11, 23, 47].
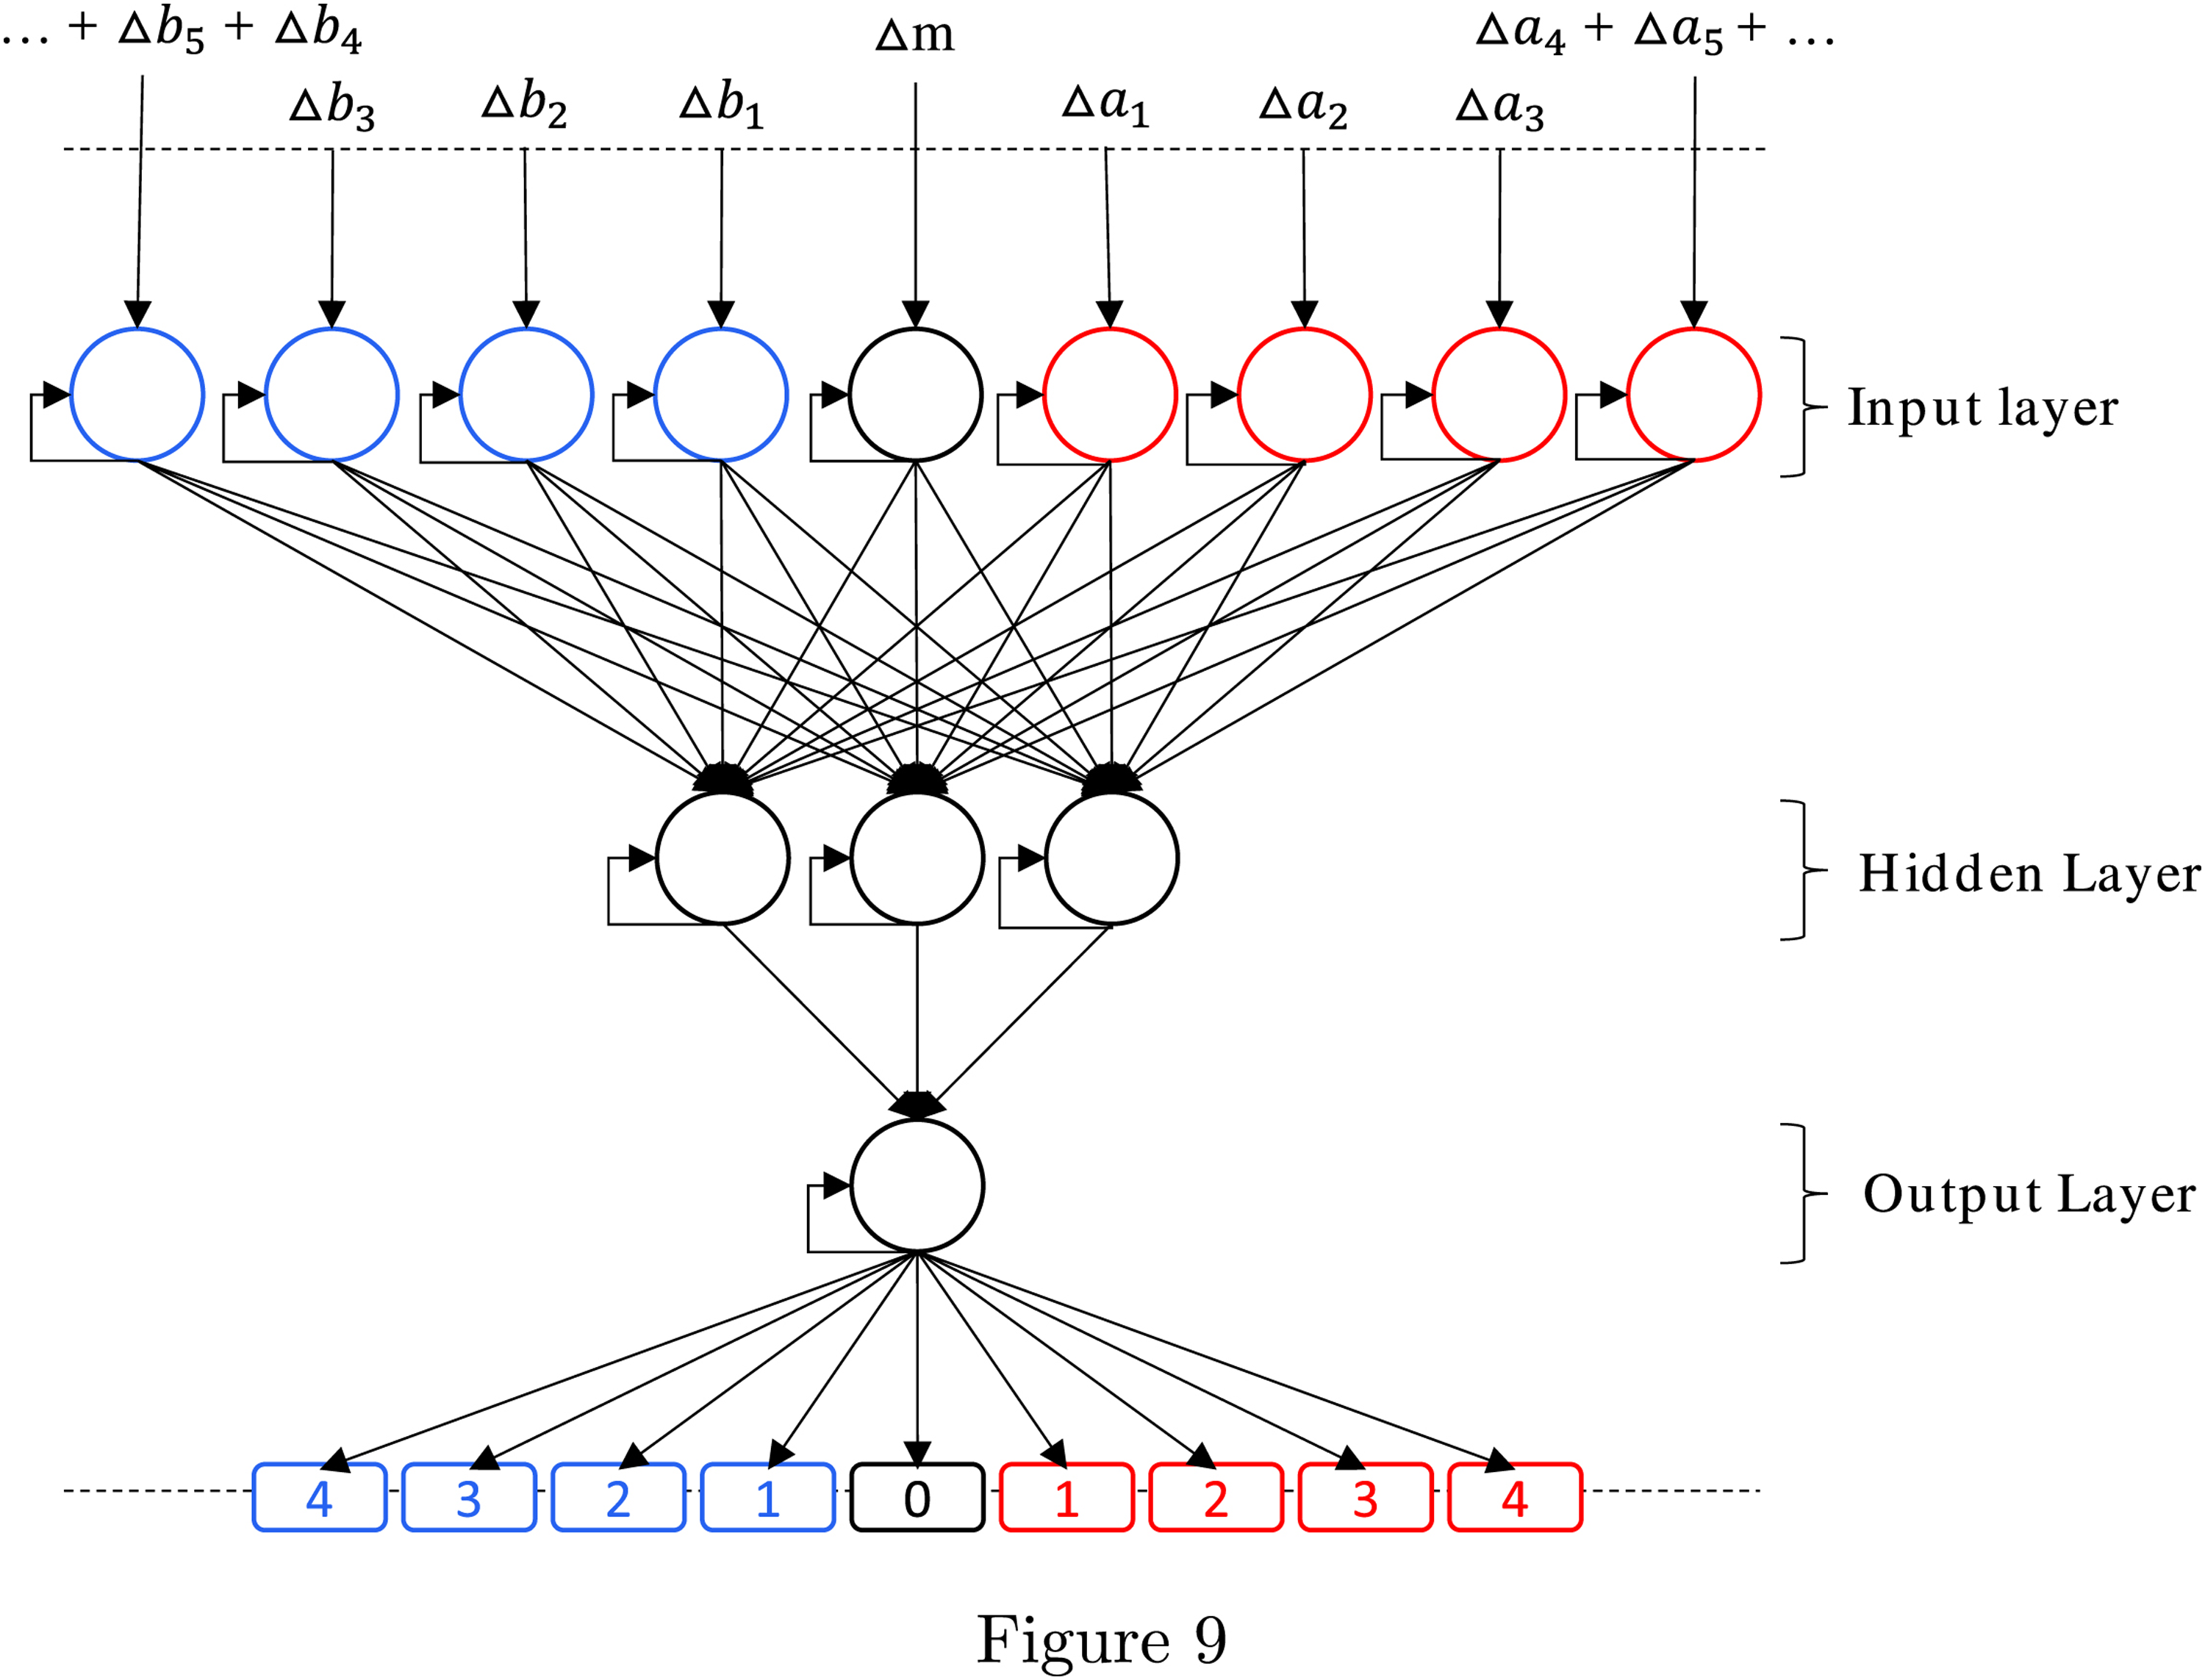
The High Frequency Financial Funnel (HFFF).
Now that we have shown how to build and detect the market details from the Bottom-Up, how can use our findings to build a realistic market simulator?
Context
The context is the following: you are working in a bank, asset manager or in a hedge fund as a “Quant” and have been given the instructions to build a realistic market simulators on which one can test strategies and perhaps decipher market impact or regime change 25 . You are given a set of strategies Ω = {S1, S2, …, S n } that can be replicated through the HFFF (from Figure 9). You also assume that you have a history of P&L for each element of Ω. This simulated market ought to be composed of an ecosystem of all possible theoretical strategies which frequency is unknown and which should react in such a way that the P&L of all strategies for which we have historical data ought to perform in a similar manner. Though, this seems to be an impossible task, there are ways to tackle this problem leveraging on what we have learnt in the previous sections.
Proposed solution
We need to define a particle filter on the scenarios described in the problem formulation. In doing so we need to both define a slightly different likelihood function as well as a very different resampling solution. We need to create a likelihood function for the particles associated to the scenario being investigated. This likelihood function should be itself function of the relative entropy between the expected P&L distribution and the one realized by the simulated market. The Kullback-Leibler divergence (Kullback, & Leibler, 1951), of Equation (13) can be a simple enough measure for the individual strategies being simulated. More specifically for discrete probability distributions where H, is the historical distribution, and S, the simulated distribution. The Kullback-Leibler divergence from S to H is given by Equation (13).



Summary
We have started this paper by pointing to a puzzling observation from the newly born high frequency commodities market which because of its extreme youth and therefore immaturity makes it a great case study for a high frequency market at inception and therefore for our purpose. More specifically as we have seen with Figure 1, fascinating patterned oscillations occurred in the commodities market. These oscillations cannot be explained by the TD assumption in Quantitative Finance. We have proposed to study these oscillations with the BU approach instead, inline with the recommendations of the highest authorities in finance. More specifically this paper was a response to the call for a modelling revolution (Bouchaud, 2008) to occur post subprime crisis in the form of agent based models. The latter theory was developed in 3 Sections. We first expressed classic Financial Strategies in HFFF format and showed the pletora of classic strategies that can be modelled with the HFFF format. We also tried to give the incentive for going from a simple perceptron, to shallow and finally deep learning. We also established possible connections to fields that are traditionally associated to mathematical biology, namely predator-prey models and evolutionary dynamics. This was done in order to expand the mathematical weaponry that we believe have value in 21st century Quantitative Finance. These helped us express the bottom-up approach at the infinitesimal level. More specifically we developed the concept of Path of Interaction in an HFTE Game and proposed 3 hypothesises as a mean to inspire future researchers. In Section 4 we looked at how the financial market composition could be tracked through time with MTT. Finally, we used these findings in order to present some guidelines around constructing a market simulator to have more realistic backtests as well as measure market impact without incurring costs.
Current & future research
Our first few simulations opened our eyes up to issues associated to optimality and the need for more scientific rigor. We have classified these points of improvement in half a dozen issues listed below.
Classification simplification
As mentioned before the direct simulation approach (Mahdavi-Damghani, 2017) is too challenging and the results perhaps too convoluted to filter out the essence of the paper. For this reason we proposed to study the problem using fixed HFFFs of different depth (XOR vs MLR) and width (TF vs MLR). Though this simplifies the problem it also means there is human intervention in the strategy pool chosen. This latter intervention, though convenient raises the question of whether what seems to be equivalent strategies are equivalent after all. Less human interventions should take place going forward.
The state space can be improved
Choosing three types of strategies greatly limits our state space which makes our tracking methodology easier but not as realistic as we wish ultimately. Additional strategies must be incorporated and more HFTE games must be included in our database of scenarios. This could be the work of many years and could be addressed in the form of creating an online database in which interested scientists could deposit their findings in object oriented format for simulation purposes. Generally speaking we need to incorporate a Birth and Death Process to our MTT to make more realistic scenarios. In order to do that we need to incorporate the OB in the likelihood function instead of using only the price dynamics. This will undoubtedly make the programming exercise more challenging but will at the same time bring more value to the research in the long run.
Order-book dynamics
Many of the markets are driven by different rules for the OB. We need to incorporate these different rules in our HFTE games as the latter rules obviously impact the outcome of the games.
Increased HFFF complexity does not equate to Invasion
It has been speculated that the need for a bigger brain in humans is partly due to the need for humans to elaborate deceitful strategies with their rivals and cooperative strategies with their allies. It is therefore not entirely ridiculous to associate increased neural network branching (to be roughly understood as increase in cranial size) with increased strategy complexity. However, increased intelligence does not necessarily equate to survival as we can see in the shark population, considered like an apex predator in the sea (but with a relatively small brain), has not evolved for millennial. We are very much at the early stages of defining NN complexity and dominance. A clear picture did not necessarily emerge from the first simulations though an interesting comparison can be made with Axelrod computer tournament (Axelrod, 1997). Indeed, Axelrod (Axelrod, 1997; Mahdavi-Damghani, & Roberts, 2019) showed that it was not necessarily the most complicated strategies that prevailed at the end 27 . The TF strategy shares some aspects of the Tit For Tat (TFT) strategy in the sense that they are both simple and adaptive. However, taking the argument in reverse (“complexity pays off” instead of “simple adaptable strategies are best”), can we think about a farming strategy? By this we mean can we come up with a strategy (in a DNN format) that would understand the state of the ecosystem and would take actions based on that ecosystem, deliberately avoiding acquiring alpha on the ecosystem if it felt that it would be beneficial for the long term health of the financial ecosystem? These are fascinating questions that we may figure out sooner than expected.
Complex food webs
We have seen in Section 3.2.1 that we have taken l = 4 in our Path of Interaction sequence. Would the Path of Interaction results change if we increase the sequence’s length? The answer would be yes if the OB is not full. But what if it remains full? In the context of the Path of Interaction study, is there a more rigorous way to connect some of the Lotka-Volterra predator prey models to these interactions? It seems intuitively more likely that the strategy ecosystem should rather be a complex food web. Can we enhance the idea of the simple Lotka-Volterra predator prey model (Chauvet, et al., 2002; Mahdavi-Damghani, & Roberts, 2019; Volterra, 1926) to more complex food webs? More specifically what are the strategies that would create a stable and unstable food web? The concept of Path of Interaction is meant to be a bridge connecting the gap between strategy formalization to evolutionary dynamics but this bridge in not entirely specified yet.
Diversity & stability
One other legitimate question that we can ask ourselves is whether the HFFF is complex enough to model all financial strategies? And if not all, does it encompass enough strategies to convey something interesting and meaningful when you make the strategies interact with each other. In this context our first paper (Mahdavi-Damghani, 2017) ended with the proposed “Diversity & the Financial Markets” hypothesis below which is currently an open problem that is interesting to mention in the context of future research:
Profitability ecosystem asymmetry
The second hypothesis that we introduced is as follows:
As we mentioned earlier we noticed this interesting fact with our relatively small sample of HFTE games but have not been able to found a counter example yet nor been able to rigorously prove it. It would be relatively easy to incorporate more simulations involving more strategies to see if we can find a counter example. Alternatively, if the hypothesis can be proven then we recommend using the pigeonhole principle for the proof.
Morality & HFTE Games
The last hypothesis we introduced is as follows:
The TF strategy in an HFTE game and the TFT strategy in Axelrod’s (Axelrod, 1984; Mahdavi-Damghani, 2017) computer tournament seem to have interesting similarities (Mahdavi-Damghani, & Roberts, 2019) even though they are induced by very different applications of cellular automatons. This suggests that similar physical laws may drive their success though the exact link was not establish. However, we can notice that they are both, simple, cooperative, adaptive and most of the time successful. The relationship seems intuitively quite awkward at first glance. Indeed, Morality and Finance are, at first glance, potentially discordant concepts but the similarities are interesting and certainly worth dwelving more into.