



Abstract
Smart Beta Investing has revolutionized investment management field with the ability to offer higher returns with lower costs. The momentum factor in the Smart Beta universe often outperforms other popular factors, besides being well documented in the literature, it is found to be pervasive across different geographies and asset classes. In this paper, we implement a long-only momentum based investment strategy for the Indian equity markets that delivers superior risk-adjusted performance, derived upon comparing multiple strategies across time frames. Based on these tests, we find that the lagged 6-months’ compounded returns indicator with quarterly rebalancing can be used to generate the highest risk-adjusted performance.The paper also tests a related phenomenon called the Accelerated Effect of momentum as documented by Ardila et. al. (2021) for the Indian equity market, and finds that the accelerated momentum effect underperforms the traditional momentum both on an absolute and risk-adjusted basis.
Introduction
In the world of investment management, there is a constant debate over the superiority of active vs passive approaches with passive equity funds surpassing their active counterparts in terms of assets under management (AUM). 1 The passive approach relies on the idea of the Efficient Market Hypothesis propounded by Fama (1970) whereas the active approach relies on the belief that the markets have inefficiencies that can be exploited by the skilled manager to achieve superior returns. Active management allows for greater flexibility, broader risk management while assuming higher costs and key market risks. In contrast, passive management offers the advantage of low costs and easy access to markets while compromising on flexibility, diversification, and outperformance. Before the breakthrough achieved by Fama and French (1993) in identifying the value and size as risk factors, the active mangers used these factors to generate alpha (α) or excess returns over the benchmark while the passive managers focussed on achieving the beta (β) exposure to the single factor called “Market Risk Premium”. Now, as these factors are understood, they can be systematically extracted and repackaged to become “ Smart Beta” 2 instead of traditional alpha.
The risk factors used in smart beta investing are the style factors 3 Also called “Investment Factors”, “Dynamic Factors”: These factors explain the risks and returns within the asset classes including equities, fixed income, commodities, currencies, and even private equity and real estate. 4 The most widely recognized style factors are size, value, momentum, low volatility, quality and dividend 5 . It has been empirically proved that smart beta strategies consisting of small, cheap and outperforming stocks (representing exposure to size, value and momentum) have been able to significantly outperform the US stock markets (beta) for the period 1926–2019 by 2% (13.2% in the former vs 11.2% for the latter). 6 Several academic studies called smart beta products “a disruptive innovation for active management” (refer Kahn and Lemmon (2015, 2016)). More recently, Mateus et. al. (2020) evaluated smart beta ETF performance and provide the first evidence of the persistence of funds’ performance on a risk-adjusted basis suggesting that about 40% of smart beta ETFs outperformed their related traditional ETFs after accounting for expenses.
Another topic of debate is which factor has generated the most superior risk-adjusted returns. Calculations were performed on the Kenneth French’s data library 7 to provide intuitive idea of inter temporal performance of factor returns for different geographies. Upon comparing the performance of momentum –WML(Winners Minus Loosers) with market risk premium (RM-RF), size –SMB (Small Minus Big) and value-HML(High Minus Low), it was observed that momentum strategy has outperformed all other factors both on an absolute and risk-adjusted basis across geographies 8 For emerging markets, the sharpe ratio is slightly less for momentum compared to value (0.3933 vs 0.3990) but absolute returns were much higher (9.48% vs 8.57%). (see Appendix-1). Research has shown that on a historical basis, the momentum factor has been one of the strongest generators of excess returns 9 . The momentum factor introduced above is long the top-performing stocks (winners portfolio) and short the worst-performing stocks (losers portfolio). This study aims to test whether the long-only momentum based investable strategy can be successfully implemented for Indian equity markets to deliver the superior risk-adjusted returns. We seek to implement the long-only version of this popular strategy due to significant shorting restrictions 10 Naked short selling is not permitted in the Indian securities market and no institutional investor shall be allowed to do day trading. More details: in the Indian equity markets. The paper also tests a related phenomenon called the Accelerated Effect of momentum (refer Ardila et. al. (2021)) for the Indian equity markets.
The asset management industry has changed since the subprime crises of 2008–09 motivated by growth in reported equity market anomalies and a surge of investors’ interest to diversify beyond the traditional asset based building blocks with factor based funds gaining popularity in the investment management area. Passive funds notably indexed funds, exchange traded funds and fund of funds became quite popular with the investors particularly in India. Globally, smart-beta funds have gained investor traction and have already garnered $1.12 trillion worth of investments globally by March 2021, according to ETFGI’s Smart Beta industry landscape report. This period also saw the launch of first smart beta fund in June 2015 in India-Nippon India ETF NV 20. Also, amongst the factor strategies, post the global financial crises of 2008, momentum strategy suffered as a result of the high degree of volatility wherein momentum crashes have typically occurred as the market rebounded following large declines. One reason for the same is the time-varying systematic risk of the momentum strategy because momentum has significant negative beta following bear markets (refer Daniel & Moskowitz (2016)). Thus, following Ardila et. al. (2021), the study examines the amended version of the basic momentum strategy for the Indian markets which may offer a better hedge against equity market risk. The research setting to evaluate the performance of momentum factor strategy in the smart beta universe is very promising as Indian equity markets in 2022 became the fifth largest market in the world in terms of market capitalization ($3.21 trillion). 11 The Association of Mutual Funds in India (AMFI) is targeting nearly five-fold growth in AUM $1.47 trillion (from current $518.15 billion in January 2022) and more than three times growth in investor accounts to 130 million by 2025 12 Thus, the study contributes to the literature in adding evidence to our understanding of how a smart beta momentum strategy behaves for the contemporary period in an emerging market represented by India. Smart beta strategies exploit pricing anomalies created by emotional biases and information failures and with time as markets become more competitive, the efficiency of factor based strategy will depend upon combination of high intended factor exposure and low unintended factor exposure, including uncompensated and negatively compensated risks.
This study is unique in the context of Indian markets on the following grounds. First, until 1980 s, India’s development strategy mainly focused on self-reliance and import-substitutions. However, in the early 1990 s, India embarked on a path of economic reforms and eventually moved toward globalization. In 1992, foreign portfolio investors were allowed to invest in the securities traded on both primary and secondary markets. Due to this policy reform, foreign portfolio investment in the Indian stock market increased from USD 1.6 billion in 1993–94 to USD 251.5 billion in 2017–18, while mutual fund investment increased from USD 20.35 billion to USD 2.27 trillion over the same period 13 Handbook of Statistics: Security and Exchange Board of India (SEBI). Thus, India is one of the fastest-growing economies, and the Indian stock market has emerged as one of the most attractive markets not only for domestic but also for foreign investors. Second, the momentum investment index constructed in this paper is an investable strategy which can be implemented in the form of an Exchange Traded Product (ETP) via an index or ETF 14 These strategy form part of the momentum style factor strategies of the broader Smart Beta Universe as previously introduced.. Third, the index constructed is based on long positions only that would invest in the top decile/quintile portfolio formed based on the ranking of our chosen momentum indicator. This indicator is derived after backtesting various indicators with different time frames (3,6,12 months) and has outperformed its benchmark both on an absolute and risk-adjusted basis. Fourth, the study tries to correct for ex-post conditioning biases (look-ahead and the survivorship bias) which can overestimate performance as it selects constituents based on the historical index benchmark constituents as on the date of the rebalancing. The similar processs is also adopted for asset pricing tests. Fifth, we also test the related concept of momentum i.e. Acceleration Effect (refer Ardila et. al. (2021)), which refers to the change in momentum for the Indian equity markets. Lastly, we test the excess returns produced by the strategy for the standard asset pricing models, namely CAPM given by Sharpe (1964) and Fama French 3 factor (henceforth FF3F) model given by Fama and French (1993). The findings are important in the context of Indian asset management industry as the passive/smart beta fund offering is still in the nascent stage, and proliferation of these products is essential for increasing the market participation.
The rest of the paper is organized as follows: the second section provides a brief review of the extant literature. Third section outlines the research design while the fourth section discusses the empirical results of various backtests and asset pricing tests. The final section presents the summary and concluding remarks.
Literature review
One of the first documented citations of the momentum effect was done by Jegadeesh and Titman (1993) which documented that the strategies which buy the past winners and sell past losers tend to generate significant positive returns over 3–12 month time horizon. This finding was also confirmed by Grinblatt et al. (1995), suggesting that the mutual funds invested in momentum strategy realized significantly better performance than other funds. Wermers (1997) not only confirmed the presence of momentum effect in stock returns but also demonstrated that the use of active momentum strategies by mutual funds is the reason for their persistent performance. All of these studies focussed on U.S. equity markets. This phenomenon was also documented by Rouwenhorst (1998) for European countries as out-of-sample evidence. Jostova et al. (2013) demonstrated that the momentum effect could be exploited in the U.S. corporate bond markets for lower-grade bonds. Beracha and Skiba (2011) demonstrated statistically significant returns for momentum strategy deployed on U.S. residential mortgage market for more than 380 metropolitan areas. Momentum effect is not only present across different countries and asset classes, but it was found to be evident for more than 212 years according to the world’s longest backtest by Geczy and Samonov (2016) for the U.S. equities from 1801–2012. Another study by Chabot et al. (2014) also dates this phenomenon back to the Victorian age for the U.K. equities accounting for 140 years of data and found that momentum strategies have delivered abnormally high risk-adjusted returns.
For the emerging markets, Rouwenhorst (1999) first conducted the study on 20 emerging market countries found the momentum effect is pervasive. Whereas for Asian markets, Chui et al. (2000) analyzed momentum strategies and found them to be highly profitable 15 The Asian countries included Hong Kong, Indonesia, Japan, S. Korea, Malaysia, Singapore, Thailand and Taiwan. For Indian markets, the first evidence of the momentum effect is documented by Sehgal and Balakrishnan (2004) who used data spanning from July 1989 to March 1999. Their findings included the weak reversal pattern in the long run and strong continuation pattern in the short run, indicating the significant presence of momentum. Kumar and Gupta (2008) followed the J months/ K months 16 J refers to the number of months the strategy uses to select the stocks (1–4 Quarters) and K refers to the holding period (1-4 Quarters) methodology of Jegadeesh and Titman (1993) for the Indian markets for the period and found that returns for all the J’s (1–4) are the highest in 1st-month post portfolio and keep decreasing thereafter. Joshipura (2011)) also tested the momentum investment strategy in Indian markets using large liquid stocks and found significant post-formation returns for 3–12 months. More recently, Garg and Varshney (2015) also demonstrated the robustness of the momentum trading strategy in the Indian markets for the period 2000–2013. Extant literature documents that momentum is often attributed to investors’ behavioral characteristics. 17 Momentum profit gererate due to over-confidence, self-attribution and confirmation biases (refer Daniel et al. (1998)); under-reaction and over-reaction (refer Barberis et al. (1998)); herding (refer Hoitash & Krishnan (2008); Demirer et al. (2015)). It could also perhaps be accounted for by assuming efficient markets with rational investors in the presence of information noise (refer Crombez (2001)).
Empirical literature has documented momentum strategy returns in different asset classes (refer Asness et al. (2013); Da Dalt et al. (2019)) but the Acceleration Effect in momentum remains a thinly tested phenomenon academically. Ardila et. al. (2021) tested the Acceleration Effect for the U.S. markets for the period May 1963–December 2013 and found that the effect provides better performance and higher explanatory power than momentum strategy. In contrast, Xiong and Ibbotson (2015) demonstrated that accelerated stock prices is a strong contributor to poor future performance and has a higher probability of reversal. To the best of our knowledge, there is no study conducted that tests if the long-only momentum strategy due to significant shorting restrictions can be implemented in Indian equity markets to outperform the traditional market benchmarks. Moreover, the backtests performed in this paper are robust as they correct for ex-post conditioning biases (look-ahead and the survivorship bias). This study further tests empirically the presence of Acceleration Effect of momentum strategies in the context of India.
Research design
Data
We use the S&P BSE-100 index as our benchmark for the stock universe. The reason for selecting the S&P BSE-100 index is that it comprises of largest and highly liquid securities from the S&P BSE LargeMidCap index selected based on annualized traded value and trading days 18 Since our index would require frequent rebalancing, liquidity of the benchmark stocks is of paramount importance as both explicit and implicit costs rise with the number of trades. We use CMIE Prowess as the data source for the historical data for the below fields for S&P BSE-100 index constituents and S&P BSE-500 index which we have considered as a proxy for the broad market benchmark 19 This study utilizes the below datasets:
Adjusted 20 The share prices have been adjusted for capitalisation changes such as bonus, rights and stock splits to make the price series comparative over time. closing price for all the historical index constituents to reflect the changes due to dividends and corporate action events on stocks
Market capitalisation for all the historical index constituents, it is used to calculate the market cap weighted momentum indices and the SMB, HML factors for FF3F model.
Price to book ratio (P/B) for all the historical index constituents, the ratio to segregate high book to market stocks (Low P/B), and low book to market stocks (High P/B).
Index constituent change history for S&P BSE-100 index and S&P BSE 500 index.
Following extant literature, monthly data is used for asset pricing tests as the models (CAPM, FF3F) are appropriate at low frequencies and will not price assets correctly when applied at high frequencies (refer Gilbert et. al. (2014)). The yield on 91days Treasury-bill is obtained from the RBI handbook of monthly statistics and used as a proxy for the risk-free rate.
The reference period for the study is chosen to be January 2009 to April 2020 because this period is sufficiently long (greater than ten years) and includes a wide range of regimes in the Indian capital markets. To make the study more robust, we perform the comparison of different momentum strategies over the longer horizon- January 2005 to April 2020, and a more recent horizon of January 2015 to April 2020.
Methodology
Risk attribution parameters
For the risk attribution, we calculate the below parameters for performance comparison. Cornish -Fisher VAR: It is an expansion to compute VAR analytically based on the skewness and kurtosis of the distribution (refer Favre and Galeano (2002)). The adjustment is as follows:
S = skewness K = excess kurtosis Historical VAR: This method calculates VAR using the historical data with no assumption regarding the underlying distribution of returns. Sharpe Ratio: This is the most commonly used measure to compare risk-adjusted performance Maximum Drawdown: This is the measure that denotes the maximum drop occurred from the recent peak, quoted as a percentage of the peak value. It denotes the worst case loss experienced by the portfolio.
Momentum as in standard finance literature has been defined as change in stock prices. To develop the optimal momentum index that delivers the superior risk-adjusted performance than S&P BSE-100 index, we construct various momentum indicators of different time frames (lagged 3 months, 6 months, 12 months). We have used the equally weighted scheme as compared to the market capitalization weighted scheme because the former has shown to be outperforming the latter (refer Plyakha (2012); Bolognesi et. al. (2013)). The momentum investment index is constructed based on the indicator as follows: On index start date i.e. 30th January 2009, the index value is assumed to be 1000. On the index start date and each subsequent index rebalancing date, index constituents as on the rebalancing date of S&P BSE-100 index are ranked on the basis of momentum. The similar process is repeated for all the tested momentum indicators (3 month, 6 month, 12 month) to construct the corresponding momentum index. The ranked securities are then classified into five/ten portfolios (quintiles/deciles) i.e P1 to P5 (P1 being the top quintile and P5 the lowest) or D1 to D10 (D1 being top decile and D10 the lowest). The 10/5 stocks selected are weighted equally to form the index based on the index value on the rebalancing date. E.g. On index start date (1st rebalancing date) the worth of each stock in the index would be Rs.100 (1000*0.1). The index value for the subsequent months is derived based on the market value of the selected index constituents
21
Calculations do not include transaction costs into consideration, this is a matter of further research.
Here, [P]t is the price matrix and [N]t denotes the number of shares of each constituent derived as follows:
[n0, n1 . nn]t = [index t - 3 *0.1/P (0,t - 3) , index t - 3 *0.1/P (1,t - 3) , index t - 3 *0.1/P (n,t - 3) ]
for t> = 4, for t = 1 index t - 3 = 1000
The index constituents once selected are held in the portfolio for three months which is the rebalancing frequency 22 Portfolio rebalancing decision involves a trade-off between optimal asset allocation and trading costs. There is no optimal frequency or threshold for rebalancing (More Details: The same process is followed every three months, and we perform these backtests for various momentum indicators (3 month, 6 month, 12 month) to arrive at the momentum investment index delivering the highest risk-adjusted returns. The excess returns of the Decile-1/Quintile-1 portfolio formed on the best performing momentum investment index is then subjected to the asset pricing tests. To test the hypothesis that chosen momentum investment strategy is not dependent on the chosen rebalancing frequency, the analysis of final index value vs rebalancing frequency is done. Empirical results show that there exists no relationship between them. Since momentum is a short term phenomenon, rebalancing frequencies greater than 3-months do not justify the underlying phenomenon. Hence, between monthly and quarterly rebalancing, we choose quarterly rebalancing as the monthly rebalancing would involve significant trading costs both explicit and implicit, especially in the case of an emerging market like India.
To explain what factors contribute to the behaviour of returns, we use standard asset pricing models (i) CAPM model (ii) FF3F model. The CAPM model uses only 1 factor (market risk premium) whereas the FF3F model uses two additional factors SMH (return difference of small-sized and large-sized firms representing size factor) and HML (return difference of high book/market firms and low book/ market firms representing value factor) to explain the asset returns.
To explain the superior returns of our momentum strategy, first, we check if the returns can be explained by the CAPM model. As discussed previously, S&P BSE-500 index is used as the market proxy
The parameters of the above equation are estimated using OLS regression by taking the excess returns for each Decile/Quintile as a dependent and market risk premium as an independent variable.
To test whether we can improve the explanatory power of the model, we use the FF3F model.
The following equation can describe the FF3F Model:
Following Sehgal et al. (2012), we construct a 2*2 size-value partition to form SMB and LMH portfolios. At the end of June each year 23 As in India we follow the financial year convention of April-March, the 3-month gap is maintained as the financial results for a particular financial year take time to be released and incorporated. (2009–2019) all the constituents of the S&P BSE-500 index at that time are ranked and segregated into two groups “Small” and “Big” based on whether the market capitalization is greater or less than the median of all the constituents. Similarly, the stocks are also ranked based on the P/B ratio and segregated into two groups “High” and “Low” with stocks falling into “High” category representing the stocks with high Book/Market Value than the median (low P/B value) and the stocks falling into “Low” category representing the stocks with low Book/ Market Value (High P/B value). We form 4 stylized portfolios (“Small-High”, “Small-Low”, “ Big-High”, “ Big-Low” based on the interaction of size and book/market factors. The market capitalization weighted returns are calculated for each of the four stylized portfolios from July to following June. SMB is calculated as the difference between the average returns of 2 small –stock portfolios (“Small-High” and “Small-Low”) and the average returns of the two large –stock portfolios (“Big-High”, “ Big-Low”). HML is calculated as the difference between the average returns of 2 high Book/Market Value portfolios (“Small-High”) and (“Big-High”) and the 2 low Book/ Market Value portfolios (“Small-Low”, “Big-Low”). The parameters of the above equations are estimated using OLS regression with excess returns of the decile/quintile portfolio as the dependent variable and the Market Risk Premium (RM-RF), SMB, and HML as the independent variables.
Backtest performance of various momentum index strategies
In this section, we present the various backtest results performed across three different periods (January 2009 to April 2020, January 2005 to April 2020 and January 2015 to April 2020) for different momentum indicators tested. So, we compare decile D1 (D1 representing highest momentum stock portfolio) portfolio of lagged 6-months’ compounded returns (to avoid microstructure and liquidity biases) with 6-months’ compounded returns indicator, 3-months’ compounded returns indicator, and 12-months’ compounded returns indicator. Mathematically the indicators can be described as follows.
Figure 1 presents the various backtest results performed across three different periods (January 2009 to April 2020, January 2005 to April 2020 and January 2015 to April 2020) for different momentum indicators tested (lagged with non lagged momentum strategies).
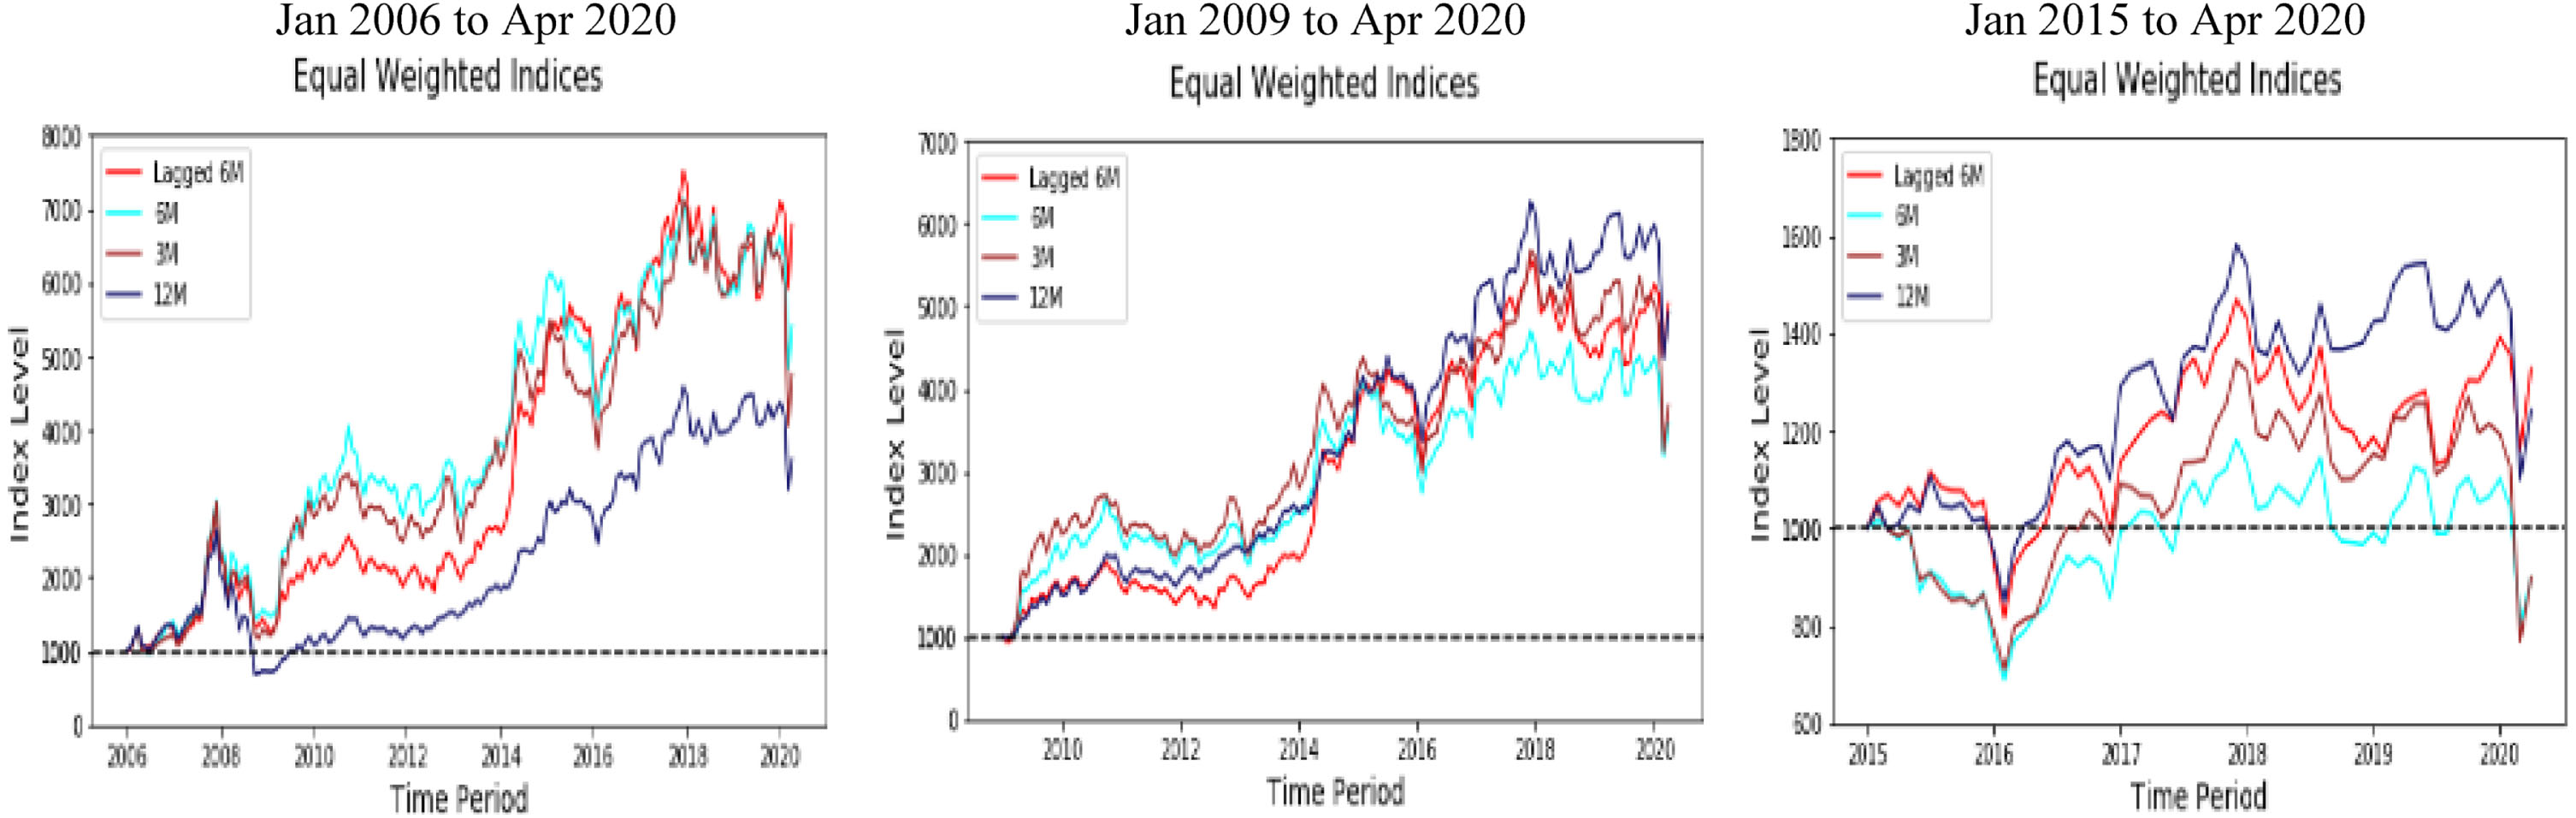
Comparison with various momentum strategies (Source: Authors Computations).
Based on the above Table 1 results, we infer that lagged 6-months’ compounded returns indicator produces the highest annualized returns in all three periods. Also, except for the period Jan 2009–Apr 2020 where the strategy has produced the highest sharpe ratio, for the same period the sharpe ratio of lagged 6-months’ compounded returns performance was less than that of 12- months’ compounded returns owing to higher volatility of returns. But upon further analysis of other periods, it appears that 12-months’ compounded returns indicator underperformed consistently. The reason for this trend could be that momentum is a short term phenomenon that may not persist over the longer time horizons. Also, the 12-months’ compounded returns indicator has shown very high kurtosis, which indicates that the returns have leptokurtic distribution indicating fat tails and higher probability of extreme loss/gain.
Strategy performance (Source: Authors Computations)
Next, we backtest various momentum indicators to test which indicator provides the highest risk-adjusted returns across all three periods. We compare the performance of D1 portfolio of lagged 6-months’ compounded returns with other lagged indicators, namely lagged 3- months’ compounded returns indicator and lagged 12 –months’ compounded returns indicator respectively. Mathematically, the indicators can be described as follows.
Figure 2 presents the various backtest results performed across three different periods (January 2009 to April 2020, January 2005 to April 2020 and January 2015 to April 2020) for different momentum indicators tested (lagged momentum strategies).
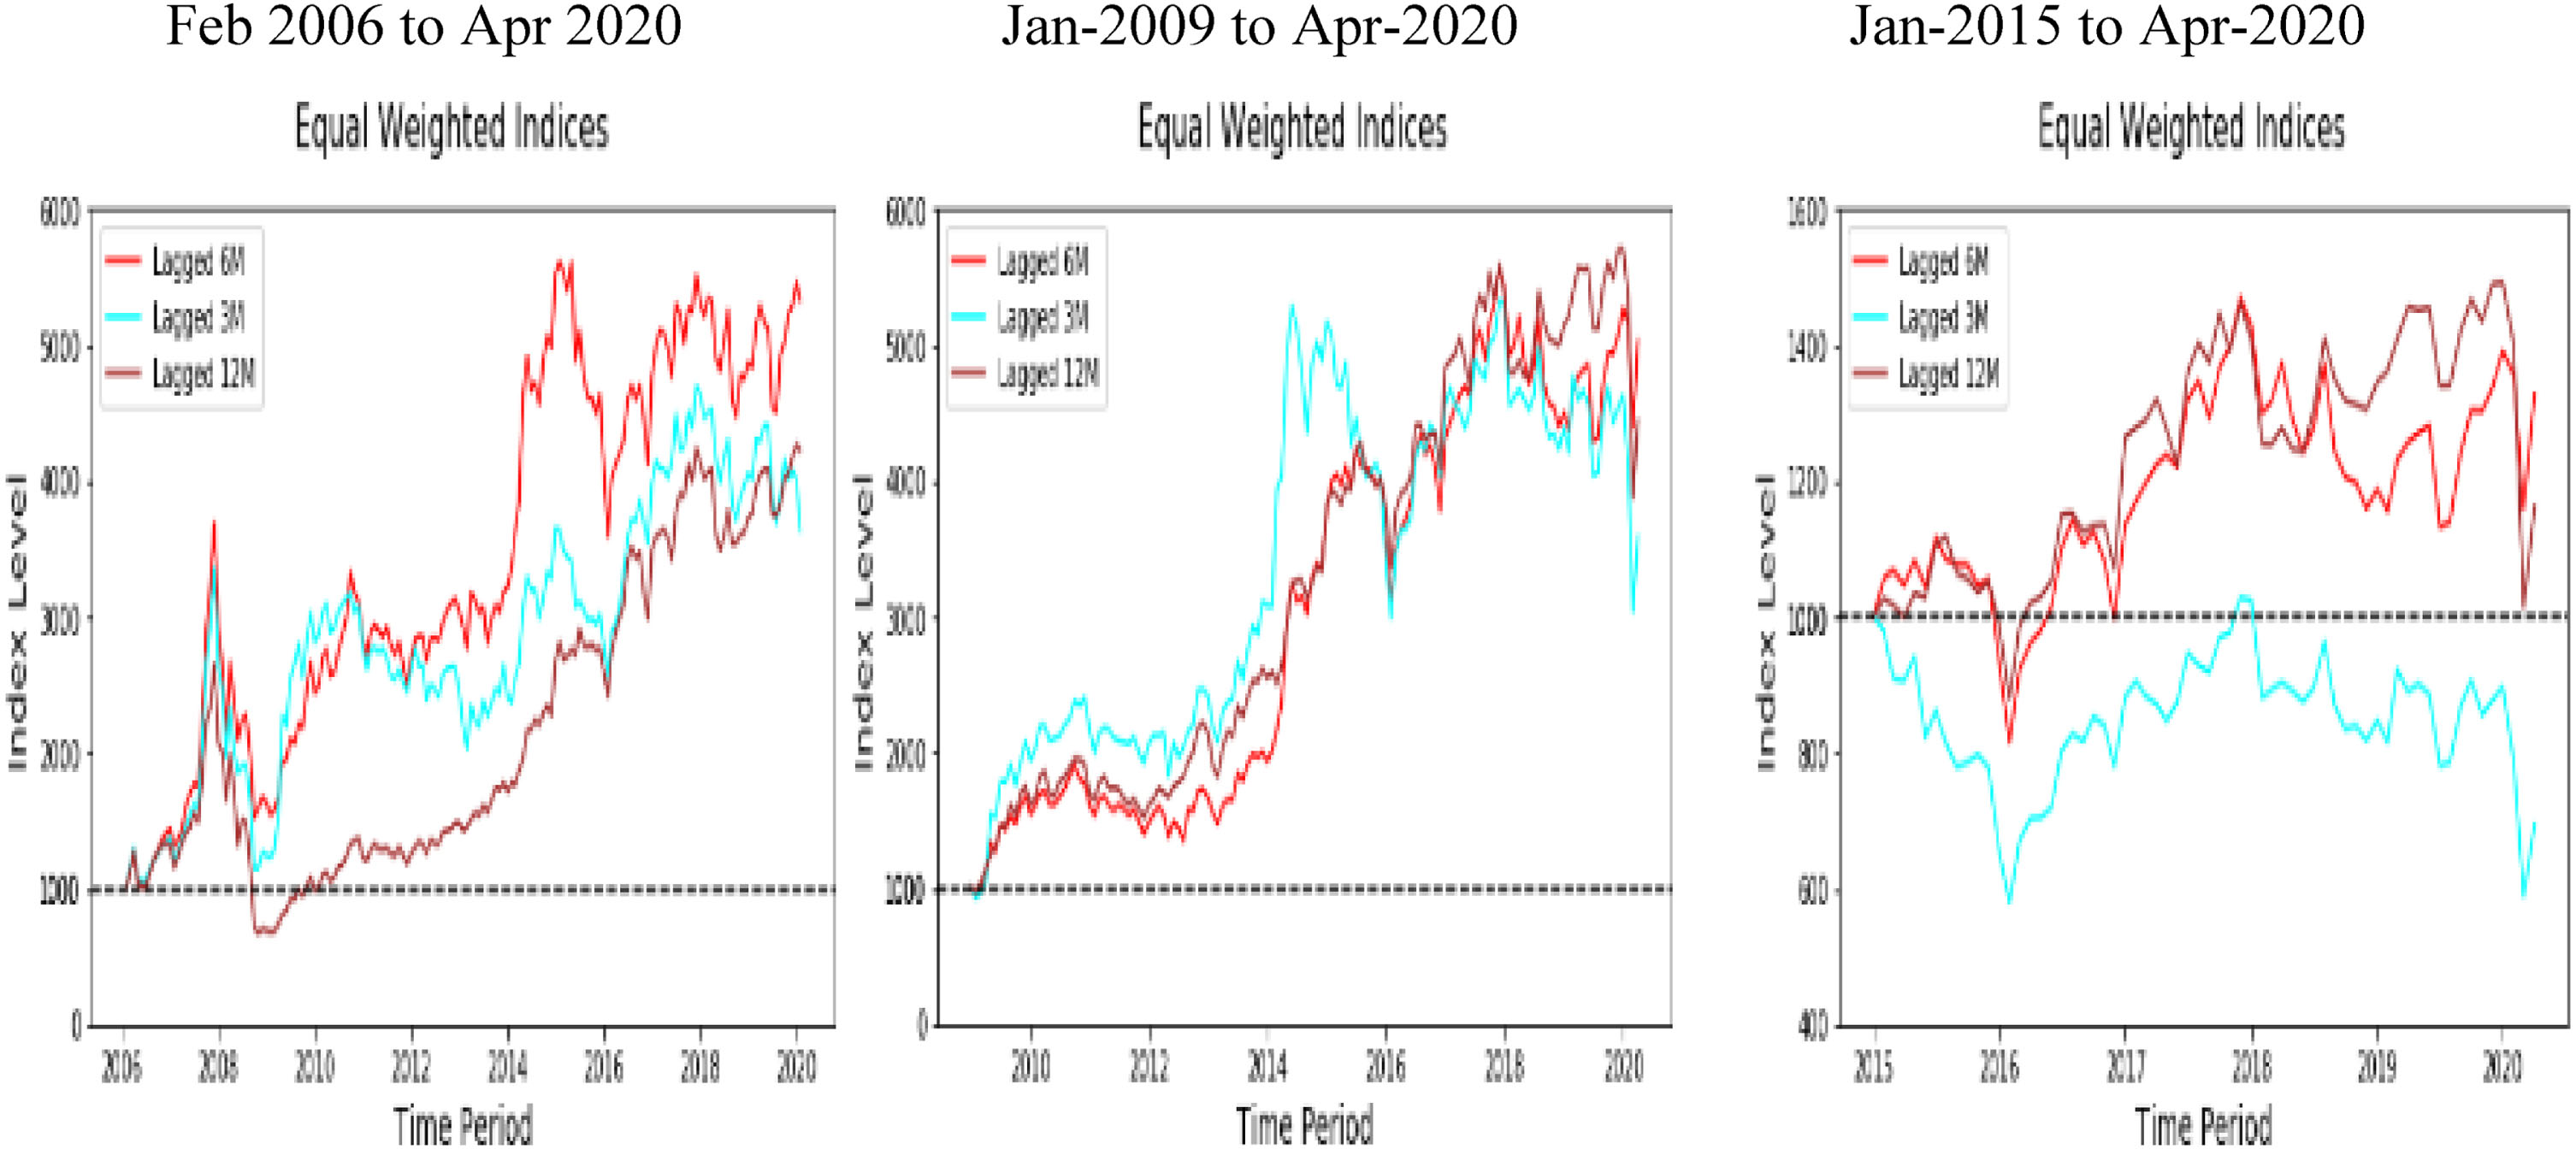
Comparison with lagged momentum strategies (Source: Authors Computations).
Based on the Table 2 results, we can infer that in all the three periods, lagged 6-months’ compounded returns indicator delivered better risk-adjusted returns than the other two lagged momentum indicators (6 months and 12 months). Also, maximum drawdown in each of the three periods is least indicating a lower worst-case loss. The kurtosis measured for our strategy is the least in all three periods indicating less leptokurtic distribution and hence lower probability of extreme loss and gains.
Strategy performance (Source: Authors Computations)
The below Fig. 3 presents the comparison of long only index with benchmark (S&P BSE-100) and bottom decile portfolio (D10) of lagged 6 months compounded returns which has shown high risk adjusted returns with lowest drawdown as was deduced in the previous cases.
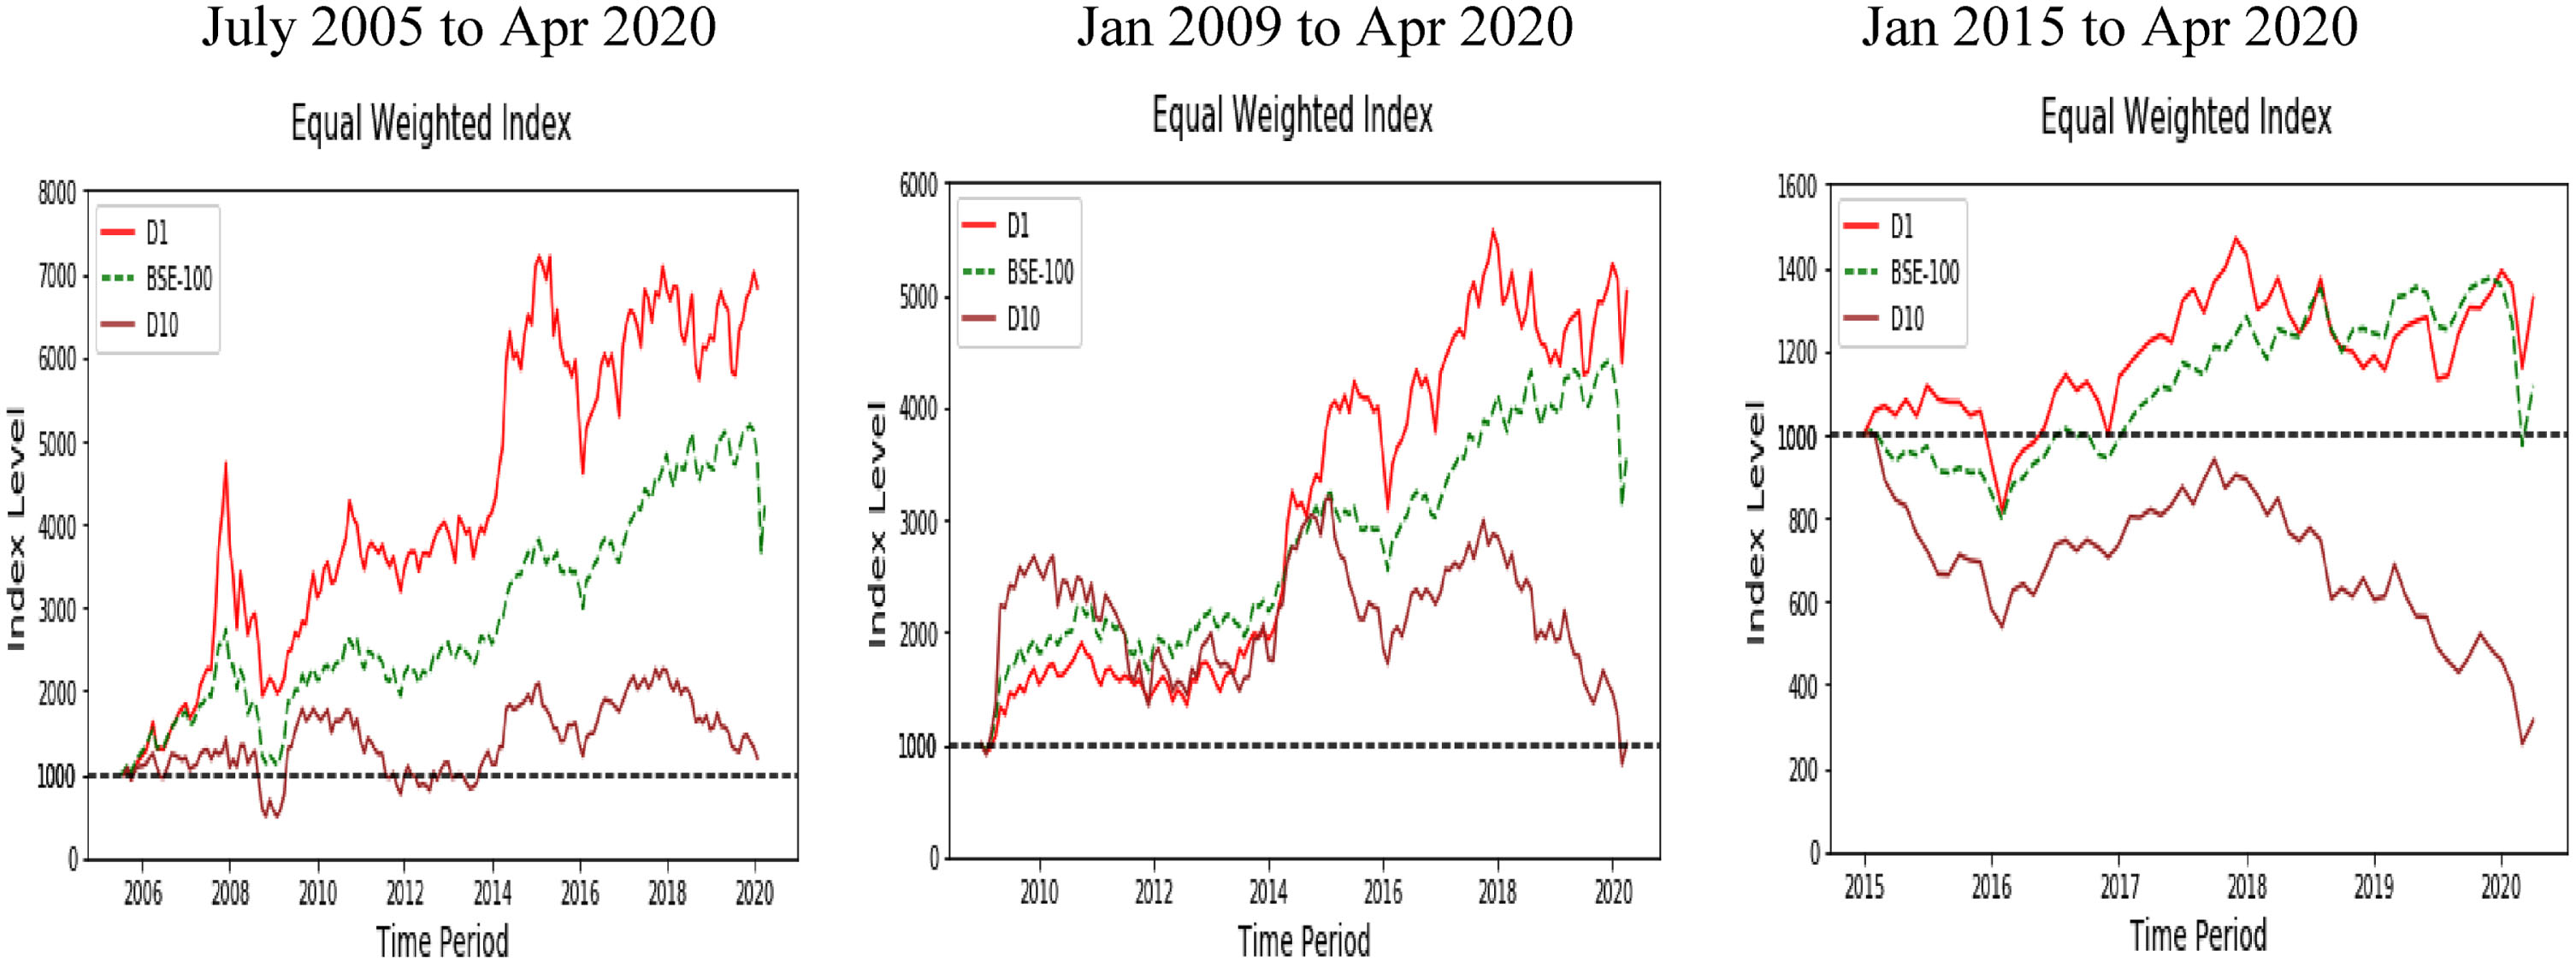
Comparison of index performance (Source: Authors Computations).
Based on the Table 3 results, we can infer that the top decile portfolio (D1) outperforms the benchmark (BSE 100 index) both on an absolute basis and risk-adjusted basis in all three periods. For our reference period, Jan 2009–Apr 2020, the top decile portfolio (D1) outperforms S&P BSE 100 by 3.43% p.a., while the bottom decile portfolio (D10) under-performs by 11.99%. The trend is the same for other periods as well. These results confirm the presence of momentum effect in Indian equity markets. The sharpe ratio for the D1 portfolio is 11.28% higher than that of S&P BSE-100 while that of the D10 portfolio is massive –40.74% lower than that of S&P BSE-100 Index. The maximum drawdown for the D1 portfolio has been less than that of S&P BSE-100 in all three periods, but that of D10 has been much worse at –74.19%. It can also be inferred from above that the kurtosis of D1 portfolio in all three periods is less than those of the S&P BSE-100 index and D10 portfolio. Hence, the return distribution of D1 portfolio is a less leptokurtic and hence lower probability of extreme loss and gains. Also, we can conclude that for Indian equity markets, the momentum strategy performs much better both on an absolute and risk-adjusted basis.
Index strategy performance (Source: Authors Computations)
Next, we compare the D1 portfolios of 6-months’ compounded returns with various accelerated momentum effect indicators to check if indeed accelerated momentum indicators can be used to increase the performance of momentum indicators. We define the various indicators as follows.
Figure 4 presents the various backtest results performed across three different periods (January 2009 to April 2020, January 2005 to April 2020 and January 2015 to April 2020) for different momentum indicators tested.
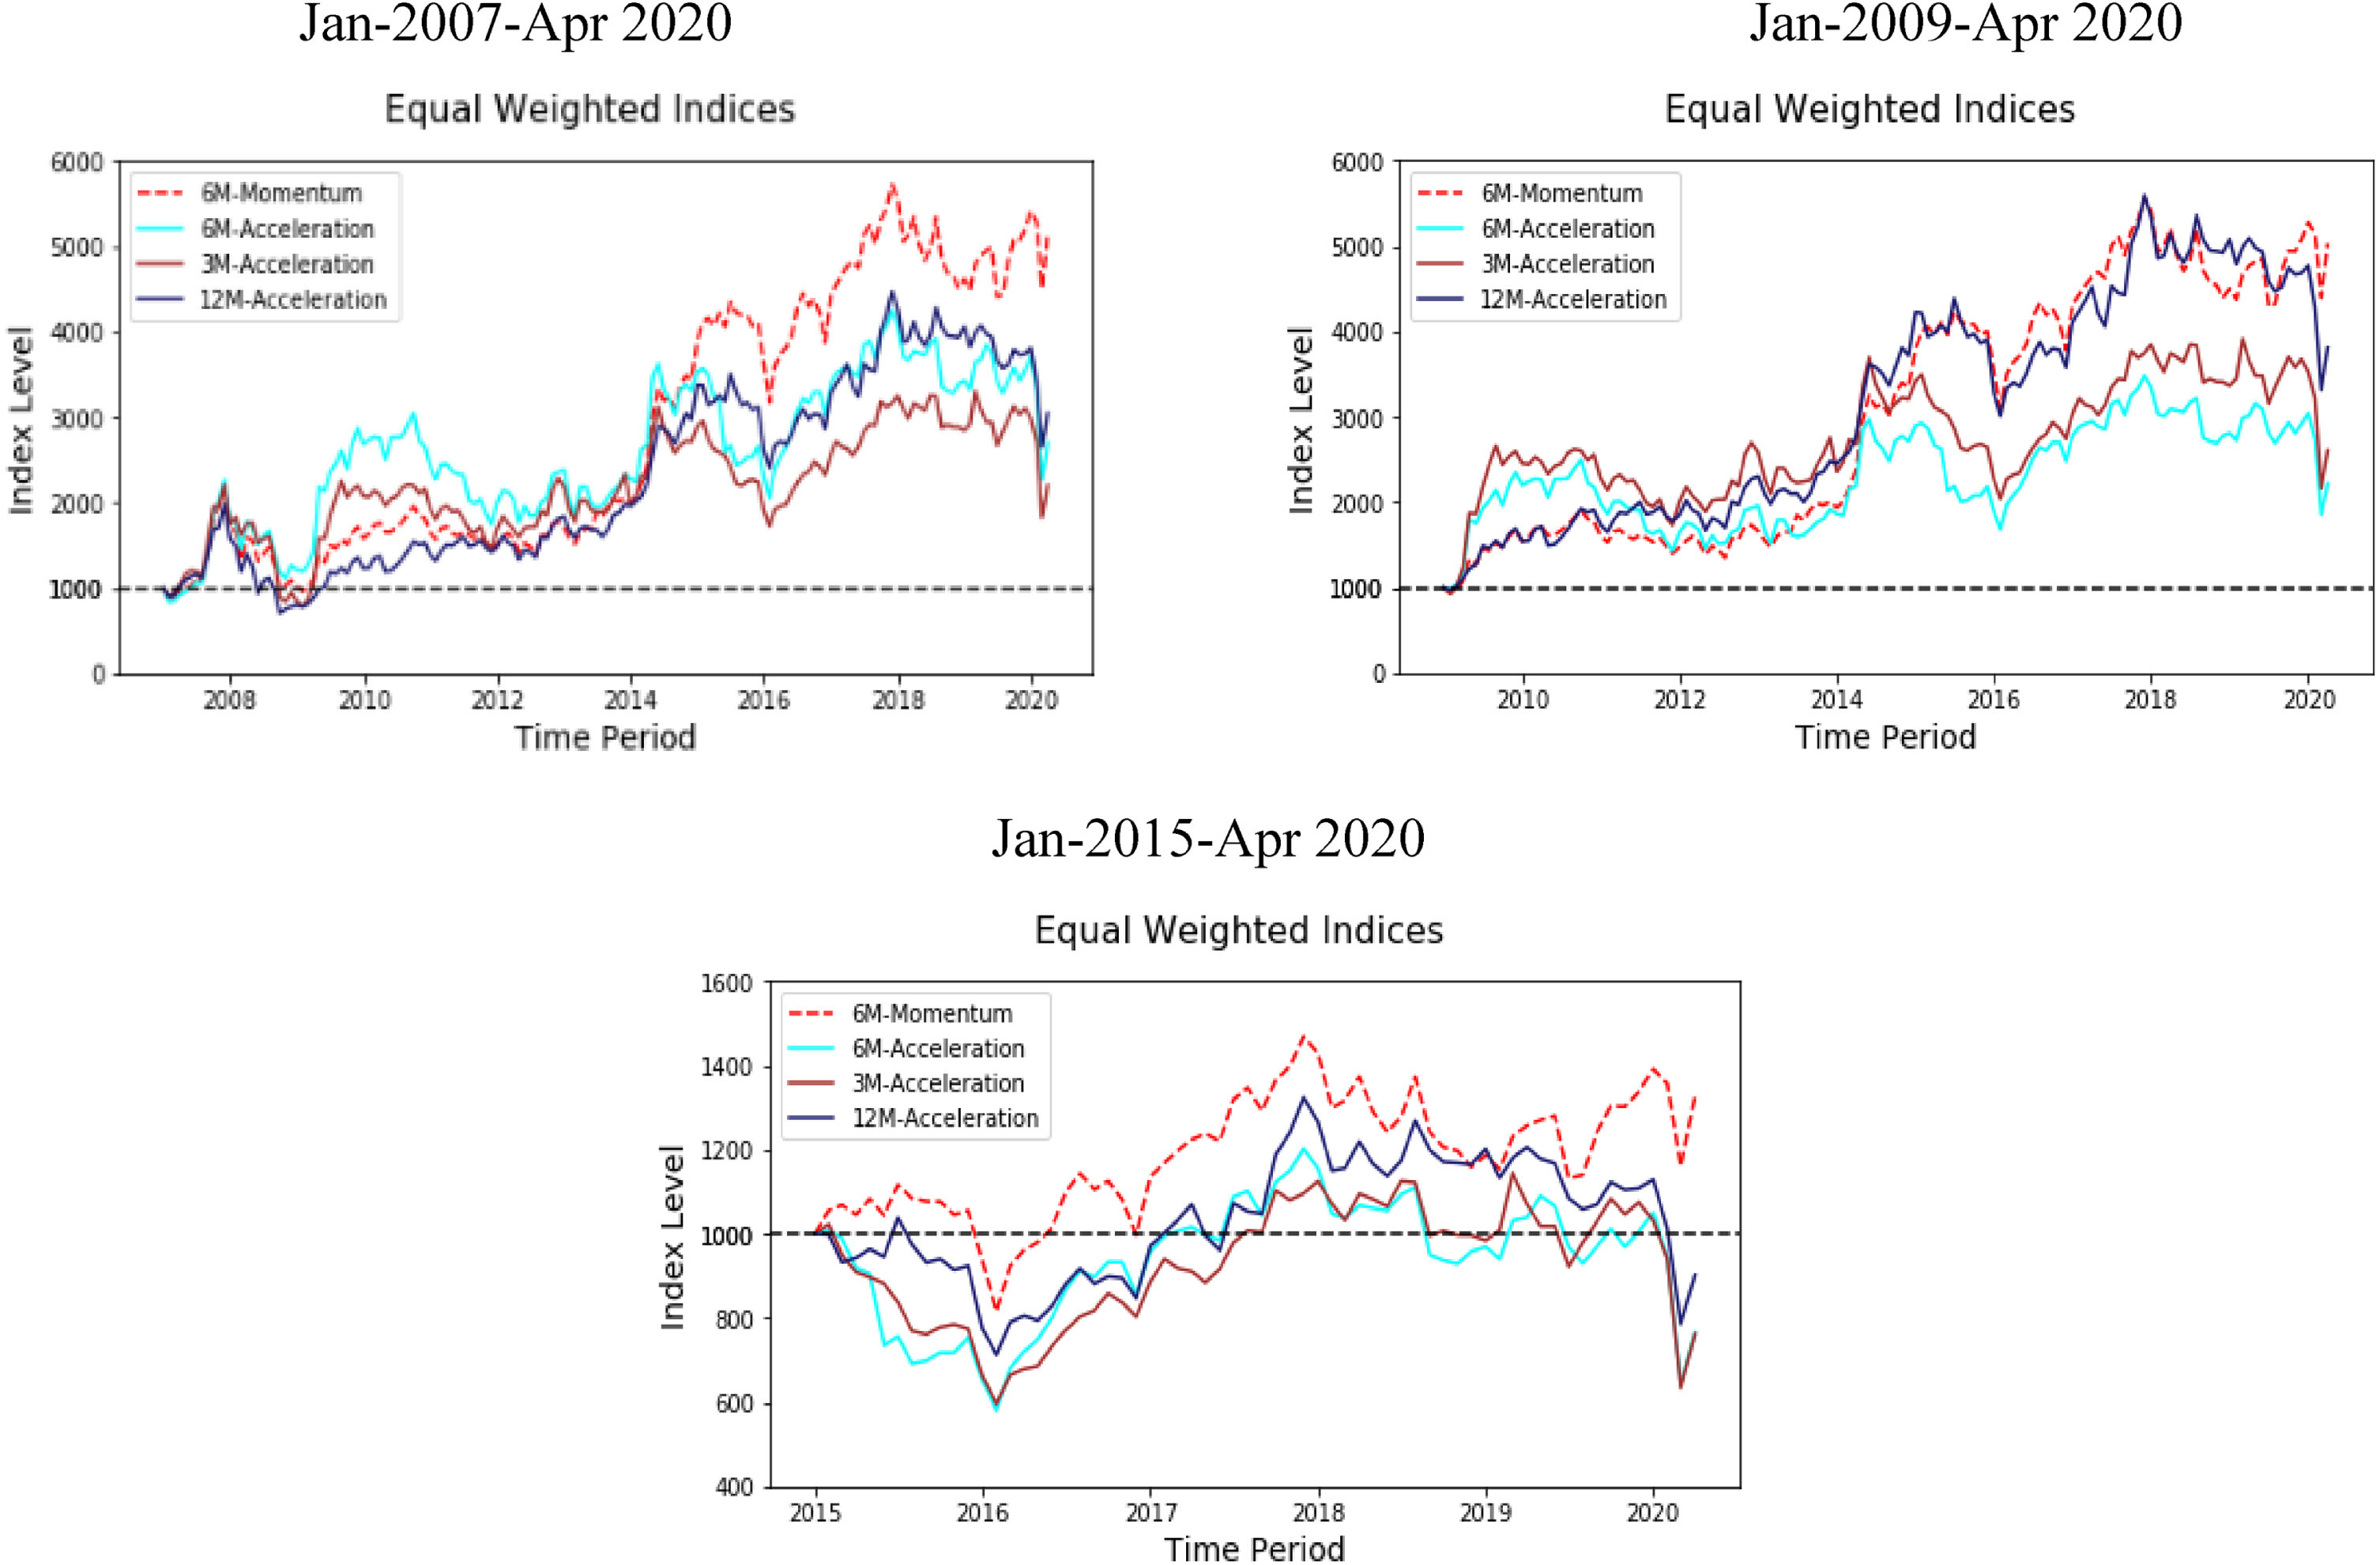
Comparison acceleration momentum effect strategies (Source: Authors Computations).
Based on the Table 4 results, one can conclude that accelerated momentum effect indicators fail to outperform 6-months’ compounded returns indicator in all three periods both on an absolute and risk-adjusted basis. Moreover, on comparing the returns of accelerated momentum indicators with the corresponding momentum indicators (e.g. 3-months’ momentum with 3-months’ acceleration), we find that momentum indicators produced better results than acceleration effect indicators both on an absolute basis and risk-adjusted basis.
Stratgey performance (Source: Authors Computations)
The non-performance of related momentum strategy i.e. accelerated momentum over traditional momentum strategies for the sample period under study indicates either that the sample period is not long enough so as to harvest the factor premiums (as the premium is time varying) or the markets have become informationally efficient over time as evidenced by Sharma et. al. (2021). Institutional participation has increased in the Indian markets with rising inflows from more sophisticated foreign institutional investors (FIIs) and domestic institutional investors (DIIs) in the decade from 2010–2020. 24 Money Control Market Stats Data. Retrieved from Hedge funds investments also are now permitted in India as per SEBI Alternate Investment Funds guidelines (2012 onwards). 25 Retrieved from These institutional investments have strengthened the price discovery process in the Indian markets alongwith regulatory and institutional interventions like new Companies Act 2012, greater transparency in reporting of asset quality by the banks, stringent disclosure norms for listed companies, insolvency and bankruptcy law, enhanced investor protection have collectively led to greater maturity to the Indian market (refer Sharma et. al. (2021)). Also, unlike the long-short strategy adopted by Ardila et. al. (2021), the current study provides a long-only momentum-based investment strategy for the Indian equity markets and this could be the reason for non-performance of accelerated momentum strategy over traditional momentum strategies.
In this section, the index performance of different portfolio formations based on deciles and quintiles are compared to study the persistence of the momentum effect.
Figure 5 indicates that there is a decreasing trend in index value performance for deciles when we move from D1 to D10 with some aberrations in between. This trend is even stronger with monotonically decreasing trend for quintiles. This confirms the presence of momentum phenomenon in Indian markets.
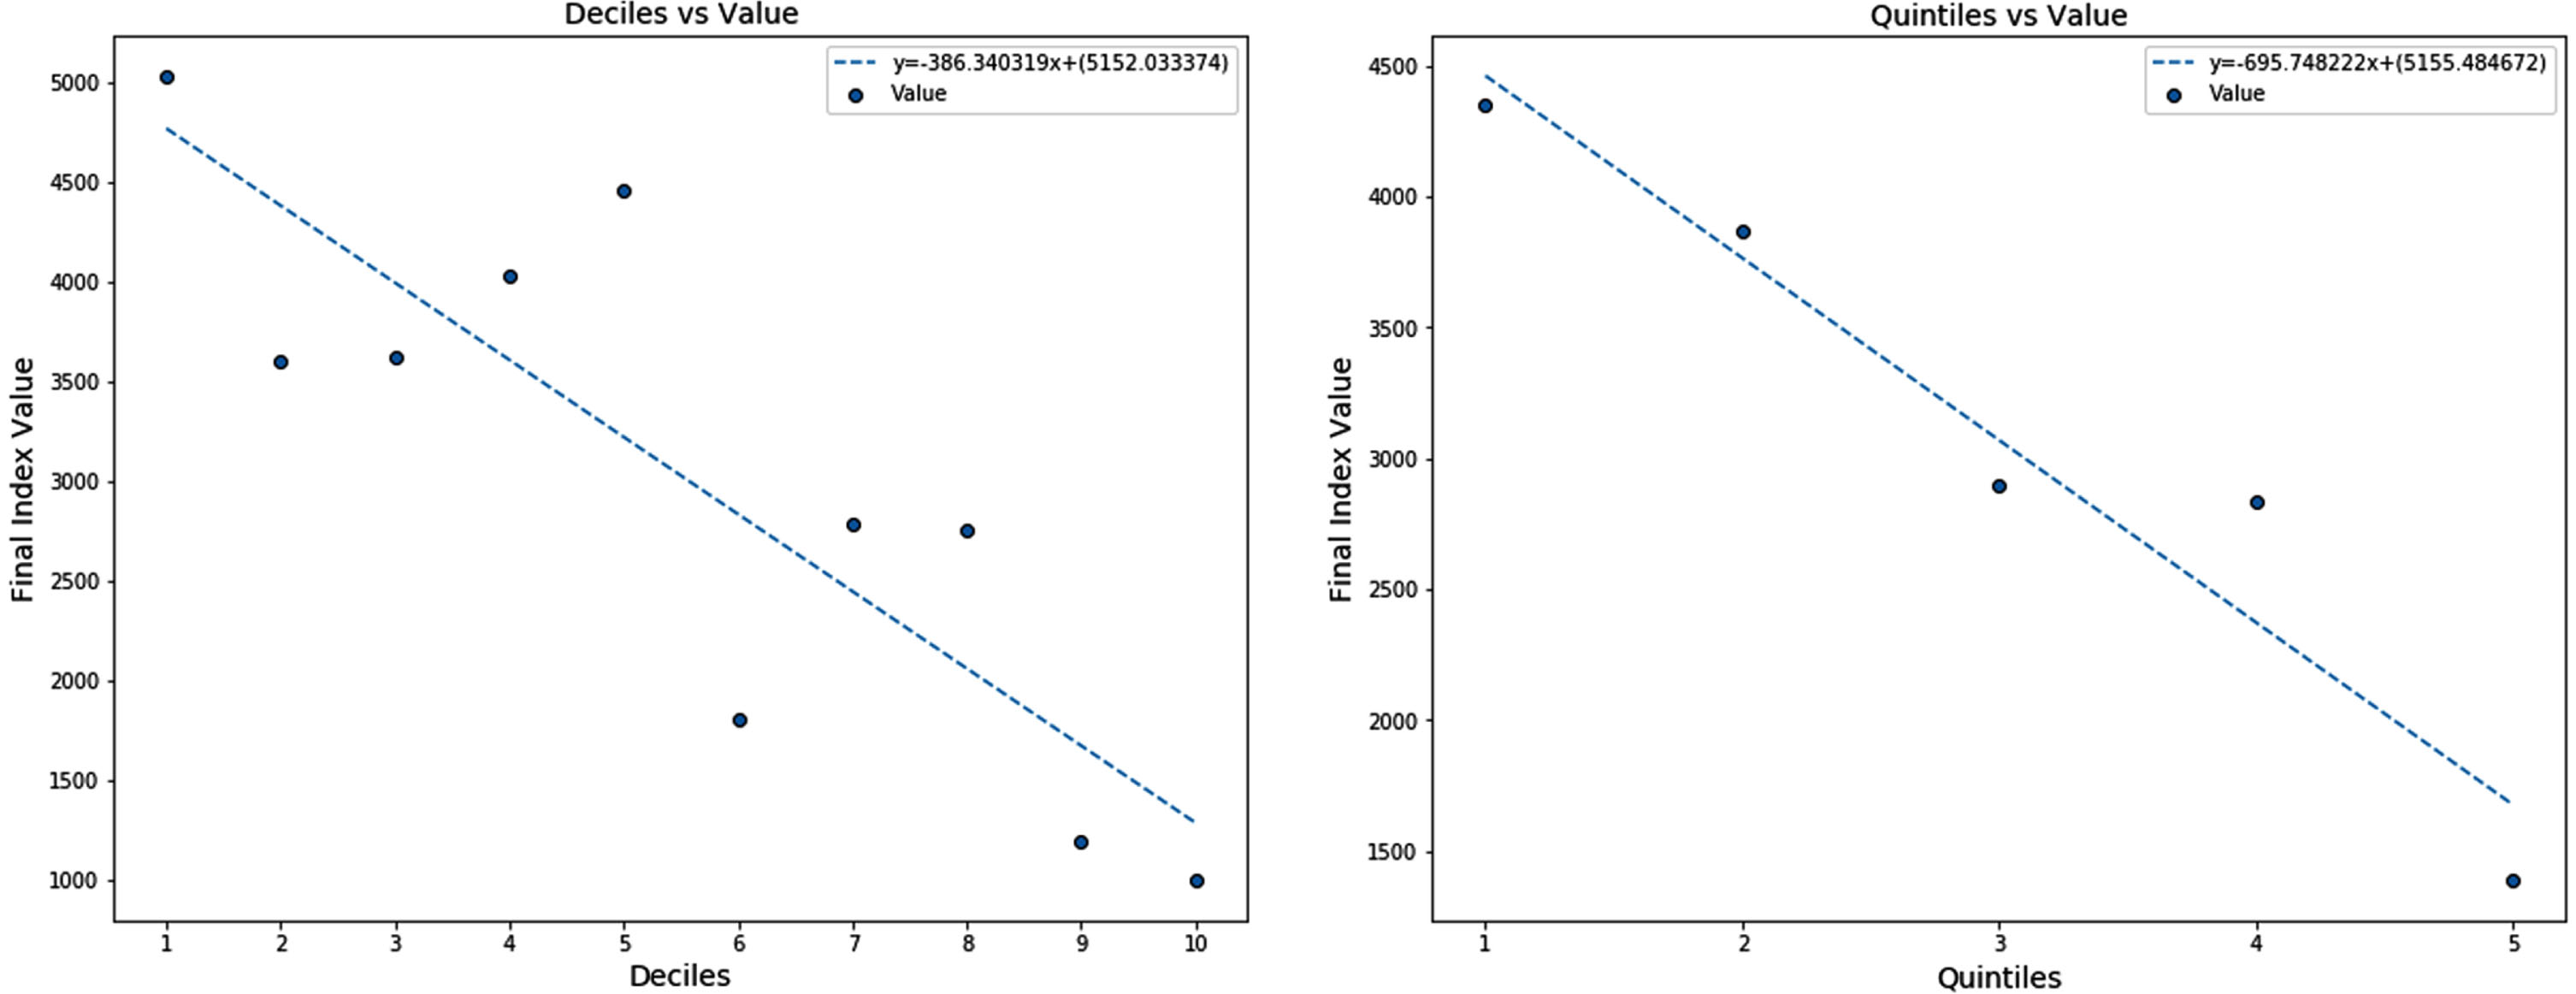
Final index value for all decile/quintile portfolio (Source: Authors Computations).
Another observation that can be made from Table 5 is that while moving from D1 to D10 as also from Q1 to Q5, the annualizied returns decrease and volatility increases thereby implying that stocks with high momentum perform well both on an absolute basis and risk-adjusted basis.
Risk return performance across deciles/quintiles (Source: Authors Computations)
Figure 6 indicates the change in the final index value to change in the rebalancing frequency for our chosen lagged 6 months compounded returns momentum indicator. We can observe that there exists no relationship between rebalancing frequency and final index value (return performance). Also, an OLS regression performed with final index value being the dependent variable and the rebalancing frequency being the independent variable conveys that the variation in rebalancing frequency does not explain the variation in final index value as the coefficient of determination is 0.8% and the factor loading is also not significant.
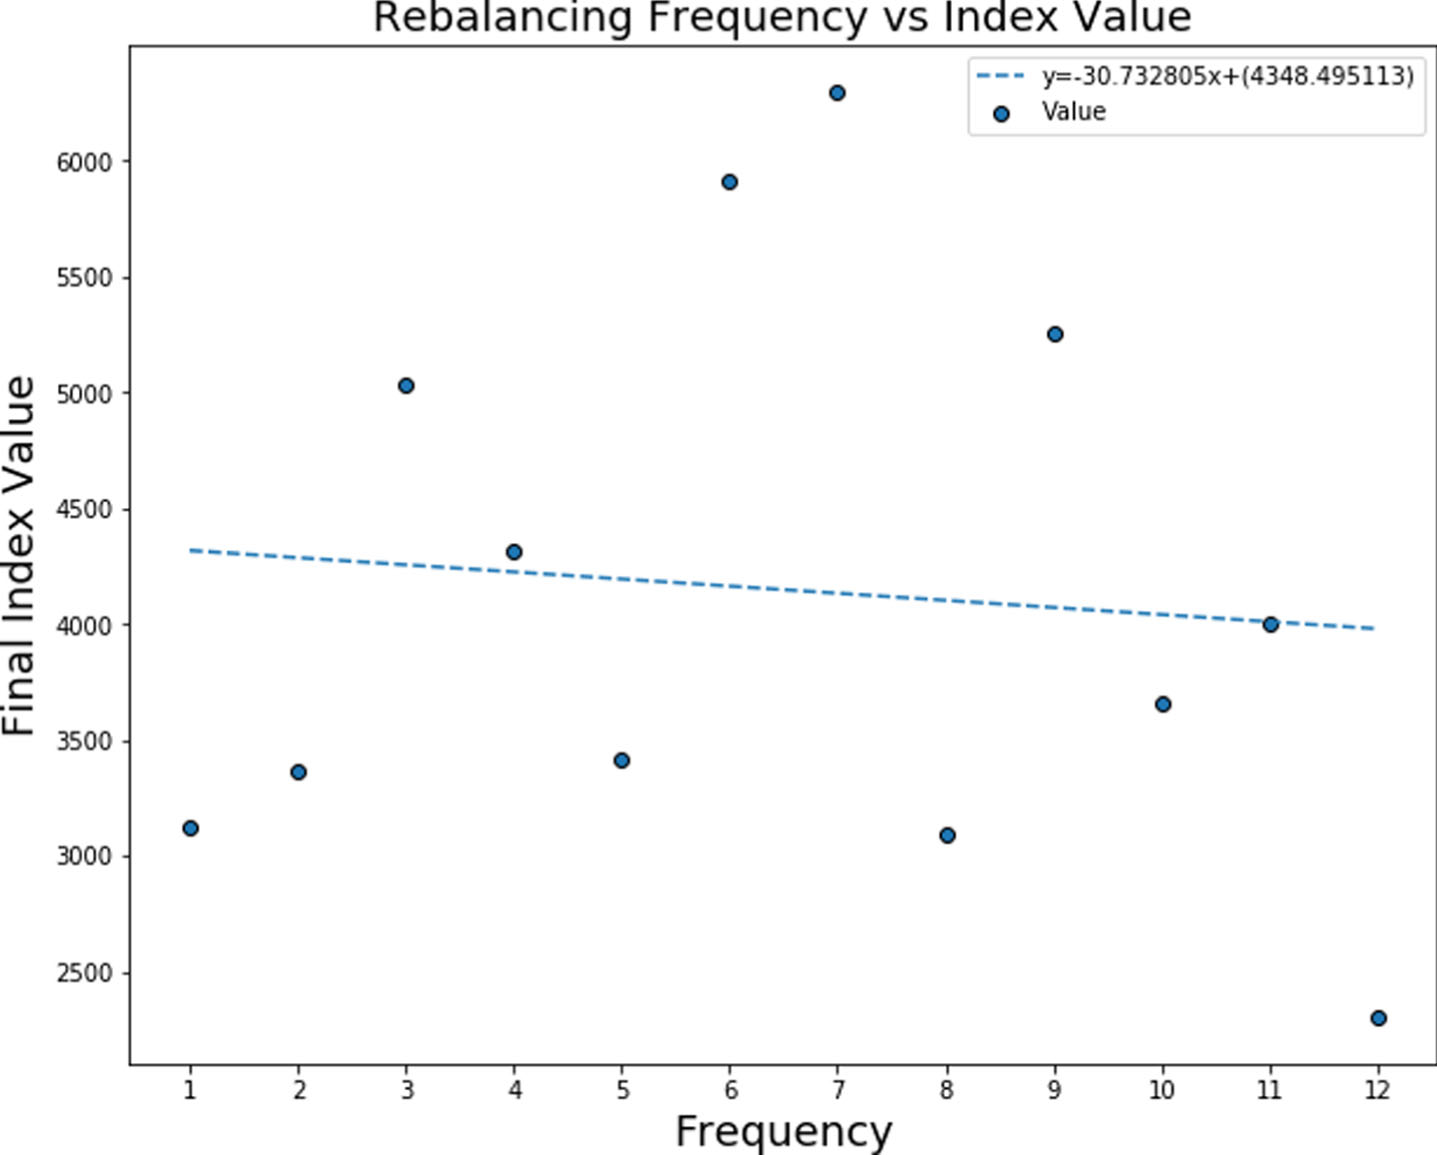
Final index value vs rebalance frequency (Source: Author’s Calculations).
Here, we list the results of various asset pricing tests performed to explain the excess returns produced by our lagged 6 months compounded returns strategy which has shown high risk adjusted returns with lowest drawdown.
Based on the above results from Table 6, we find that CAPM does a sufficiently good job in explaining the variation in excess returns for our chosen momentum indicator with coefficient of determination ranging from 60.1% to 82.3% for the deciles and the quintiles as well. All the factor loadings of the market risk premium variable is statistically significant at 1% for all the deciles and quintiles portfolios. However, the corner portfolios D10 and Q5 particularly have alpha i.e. intercept coefficient significant implying that CAPM model does not explain momentum for this portfolio. Results motivate us to seek further explanation of the observedresults.
Regression estimates for the CAPM model (Source: Authors Computations)
Regression estimates for the CAPM model (Source: Authors Computations)
(Note: The tables denote the OLS coefficients and their standard errors. *variable significant at 10% **for 5% and ***for 1%).
Based on the regression results from Table 7, one can conclude that explanatory power of the model has increased due to addition of 2 independent variables- SMB and HML as the coefficient of determination for all the deciles/quintiles have increased. For all the deciles/quintiles, we observe that together with the coefficient of market risk premium (β), the coefficient of HML (δ) is also statistically significant (at 10% level of significance) and positive indicating the exposure of momentum portfolios to high book/market value (low P/B) stocks, especially for lower-ranked portfolios. The reason for the positive exposure to the high book/ market stocks could be because value stocks (high book/ market value) are perceived to be risky stocks and hence are undervalued. Their perceived riskiness leading to subsequent undervaluation might be the reason for lower observed momentum in prices. Though, we find that the intercept for the regression for corner portfolio Q5 is still statistically significant implying FF3F model does not explain momentum effect for this portfolio and we need to seek other extended factor models or behavioural explanations to explain this.
Regression estimates for the FF3F model (Source: Authors Computations)
(Note: The tables denote the OLS coefficients and their standard errors. *variable significant at 10% **for 5% and ***for 1%).
As the landscape of investment management has changed over time with the development of smart beta or factor indices, it is utmost important for the portfolio managers to understand how these factors influence the risk-return trade-off of their investments in the financial markets. More importantly, the evolution of smart beta strategies has challenged the philosophy of active fund management to justify the higher fee structure as these strategies offer a potential low-cost solution to superior risk-adjusted-performance. The most powerful of these factors has been the momentum factor delivering far superior returns than all other factors. Hence, this study strives to investigate if the long only momentum factor strategy can be applied in the Indian equity markets to generate superior risk-adjusted returns. To develop the optimal momentum indicator, we backtest the various momentum indicators across different time frames to select the one that generates the highest risk-adjusted performance across the time frames using the S&P BSE-100 as a benchmark. Based on these backtests, we conclude that lagged 6-Months’ compounded returns indicator with quarterly rebalancing can be used to generate the highest risk-adjusted-performance. We also test a related phenomenon known as Accelerated Momentum effect as documented by Ardila et. al. (2021) for Indian equity markets and find that accelerated momentum effect underperforms the traditional momentum strategy both on an absolute and risk- adjusted basis. The second part of the study is focussed on explaining the excess returns produced by the strategy using the various asset pricing tests. We test for standard asset pricing models- CAPM model and FF3F model. Results indicate that across all the backtests, the highest-ranked portfolio formed based on the momentum rankings performed significantly better than the lowest-ranked portfolio both on an absolute basis and risk-adjusted basis. Hence, we were able to demonstrate that momentum strategy can be successfully deployed in the Indian equity markets to achieve superior risk-adjusted returns.
Hence, we confirm that the momentum effect is pervasive in Indian equity markets, and it can be exploited using a long-only investment strategy by institutional investors to generate significant risk-adjusted returns. Currently, this study does not include transaction costs into consideration. This study can be further extended to include the transaction costs to make it more robust for industry implementation. The momentum strategies are found to be risky because of the tendency of momentum crashes due to actions by Central Banks and Governments, and impact of other macroeconomic variables. Hence, the sponsors of the momentum investment strategies must make required disclosures regarding the riskiness of these strategies. For academia, the empirical testing of the behavioural explanations to the momentum effect for the Indian equities remains a topic for further exploration.
Footnotes
Acknowledgments
The authors would like to thank the esteemed reviewer for their rich insights which have helped us to improve the quality of the manuscript. We wish to thank the journal editorial team for their quick and excellent handling of the manuscript. Any errors that remain are our sole responsibility.
Appendix
Smart Beta Investing is a hybrid approach to Investment Management that seeks to provide exposure to risk factors that explain additional sources of return (achieve α) in a pre-defined / rule-based methodology (Like passive approach) to generate different risk/return profile than the broad Market. More on Smart beta: 
Also called “Investment Factors”, “Dynamic Factors”:
For emerging markets, the sharpe ratio is slightly less for momentum compared to value (0.3933 vs 0.3990) but absolute returns were much higher (9.48% vs 8.57%)
https://www.business-standard.com/article/markets/indiabreaks-into-world-s-top-five-club-in-terms-of-market-capitalisation-1220312000041.html#::text=India’s%20equity%20market%20has%20broken,and%20Canada%20(%243.18%20trillion)
Handbook of Statistics: Security and Exchange Board of India (SEBI).
These strategy form part of the momentum style factor strategies of the broader Smart Beta Universe as previously introduced.
The Asian countries included Hong Kong, Indonesia, Japan, S. Korea, Malaysia, Singapore, Thailand and Taiwan
J refers to the number of months the strategy uses to select the stocks (1–4 Quarters) and K refers to the holding period (1–4 Quarters)
Momentum profit gererate due to over-confidence, self-attribution and confirmation biases (refer Daniel et al. (1998)); under-reaction and over-reaction (refer Barberis et al. (1998)); herding (refer Hoitash & Krishnan (2008); Demirer et al. (2015)). It could also perhaps be accounted for by assuming efficient markets with rational investors in the presence of information noise (refer Crombez (2001)).
The share prices have been adjusted for capitalisation changes such as bonus, rights and stock splits to make the price series comparative over time. closing price for all the historical index constituents to reflect the changes due to dividends and corporate action events on stocks
Calculations do not include transaction costs into consideration, this is a matter of further research
Portfolio rebalancing decision involves a trade-off between optimal asset allocation and trading costs. There is no optimal frequency or threshold for rebalancing (More Details: https://www.vanguard.com/
As in India we follow the financial year convention of April-March, the 3-month gap is maintained as the financial results for a particular financial year take time to be released and incorporated.