



Abstract
In the present research, we found that different preprocessing options and parameterizations of classification and regression trees alter their model fit and have a direct effect on their applicability for end-users. We found that, in terms of applicability, classification trees react different to pruning than regression trees. Indeed, in case of high pruning levels, classification focus on the extreme values of the response variable, whereas regression tree are more likely to predict the intermediate values. Furthermore, when applying cross-validation with a high number of folds, modellers are likely to find one model that outperforms the other models in terms of reliability. Models were assessed based on the determination coefficient, the percentage of Correctly Classified Instances and the Cohen’s Kappa statistic for each parameterization. We found positive correlations (
Introduction
Models have been increasingly used in ecology as an instrument to understand the properties of ecosystems [30]. Ecological models are representations of the real ecosystem [44] and can characterize ecosystems’ responses to changing environmental conditions. As they can help to manage and preserve natural resources for future generations, ecological models have been often used in decision making [19,33,37,42]. For example, classification and regression trees [6] have been successfully implemented to quantify species-environment relations [10,13,18], to predict species occurrences [28,45,46], to predict dispersal of exotic species [1,4], to mark out protected areas [14,48], to determine ecological quality [12,31] or to produce habitat maps [40]. Classification and regression trees, are black-box models that quantitatively describe predictor-response relations. They explain variations in a response variable by splitting predictor variables at certain thresholds [10]. The trees consist of a transparent set of knowledge rules, which are deduced directly from the data, i.e. no expert knowledge is involved [10,35]. This implies that the rules found mainly depend on the quality of the information contained within the data [15]. However, ecological field data are often incomplete (missing values), noisy (containing errors or outliers) or have a skewed distribution [19]. As such, although it may result in loss of information [21], data preprocessing is an essential part of the statistical analysis when interpreting ecological field data by means of classification and regression trees [27,50].
Different parameterizations of the same modelling technique may produce considerably different outcomes [2], which on his turn has consequences for the applicability of the models for the end-users. Classification trees can be large and difficult to interpret [7], but little research has been undertaken to increase their comprehensibility for end-users. Although it has already been suggested by Araujo and Guisan [2] and Goethals et al. [26], only few publications are available in literature [17,32,45] that use multiple implementations of the same technique to assess and compare model predictions and performances. Indeed, classification and regression trees are often induced via a trial-and-error approach, rules of thumb or the software’s default settings. The parameterization of the algorithm used to develop the trees, such as the selection of the number of cross-validations, the degree of pruning and the minimum number of observations per leaf is often done extemporaneously. For example, 10-fold cross-validation has become the standard [49], but it has been already shown that the optimal number of folds depends on the size of the dataset and the aim of the modelling process [38]. Moreover, the selection of the final model is often driven by the best model fit and highest statistical reliability [3]. However, maximizing statistical indicators does not always result in the most optimal model in terms of applicability by end-users [19,34]. For example, Osei-Bryson [39] stated that when only assessing the statistical reliability, a decision tree with an accuracy rate of 0.959 and 29 leaves would be selected over a decision tree with a rate of 0.958 and 5 leaves. Therefore, apart from the statistical reliability, also the comprehensibility and applicability of the decision trees merit attention in the assessment of the end-product [17,47]. To date, the interplay between model parameterization, model fit and applicability for end-users remains understudied [17,39].
A better understanding is needed of why and when different parameterizations of the same modelling technique provide different results [2]. In the present research we aim: (1) to study the effect of model parameterization on the model fit of classification and regression trees; and (2) to illustrate consequences of the model parameterization on the applicability of the models for end-users. To address these research questions, we assessed the effect of 335 unique model parameterization on the model fit and on their applicability for end-users. The classification and regression trees were based on 863 field samples in the freshwater environment and aimed to relate the ecological water quality (assessed based on the macroinvertebrate community) with the physical-chemical water quality.
Summary of the original (A) and stratified (B) dataset showing the first quartile, median, mean and third quartile value based on 863 (A) and 240 (B) samples for the Ecological Quality ratio (EQR), maximum Biological Oxygen Demand (BODmax), maximum Chemical Oxygen Demand (CODmax), median Kjeldahl nitrogen concentration (KjNmed), median nitrate concentration (NO3, med), minimum oxygen concentration (DOmin), average orthophosphate concentration (oPO4, avg) and average total phosphorous concentration (Ptavg)
Summary of the original (A) and stratified (B) dataset showing the first quartile, median, mean and third quartile value based on 863 (A) and 240 (B) samples for the Ecological Quality ratio (EQR), maximum Biological Oxygen Demand (BODmax), maximum Chemical Oxygen Demand (CODmax), median Kjeldahl nitrogen concentration (KjNmed), median nitrate concentration (NO3, med), minimum oxygen concentration (DOmin), average orthophosphate concentration (oPO4, avg) and average total phosphorous concentration (Ptavg)
The methodology of the present research is illustrated in a conceptual diagram (Fig. S1). This scheme consists of general methodological guidelines for environmental data mining. Multiple conceptual schemes have been introduced earlier [23,29], but in the present research focus is on the linkage between the data preprocessing, model parameterization, and the applicability of the models for end-users.
Data
The dataset was compiled in the scope of the Water Framework Directive (WFD), which is one of the most important guidelines for European river managers. The main objective of the WFD is to reach a good ecological status of the European water courses by 2027 [16]. Currently, only a limited number of Flemish surface waters comply with this request. Therefore, the Flemish government, which is responsible for the environmental management in the northern part of Belgium, planned several rehabilitation projects to restore the ecological river quality. However, the impact of these restoration actions on the ecological status of the watercourses could not be quantified yet. Therefore, classification and regression trees were constructed to gain insight into the relations between chemical and ecological surface water conditions and, in the end, to help river manager decide where to allocate the limited resources for ecological restoration. Overall, the aim of the classification and regression trees is to characterize the ecological water quality (assessed based on the macroinvertebrate community) using the surrounding abiotic conditions, such as for example, physical-chemical variables.
The dataset contained 863 samples comprising of the ecological water quality based on the macroinvertebrate community and the physical-chemical conditions of Flemish water courses. These data cover various points (sampling locations in large streams, small rivers and large rivers) and several years (from 1989 to 2009) (Table 1). The physical-chemical data were available in the form of statistical derivatives and were calculated over one year. The physical-chemical data available were, in line with Schneiders et al. [43] and Everaert et al. [20]; maximum Biological Oxygen Demand (BODmax, mg O2/L), maximum Chemical Oxygen Demand (CODmax, mg O2/L), median Kjeldahl nitrogen concentration (KjNmed, mg N/L), median nitrate concentration (NO3, med, mg N/L), minimum dissolved oxygen concentration (DOmin, mg O2/L), average orthophosphate concentration (oPO4, avg, mg P/L) and average total phosphorous concentration (Ptavg, mg P/L). All substances were analysed in accordance to the standards of ISO 17025. The ecological status of the surface waters is assessed based on the macroinvertebrate community as discussed by Gabriels et al. [25] and is quantified using an Ecological Quality Ratio (EQR), ranging from 0 to 1. In the context of the WFD, and for transparency towards decision makers, these continuous scores are converted to five ecological quality classes (“bad, “poor”, “moderate”, “good” and “high”). In the present research, the quality classes ‘good’ and ‘high’ were combined in one class, named “good_high”. In the data set all variables were quantified, i.e. there were no missing values. A summary of the data set can be found in Table 1. The Pearson correlation coefficients were calculated to explore the relations between physical-chemical characteristics and the ecological quality (Table 2).
Correlation matrix of the original dataset showing the Pearson correlation between the Ecological Quality ratio (EQR), maximum Biological Oxygen Demand (BODmax), maximum Chemical Oxygen Demand (CODmax), median Kjeldahl nitrogen concentration (KjNmed), median nitrate concentration (NO3, med), minimum oxygen concentration (DOmin), average orthophosphate concentration (oPO4, avg) and average total phosphorous concentration (Ptavg)
Correlation matrix of the original dataset showing the Pearson correlation between the Ecological Quality ratio (EQR), maximum Biological Oxygen Demand (BODmax), maximum Chemical Oxygen Demand (CODmax), median Kjeldahl nitrogen concentration (KjNmed), median nitrate concentration (NO3, med), minimum oxygen concentration (DOmin), average orthophosphate concentration (oPO4, avg) and average total phosphorous concentration (Ptavg)
We compiled two sets of data consisting of physical-chemical information and the ecological status of the watercourses. One set of data was identical to the description above, thus consisted of all 863 samples and had a skewed distribution of the response variable (Table 1). The second set of data was sub-sampled from the first set, and each class of the response variable (i.e. “bad”, “poor”, “moderate”, “good_high”) was presented in the same proportion. To do so, we identified the number of cases in the least represented ecological water quality class and selected the same amount of cases randomly in the other quality classes. By doing so, the skewed distribution of the response variable was removed and all quality classes (i.e. “bad”, “poor”, “moderate”, “good_high”) were equally represented in the second set of data. The second set of data, i.e. the stratified dataset, contained 240 (= 4 classes × 60 samples/class) out of 863 samples (Table 1). Both sets of data were used to develop classification and regression trees aiming to characterize the ecological water quality based on the physical-chemical conditions (see further).
Model development
The aim of the classification and regression trees was to quantify the ecological status based on the physical-chemical conditions and to assess the importance of the model parameterization on the applicability of the resulting models for end-users. The basic idea of classification and regression trees (CART) is very simple, i.e. predicting a response variable (e.g. Y) from predictor variables (e.g.
Classification and regression trees were produced for 335 unique parameterizations of the number of cross-validations (
In the present research, the
For each of the 335 unique parameterizations, we stored the mean, standard deviation and maximum value of the
Simulations
A selection of the 335 models that were developed in the previous section were used to simulate future ecological water quality under different management scenarios. We selected those classification trees that were developed using 5-fold cross-validation (
Classification trees were developed for 335 unique model parameterizations. For each model parameterizations we quantified the model fit based on the determination coefficient (
), the correctly classified instances (CCI), the Kappa statistic (K). The number of nodes in the tree (depthtree) was a measure of the complexity of the tree. Models were constructed for both the original dataset (863 samples) and the stratified dataset (240 samples)
Classification trees were developed for 335 unique model parameterizations. For each model parameterizations we quantified the model fit based on the determination coefficient (
We compared whether regression trees do react similarly (in terms of model fit and applicability) to changing model parameterization as classification trees. To do so, the 335 parameterizations identical to those descripted earlier were used to build regression trees (cfr. Model development). The simulations, used to assess the impact of the model parameterization on the applicability were performed in the same way as for classification trees (cfr. Simulations). As our main aim was to verify whether regression trees react in the same way as classification trees in terms of applicability, focus in the results and discussion will be on the impact of the model parameterization on the model applicability. The pairplots between the model parameterizations and the model fit are shown in supportive information.
Results and discussion
Effect of stratification
Stratification results in decreasing quartile values of the environmental variables which are negatively correlated with the ecological water quality (i.e. BODmax, CODmax, KjNmed, etc.). However for the DOmin that is positively related with the ecological water quality, the quartile values increase (Table 1). In terms of model fit, as quantified based on the
Effect of model parameterization on model fit
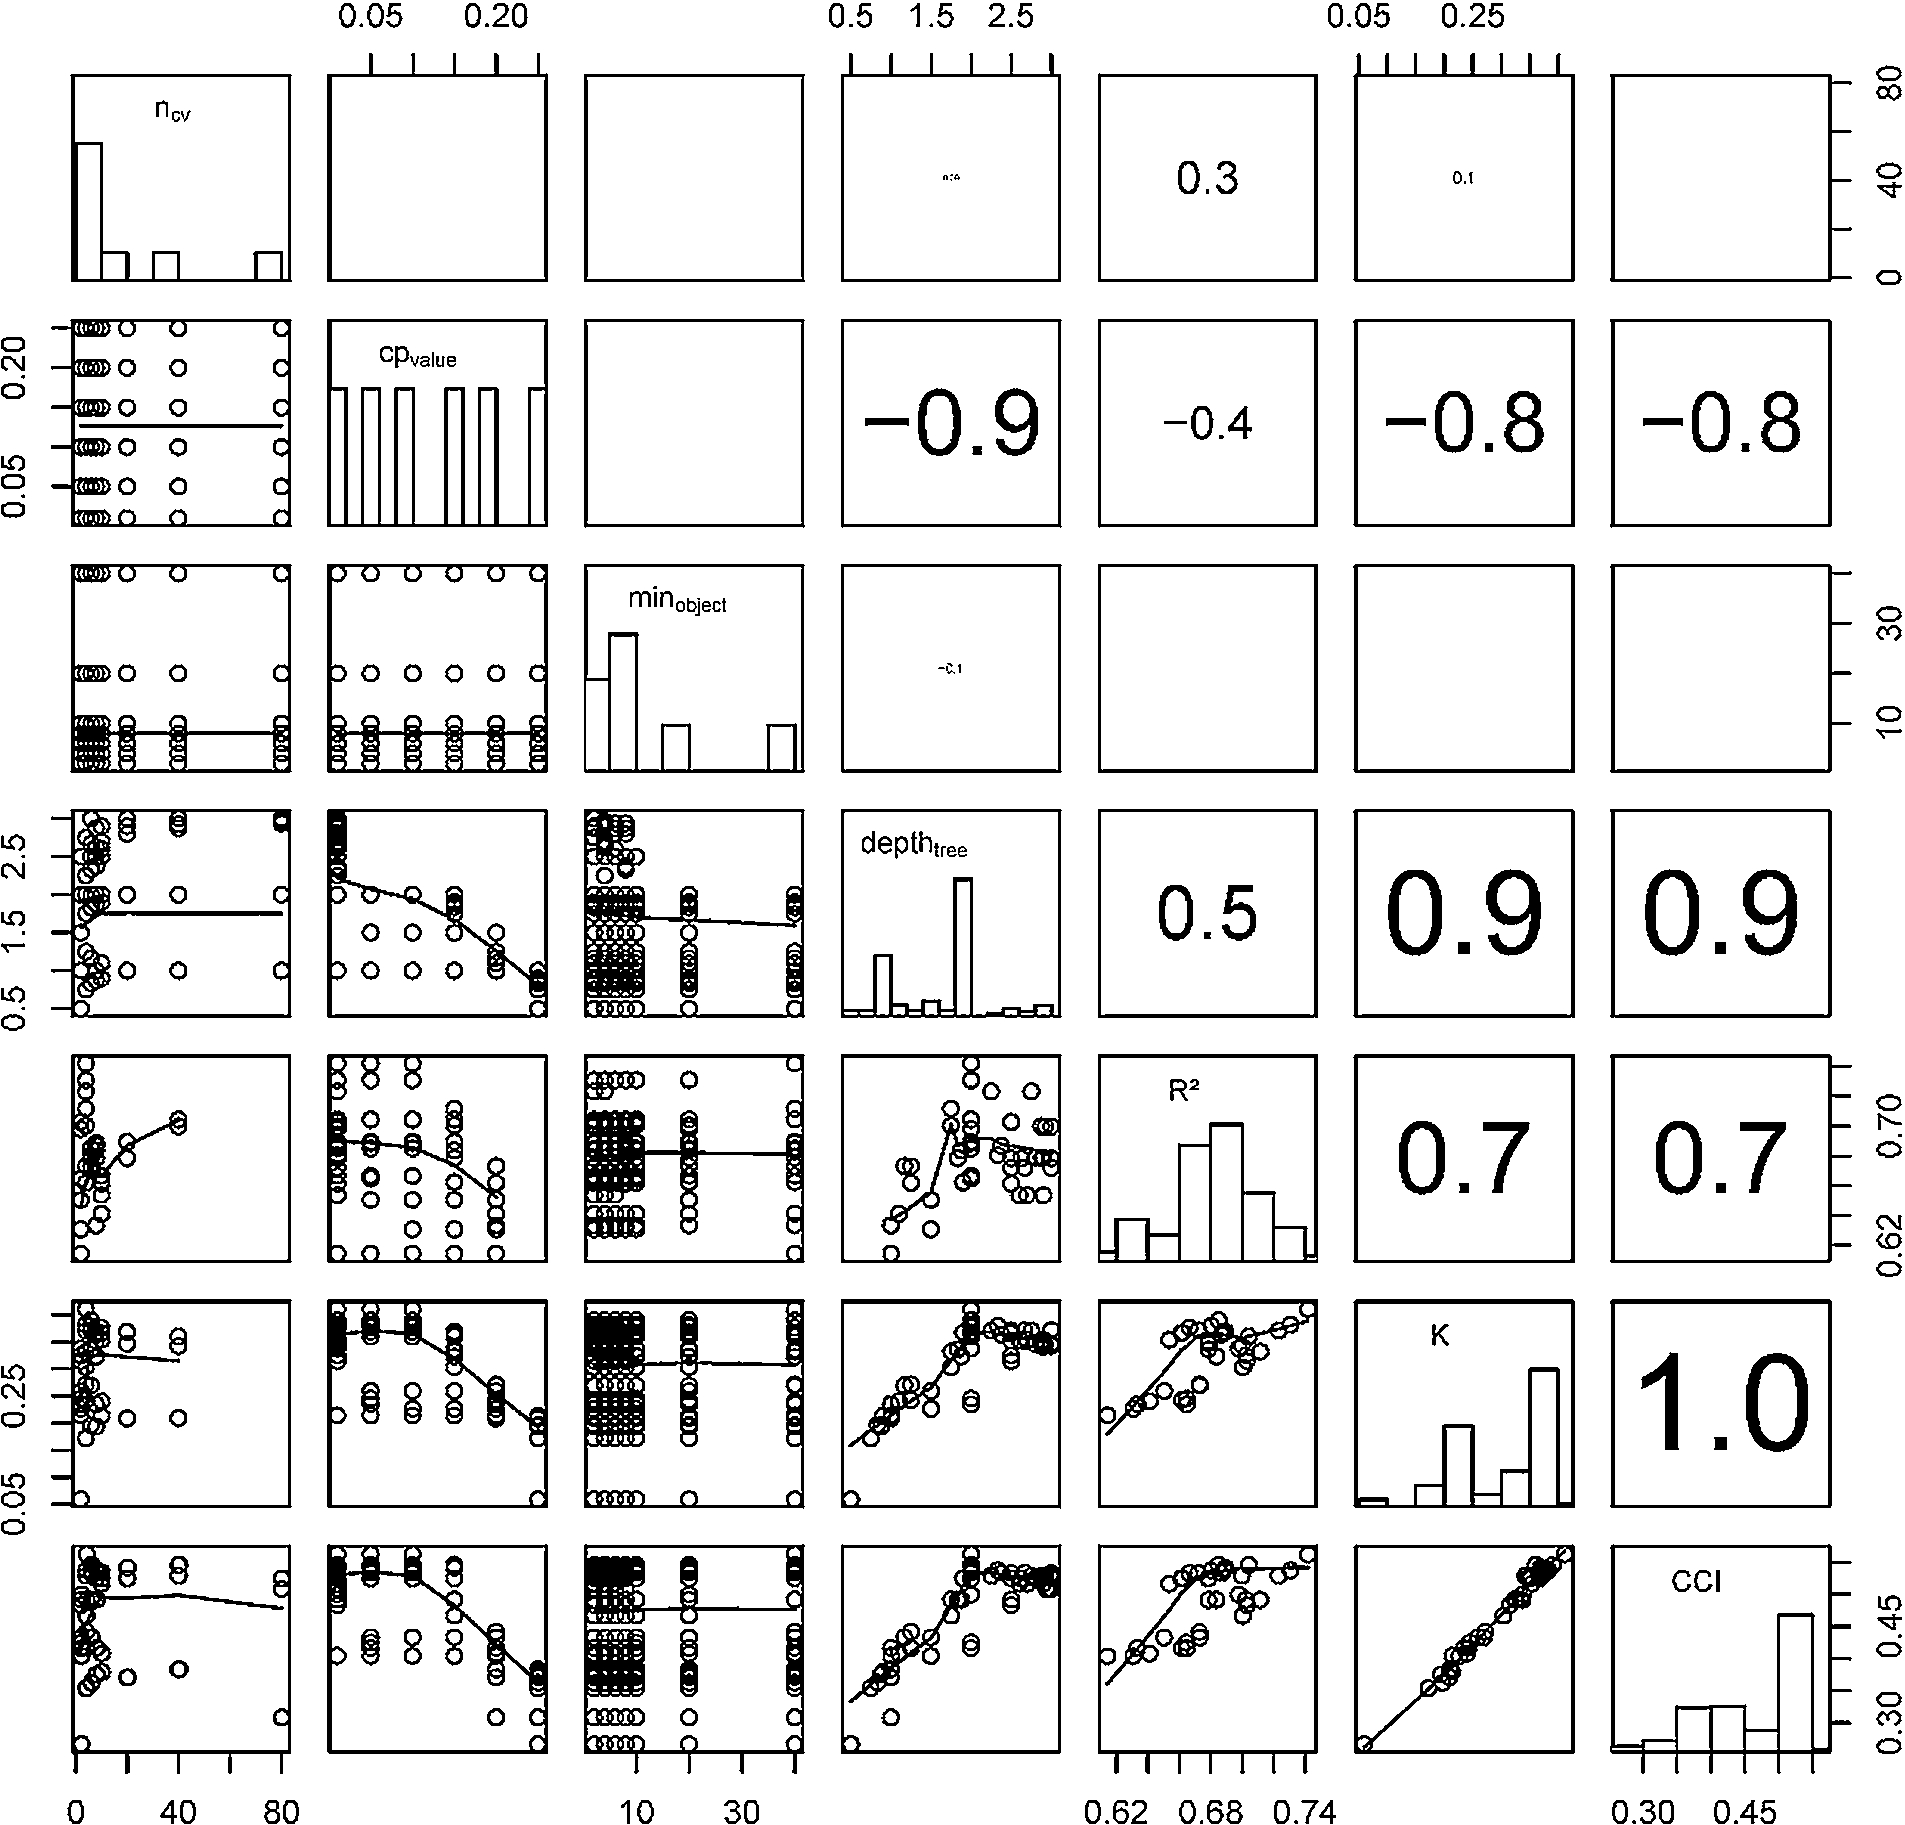
Pairplot showing univariate interactions between the model development settings (

Pairplot showing univariate interactions between the model development settings (

Pairplot showing univariate interactions between the model development settings (

Visualisation of the predicted ecological water quality in Flanders in 2027 based on classification trees. Four ecological water quality classes are shown, being bad (B, red), poor (P, orange), moderate (M, yellow) and good_high (GH, gradient green to blue). Classification trees were developed with 5-fold cross-validation and three complexity parameters (
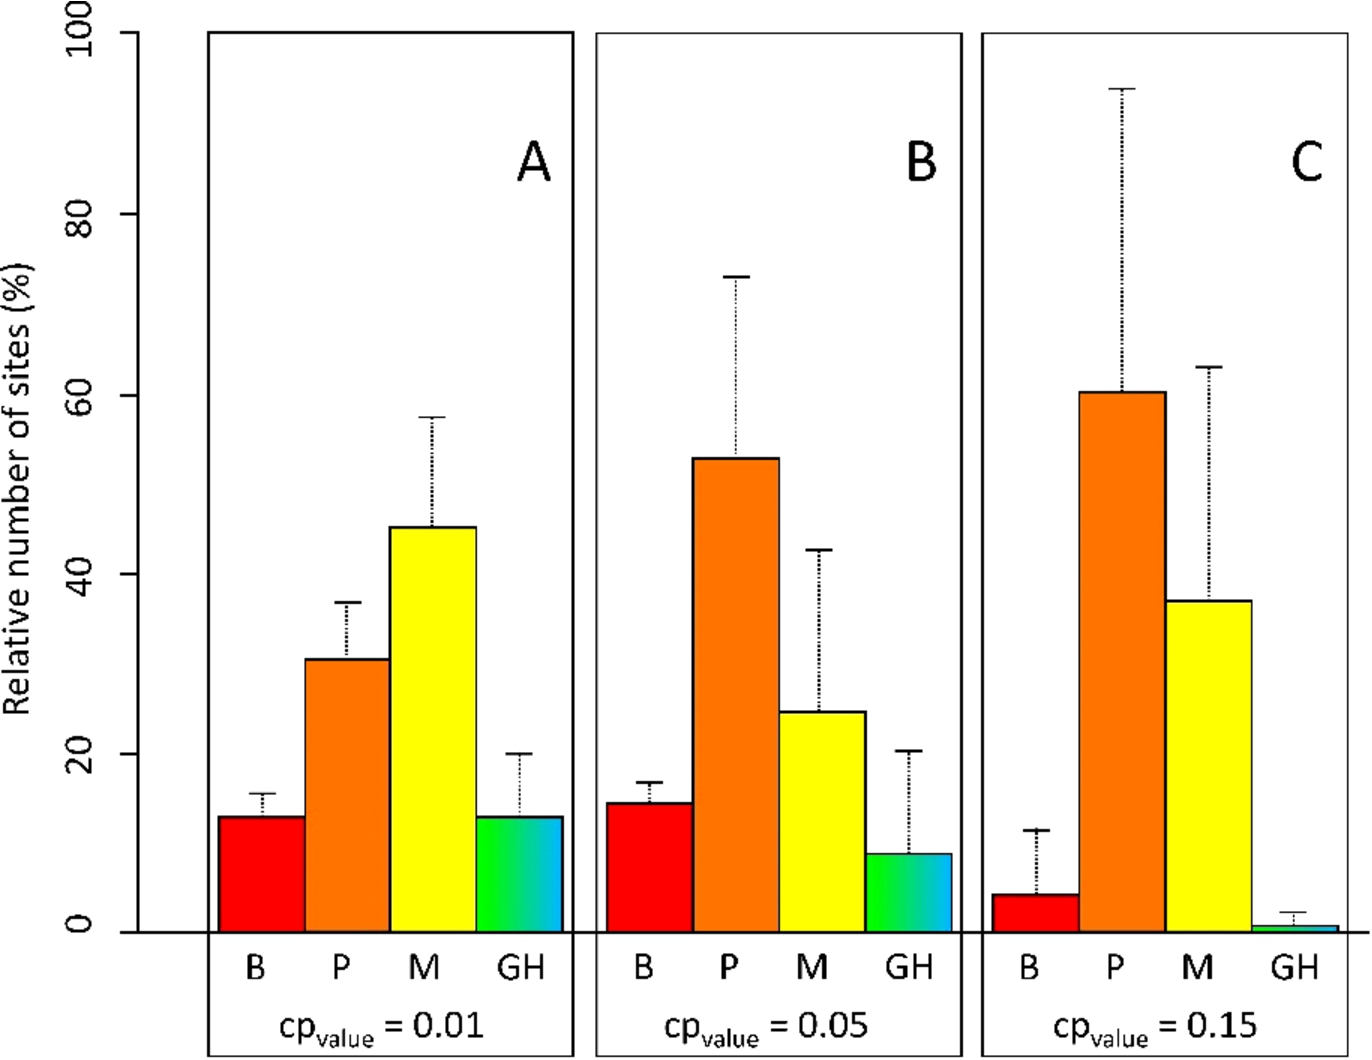
Visualisation of the predicted ecological water quality in Flanders in 2027 based on regression trees. Four ecological water quality classes are shown, being bad (B, red), poor (P, orange), moderate (M, yellow) and good_high (GH, gradient green to blue). Regression trees were developed with 5-fold cross-validation and three complexity parameters (
Although low pruning levels (i.e. low
Previous paragraphs dealt with technical aspects of the modelling process. However, model evaluation involves more than comparing predictions with observations and calculating statistical performance criteria [17,34]. The link between the derived models and their applicability is often forgotten. We found that classification trees based on the stratified dataset and at low pruning levels (i.e. with few knowledge rules deleted) are most complex (Fig. 1), but succeed to predict all four water quality classes (Fig. 4(A)). At high pruning levels (i.e. several knowledge rules are deleted) the classification trees tend to predict extreme values (Fig. 4(C)). Indeed, when
Although it has already been suggested by Araujo and Guisan [2] and Goethals et al. [26], it rarely happens that researchers use multiple implementations of the same technique to assess and compare model predictions and performances. One example from earlier years is the research of Kozak and Kozak [32] in which discrete steps are used to put aside observations for model validation. Recently, Tirelli and Pessani [45] varied the complexity parameter transparently from 0.15 to 0.25 and statistically compared the performance of unpruned and pruned models. However, influence of other model development settings was not discussed in detail.
In the present study, models that could not predict a good ecological water quality were, unesteemed their predictive performance, not applicable by end-users (cfr. Data). In this context, data stratification was very helpful to ensure that our model could predict the whole biological quality range. Without this technique it would have been difficult to predict the shift from the moderate to the good biological water quality and consequently to help stakeholders to decide which was the most efficient restoration plan (cfr. Data). These findings support the conclusions formulated by Larocque et al. [34] stating that other quality aspects than statistical reliability are equally important in the model selection. Although a trial-and error approach seems more efficient in the short run, selecting a model that per accident performs well, is less transparent than comparing a list of models in an automated, consistent and transparent way. Stability cannot be guaranteed if a trial-and error approach is applied. So, different model parameterizations may improve the understanding of the sensitivity of models and allow more robust models comparisons [2]. Overall, we found that model parameterization does not only alter the model fit, but also the conclusions drawn from and the applicability of environmental models for end-users.
The effect of stratification (Table S1) and the effect of the model parameterizations on the model fit (Figs S2–S4) is similar for regression trees as for classification trees. The main difference between classification trees and regression trees relates to the consequences of the model parameterizations on the applicability of the regression trees (Fig. 5(A)–(C)). In case of low pruning (
Conclusion
The main objective of this study was to address the knowledge gap regarding the relation between model parameterization, model fit and applicability for end-users. We show that data stratification, number of cross-validation folds and pruning may impact the classification trees’ reliabilities and, more importantly, alter the applicability of, and the conclusions drawn from, environmental models. We found that three statistical criteria were positively correlated and that there is a non-linear trade- off between the pruning of the model and the model fit. Based on our findings environmental modellers should be stimulated to develop models in a systematic way and trained with well-defined parameter settings to guarantee reliable, stable and reproducible models. Our findings should be further tested for other datasets and scientific domains.
Footnotes
Acknowledgements
Gert Everaert is supported by a post-doctoral fellowship from the Special Research Fund of Ghent University (BOF15/PDO/061). Elina Bennetsen is supported by the Special Research Fund of Ghent University (B/09924/02).