
Abstract
We present the IBM Research Scenario Planning Advisor (SPA), a decision support system that allows users to generate diverse alternate scenarios of the future and enhance their ability to imagine the different possible outcomes, including unlikely but potentially impactful futures. Our system, takes as input the relevant information from news and social media, representing key risk drivers, as well as the domain knowledge and generates scenarios that explain the key risk drivers and describe the alternative futures. To this end, we provide a characterization of the problem, knowledge engineering methodology, and transformation to AI planning. Furthermore, we describe the computation of the scenarios, lessons learned, and the feedback received from the pilot deployment of the SPA system in IBM.
Introduction and motivation
Scenario planning is a widely accepted technique by which organizations develop their long-term plans [14]. Scenario planning for risk management puts an added emphasis on identifying the extreme yet possible risks and opportunities that are not usually considered in daily operations. Scenario planning involves analyzing the relationship between forces — such as social, technical, economic, environmental, and political trends — in order to explain the current situation and to provide insights about the future. A major benefit to scenario planning is that it helps businesses or policy-makers to learn about possible alternative futures and to anticipate them [9]. We use AI planning, informed by expert domain knowledge, because some scenarios have never yet occurred and thus cannot be projected by probabilistic means. And we generate many different scenarios, exploring a variety of possible futures; because we want to be prepared for both expected and surprising futures.
Risk management is a set of principles that focus on the outcome for risk-taking [20]. A variety of (manual) methods and standards for risk management have been developed [2]. Our approach in addressing scenario planning for risk management is different from previous work in that we reason about emerging risks based on observations from the news and social media trends, and produce scenarios that both describe the current situation and project the future possible effects of these observations. Our objective is to compute multiple alternate scenarios, informing the decision-makers of the breadth of possibilities that may need consideration. This is different from a narrow focus on predicting the most likely outcome. Furthermore, each scenario we produce highlights the potential leading indicators, the set of facts that are likely to lead to a scenario, the scenario and emerging risk, the combined set of consequences or effects in that scenario, in addition to the business implications, a subset of potential effects of that scenario that the users care about and are relevant to the enterprise. For example, prior to the Brexit referendum in 2016, an international company operating in the United Kingdom could consider alternative future scenarios for changes in trade and employment treaties assuming the majority voted to leave the European Union, identifying the implications for the company’s finances and its ability to hire, enabling the company to act immediately to minimize the negative implications.
The main functions of Scenario Planning Advisor (SPA) are: (1) discovering active risk drivers by aggregating relevant news from the Web and social media, and generating lists of candidate observations corresponding to the detected risk drivers;1
Demo video is here:
Demo video is here:
In this section, we briefly review the necessary background on AI planning and Plan Recognition. We consider planning tasks
The semantics of
A Plan Recognition (PR) problem over a domain theory is a tuple
The solution to the PR problem is a pair of probability distributions. The first is the probability of plans given the observations,
In previous work, AI planning is used to approximate these probabilities. In [15],
Scenario Planning Advisor (SPA)
The architecture for our system, Scenario Planning Advisor (SPA), is shown in Fig. 1. There are three major components. The planning engine, shown under the Scenario Generation and Presentation component, takes as input the output of the other two components: the News Aggregation and the Domain Knowledge. The News Aggregation component deals with analyzing the raw data coming from the news and social media feeds. The Topic Model, provided by the domain expert, includes the list of important people, organizations, and keywords. The result of the News Aggregation component is a set of relevant key risk drivers or observations, a subset of which can be selected by the business user and is fed into the Scenario Generation and Presentation component.
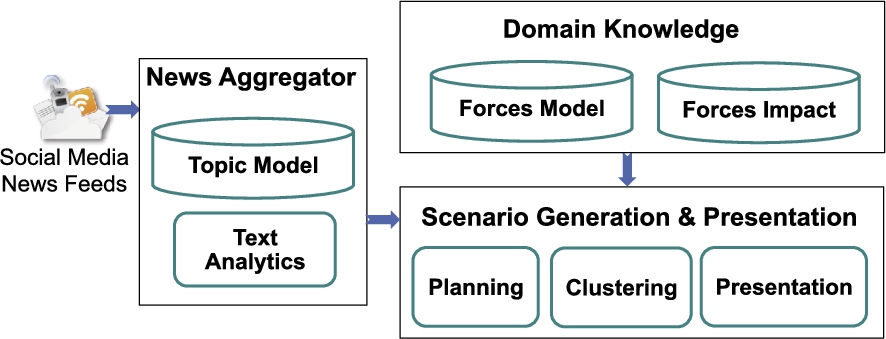
The SPA system architecture.
The Domain Knowledge component captures the necessary domain knowledge in two forms, Forces Model and Forces Impact. The Forces Model is a description of the causes and consequences for a certain force, such as social, technical, economic, environmental, and political trends, and is provided by a domain expert who have little or no AI planning background. Forces Model are captured by a set of Mind Maps (
Hence, we define the scenario planning problem for enterprise risk management as a tuple
SPA needs to be constantly aware of an evolving world, filtered and aggregated based on users’ interest profiles. For that, SPA continuously monitors multiple real-world sources (e.g., news channels from RSS and Atom feeds, social media posts) in multiple languages. To this end, several text analytics are implemented to find the information relevant for a particular domain in the vast amount of information available to crawl. To further refine and filter the information, SPA uses the structured semantic knowledge available in Wikidata using Wikidata Query Service to find important people, organization, and relevant sources [18] and stores these in the Topic Model. Analysts then review the generated results and select key risk drivers that are the most relevant and important for them. Note that SPA can deal with unreliable observations (i.e., noisy, inconsistent, missing observations) as it exploits previous work on plan recognition as planning [15]. Hence, SPA is not forced to explain all the selected key risk drivers but is encouraged to explain as many observations as possible.

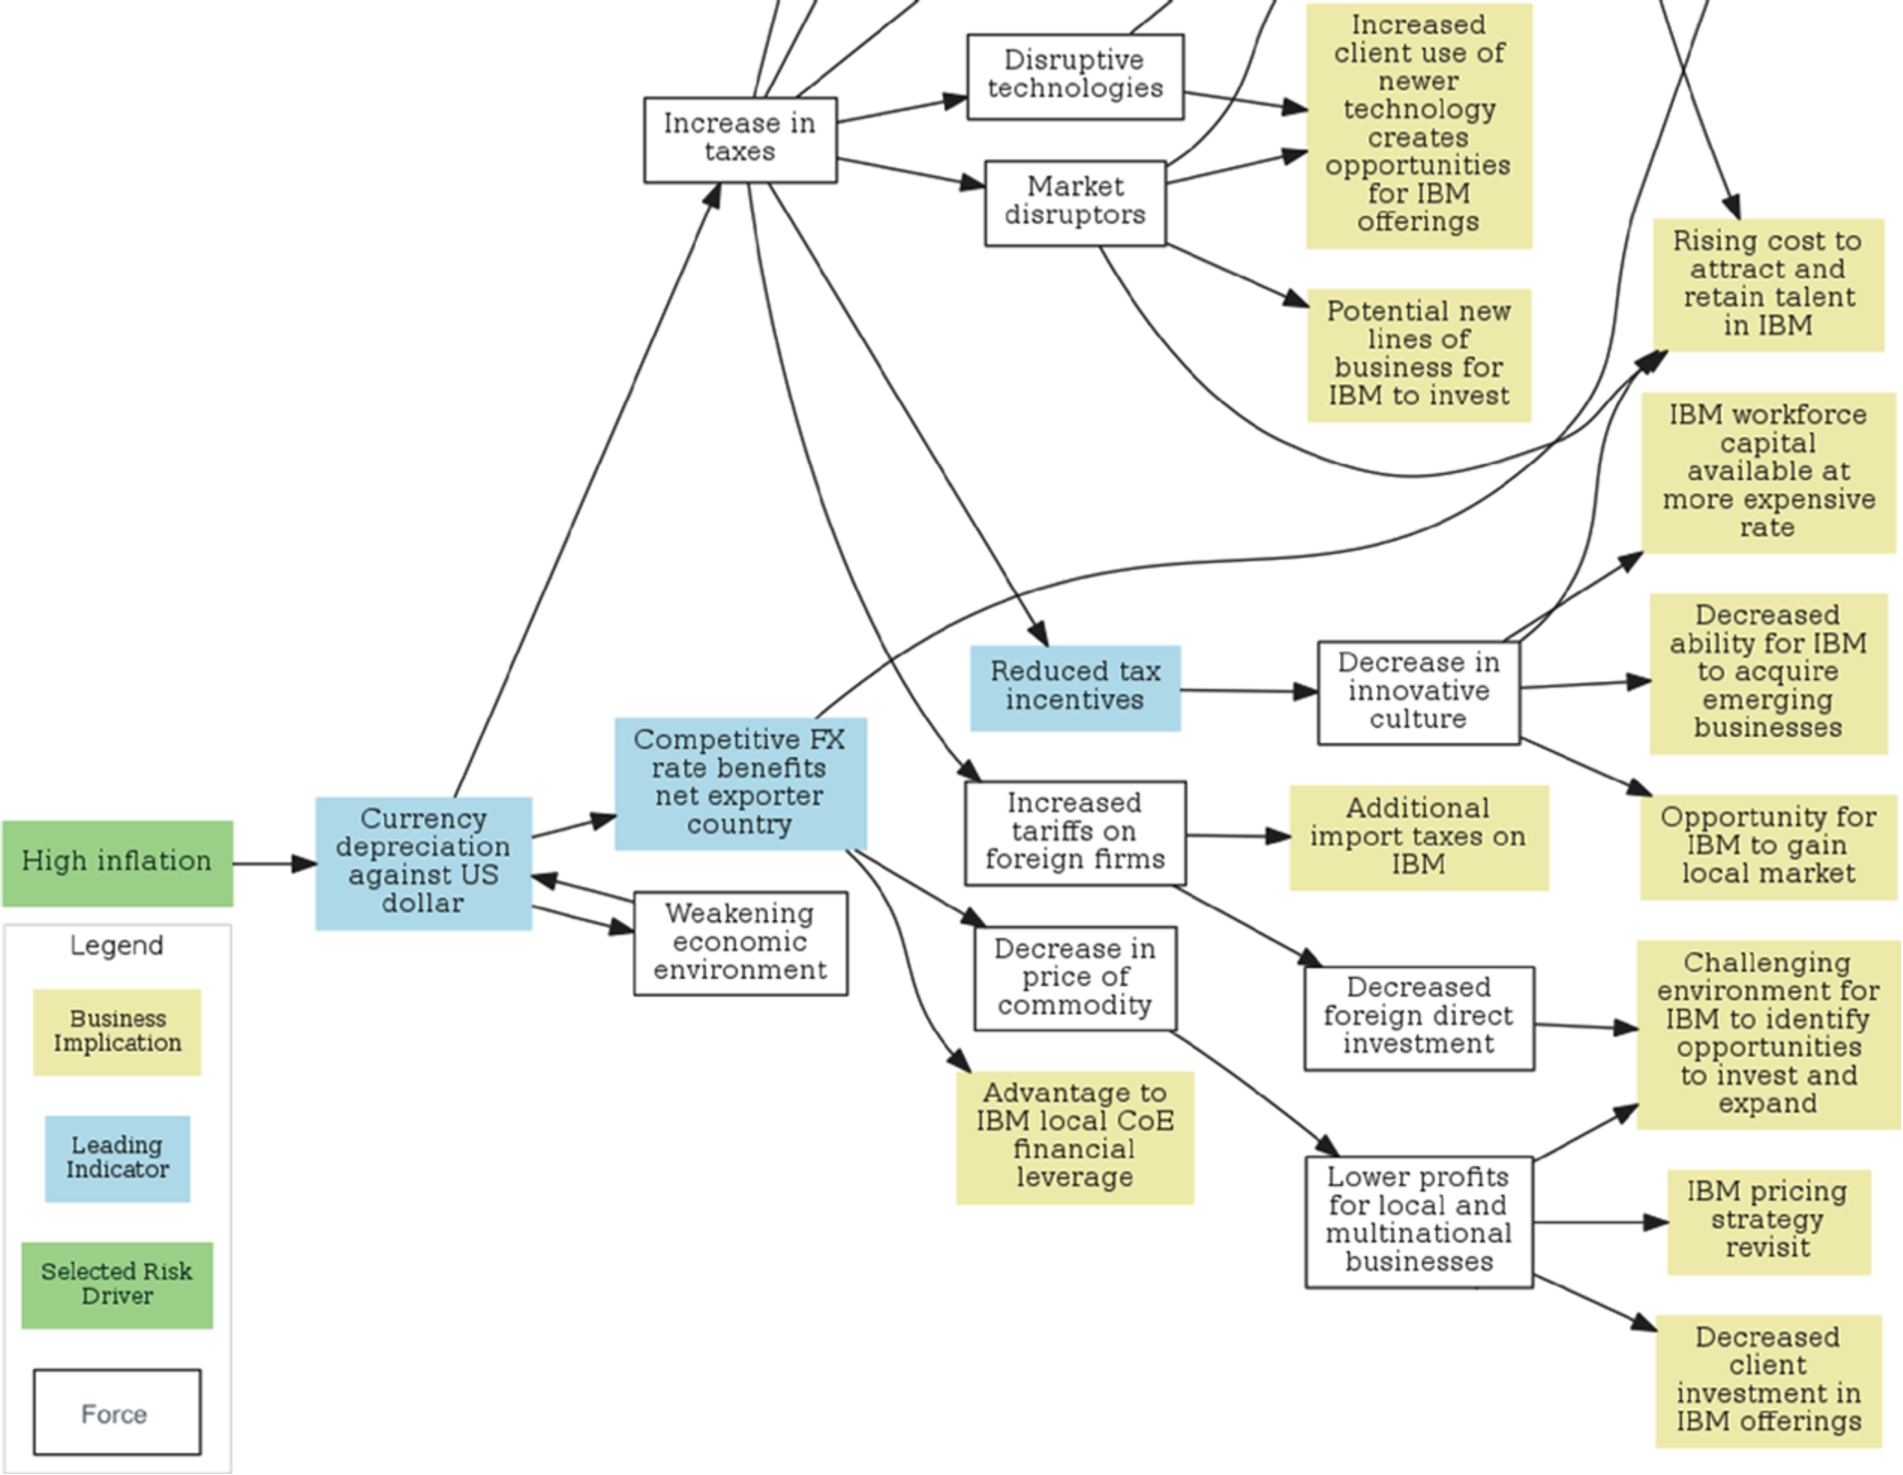
Part of the Mind Maps for (a) currency depreciation against US dollar (b) decrease in price of commodity. Edges indicate the direction of the causes and effects. Concepts that have the name of the company in them (e.g., IBM) are the business implications.
The Mind Maps (i.e., the Forces Model) and the customization components (i.e., Forces Impact) encode knowledge about risk drivers and business implications elicited from the domain experts and the local country experts correspondingly. While the reasoning engine in SPA supports a rich representation of risk drivers as actions in Planning Domain Description Language (PDDL) [8], the knowledge representation used by domain experts is drastically simplified, to prevent conflicts and reduce overheads in knowledge elicitation and maintenance. The domain experts use Mind Maps created in FreeMind (freemind.sourceforge.net/wiki/), a graphical tool that encodes concepts and relations, to capture directed graphs of risk drivers and business implications, with edges having hidden semantics of pairwise cause and effect.
Forces model as structured Mind Map
We represent the Forces Model as a set of Mind Maps. Two example Mind Maps are shown in Fig. 2. The main forces in these Mind Maps are the “currency depreciation against US dollar” and the “decrease in price of commodity”. The forces with an edge going towards the main force, are the possible causes, and the forces with an outgoing edge from another force, are the possible consequences. The causes and effects can appear in chains, and cascade to other causes, and effects, with a leaf node of either a business implication, or another force, with its own separate Mind Map that describes it. For example, the leaf node “IBM workforce capital available at better rates” is an example of a business implication, and the leaf node “Decrease in price of commodity” is itself a main force described in the Mind Map in Fig. 2(b).
Next, we formally define Mind Maps. Let B and C be two disjoint sets, where B is a set of symbols of type business implications and C is a set of symbols of type force. We now define a set of structured Mind Maps.
A set of structured Mind Maps
Further, a consequence structure Θ is defined as a set of consequence sequences such that each consequence sequence takes one of the following forms:
Going back to our example in Fig. 2, causal structure defines the structure of the nodes and edges to the left of the main force, i.e., all nodes with an arrow to the main force (e.g., “High inflation”), and the consequence structure defines the structure of the nodes and edges to the right of a main force, i.e., nodes with an arrow from the main force and all subsequent nodes, (e.g., “IBM pricing strategy revisit”). Note that this definition is recursive.
We can now define the notion of a path in Mind Maps.
Given a set of structured Mind Maps,
Informally, a valid path through the set of Mind Maps starts from the causal structure, goes through at least one main force, and ends in a business implication symbol. Thus a valid path consists of at least three nodes. In Fig. 2, the path “Reduced demand for commodity”, “Decrease in price of commodity”, “Lower profits for local and multinational businesses”, “IBM pricing strategy revisit” is a valid path. So is the path “High inflation”, “Currency depreciation against US dollar”, “Competitive exchange rate benefits net exporter country”, “Decrease in price of commodity”, “Lower profits for local and multinational businesses”, “Decreased client investment in IBM offerings”. Note, Mind Maps can be connected through both cause and consequence sequences; that is, many main forces can appear on a valid path. Also, many valid paths exist for a given set of structured Mind Maps. The additional information provided by the Forces Impact allows us to rank these paths.
Additional information on the Mind Maps is encoded through the Forces Impact. The Forces Impact, describes potential likelihoods and impact of a cause (i.e., nodes with an edge going into the main force) or a consequence (e.g., nodes with an edge going from the main force and all other cascading nodes). Forces Impact also describes the level of importance of a main force.
One way to capture this information, and the approach we take, is to ask the domain experts a series of automatically generated questions based on the Mind Maps. For example, the system will ask the following question in order to understand which of the causes are more likely: “How likely are any of the following to lead to currency depreciation against US dollar.” The system will also ask the following question in order to understand which consequences are more likely and would have a higher impact: “Assuming currency depreciation against US dollar occurs, please evaluate the likelihood and impact of the following effects.” In addition, the system will ask the domain expert to specify the relative importance of the main forces in their particular situation (i.e., company). Importance, impact, and likelihood can take one of the values: low, medium, or high. This can be easily extended to any finite number of values.
More formally, given a set of Mind Maps
Given this additional information on the Mind Maps, we can define a ranking among valid paths. Informally, valid paths that go through Mind Maps with high importance value, causes and consequences with high impact and likelihood have a higher quality. In the next section, we describe how these values can be encoded with action costs such that a high-quality valid path would map to a low-cost plan.
Transformation to planning
Since the scenario planning problem, as mentioned in Section 3, is NP-hard, in this section we describe our solution using planning. Given a scenario planning problem, we define its corresponding plan recognition problem, which allows us to apply the previous work on plan-recognition-as-planning to generate many plans. In addition, we will describe our method of translating the domain knowledge into the planning task.
Given a scenario planning problem,
Given the corresponding plan recognition problem
Given a scenario planning problem,
Informally, scenarios group plans by a certain similarity criteria, e.g., sets of facts that are true in the end state. We further elaborate on that in Section 7. Note that a set of scenarios or a solution to the
Next, we will describe how to translate the set of Mind Maps
Given a set of Mind Maps F is a set of fluents that appear in A: (achieved), (bis c) for all (at c) for all (low (f-low c), (f-med c), (f-high c), for all A is the union of the following action sets:
Given a set of Mind Maps
(⇒) Given a valid path
(⇐) Given a plan π for the planning task Π, we construct a valid path for
The translation method described above could have different implementations. In particular, to determine the costs associated with the combined values for likelihood and impact, different methods can be used. For example, to combine likelihood and impact, one can consider a high value, if both the likelihood or impact are high, a medium value if either values are high, or both are medium, and a low value otherwise. The low/medium/high can also map to any numbers in the cost of the action. However, as long as their relative difference adheres to the three levels, where low maps to a higher cost and vice versa, the theorem holds.

Sample generated scenario.
We can directly represent the transformed planning task in a “lifted” planning language such as PDDL [8] where we would define one general and “lifted” set of actions in the domain file, defining problem files based on the given Mind Maps. As a generic grounding algorithm may take a substantial amount of time, we also experiment with creating directly a (partially) grounded planning task. To obtain such (partially) grounded planning task, we fully ground the “next” and “indicator” actions, alleviating the need for the static predicates (low
Screenshot of part of an explanation graph.
In the previous section we discussed a sound and complete translation of Forces Models and Forces Impact into a planning task. In this section, we discuss how to compute a solution to the plan recognition problem
To compute a set of scenarios (see Fig. 3 for an example of a scenario) we perform the following steps: (i) follow previous work on plan-recognition-as-planning to compile away the observations and ensure that at least one goal is satisfied, (ii) compute a set of high-quality plans on the transformed planning problem, and (iii) cluster the resulting plans into scenarios so that similar plans are grouped together. The scenarios are clusters of high-quality plans that include a trajectory of cause-effect transitions from the Mind Maps, explaining the largest possible subset of observations, and such that each plan ends with a business implication.
To transform the plan recognition problem
To compute a large set of high-quality plans on the transformed planning task, we use top-k planning techniques [7,17]. Top-k planning is defined in as the problem of finding k set of plans that have the highest quality. We use the
To cluster the plans, we apply a hierarchical clustering algorithm on the resulting plans [3]. To compare plans with each other, we consider the union of the set of states traversed by that plan. That is, we consider the set of all predicates that were true at some point along the plan. Given that the number of ground predicates (i.e., F) is finite, we first represent each plan through a bit array of the same size such that 1 indicates the predicate was true at some point during the execution of that plan, and 0, otherwise. To determine the Euclidean distance between two plans, we compute an exclusive or of the corresponding bit arrays and take the square root of the sum of 1 bits. Given this distance function for each pair of plans, we compute a dendrogram bottom-up using the complete-linkage clustering method [3]. The user can specify a minimum and maximum consumable number of scenarios. These settings are used to perform a cut through the dendrogram that yields the number of plans in the specified interval with the optimal Dunn index [4], a metric for evaluating clustering algorithms that favors tightly compact sets of clusters that are well separated. Hence, rather than presenting all plans, we group similar plans and only present 3–6 clusters of plans or scenarios to the end user.
We present the scenarios as both text summaries and graphically. We perform several tasks to prepare the scenarios for presentation. First, we separate the predicates in each cluster into business implications and regular predicates (i.e., the scenario and emerging risk). Second, we identify the leading indicators or the discriminative predicates, i.e., predicates that appear early on the plans that are part of one scenario but not other scenarios (i.e., they tend to lead to this scenario and not others); these are useful to monitor in order to determine early on whether a scenario is likely to occur. Third, we compute a summary of all plans that are part of the scenario and present this as a graph to the user (see example in Fig. 4). This serves as an explanatory tool for the predicates that are presented in each scenario. This graph also shows how the different Mind Maps are connected with each other through their shared forces.
Performance comparison in terms of coverage, time, and node expansion. NE is the average number of nodes expanded. time is measured in seconds. PGE/PGD is planner grounding enabled/disabled
Performance comparison in terms of coverage, time, and node expansion. NE is the average number of nodes expanded. time is measured in seconds. PGE/PGD is planner grounding enabled/disabled
In this section, we evaluate the performance of the planner, quality of the clusters measured by the size of the cluster, and how informative each cluster is, measured by number of predicates and business implications. In the next section, we provide details on the pilot deployment of the Scenario Planning Advisor (SPA) tool, feedback and the lessons learned in interacting with the domain experts as well as the business users. All our experiments were run on Intel(R) Xeon(R) ES-2680 @ 2.93 GHz machines, using a single core for each run, with the time and memory limit of 30 min and 2 GB, respectively.
Since the problem is computationally hard, and there exist no dedicated solver for the problem, we use the top-k planner [13]. The planner is based on a heuristic search algorithm
We create four sets of planning tasks. The first one is created using the full set of available Mind Maps (670 transitions overall) and a full set of 112 possible goals. The second one is created by taking a subset of Mind Maps, resulting in 403 overall transitions and 65 possible goals. To estimate the grounding influence on the overall performance, the last two sets mirror the first two, but are (partially) pre-grounded. We refer to these four sets as “lifted all”, “lifted small”, “grounded all”, and “grounded small”, respectively. To control the task difficulty, we vary the number of observations that are chosen randomly from the set of possible observations. For each number of observations chosen, we create 10 instances with that number of observations.
Performance comparison as we increase the number of observations and the number of Mind Maps
Performance comparison as we increase the number of observations and the number of Mind Maps
To explore the best planner configuration, we compare the planning performance of the two methods of translating the Mind Maps as well as the use of a heuristic and planner grounding. We use “lifted small” and “grounded small” with both the blind and the LM-cut heuristic [6], and with and without planner grounding. We use 10 problems of each observation set size, up to 45 observations, resulting in 150 problems overall. The timeout was set to 30 minutes. The summary of the results is shown in Table 1. Average time and node expansion are computed only on problems solved by all eight configurations.
The results show that while the use of LM-cut leads to exploring fewer nodes in search, especially with planner grounding enabled, the reduction in search effort does not compensate for the high computation time. Thus, the planner performance worsened, leading to solving fewer problems. Comparing the “lifted” to the “grounded” formulation, the heuristic informativeness does not sufficiently improve when shifting to a partially grounded representation and not enforcing a full grounding by the planner. When a grounding is enforced by the planner, the heuristic greatly reduces the number of node expansions, but even such dramatic reduction is not sufficient to compensate for the considerably increased computation time. Thus, in what follows, we restrict our attention to the lifted representation and to the blind heuristic, without enforcing full grounding by the planner.
Next, we present the evaluation of SPA performance on “lifted small” and “lifted all”. The results are shown in Table 2. The objective of this experiment is to show how the planning task size influences the performance and the resulting clusters. All entries show averages over 10 tasks of the same size. We use the same numbers of observations for both methods. The columns present the planner performance in seconds, number of observations, “Obs”, number of unexplained/discarded observations in the optimal plan, “Disc”, number of actions in the optimal plan, “Act”, and number of scenarios generated “Scen”. We also show the average and standard deviation for the number of members of each cluster, number of predicates, and number of business implications, “Bis goals”, in each scenario. The timeout was set to 30 minutes. Problems with 30 or more observations had timeouts and are not reported here.
The results show that planner performance depends not only on the Mind Maps size, but also on the number of observations. Further, as the number of observations grow, not only the planner’s run-time performance worsens, but also the number of scenarios increase, and the number of plans in the scenario decrease. On the other hand, as the number of observations increase, the number of predicates in a scenario and the number of business implications decrease, but not consistently; moreover, the low standard deviation indicates that the clusters are balanced and informative. Also note that, given the number of plans to cluster, cluster sizes depend on the requested maximal number of clusters, a parameter of the clustering algorithm. This parameter was set to find between two and seven clusters. Decreasing the max cluster limit, increases the member size, as well as the number of predicates and bis implications in each scenario.
The SPA tool was evaluated in a pilot deployment with several teams of business users at IBM, whose responsibilities included risk management within their business area. For those teams, SPA was introduced together with the new scenario planning process; hence, there was no pre-automation baseline available to compare against. In addition, the functionality provided by the overall tool is not easily reproducible, due to the broad news analysis the tool performs.
The Mind Maps were developed over the course of three months by one enterprise risk management expert working with an assistant and in consultation with other experts. While Mind Maps in general can be in any form, we briefly educated the domain experts to provide structured Mind Maps as defined in Definition 1. The pilot deployment featured the set we referred to above as “lifted all”. Additionally, the end users (i.e., the analysts) provided us with a list of possible keywords, organizations of interest, key people, key topics, and were able to pick the relevant key risk drivers when we presented them with the summary of relevant news and RSS publications. Note that while the Q&A process takes some time, the domain experts had received education and guidance and were aware of the process. The domain experts also know that the result quality depends on the richness of the Mind Maps they create. We also actively work on enhancing their experience by providing several tools to assist them. For example, we proposed an approach to suggest a list of important people, organizations and sources to the domain experts using the Wikidata Query Service [18].
The tool was configured with the help of end users. In particular, configuration values were identified based on the generated results quality and the assessment by end users. Specifically, the number of plans to find, minimum and maximum number of clusters, and action costs are all configurable and were assigned by exploring various values. In addition, all the cost of the actions, both with respect to the translation of the domain knowledge into planning as well as the associated penalty for a discard action is also configurable. While we currently set all these configurations with the help of the users, all configurable values can be learned in the future. In addition, we have tried various syntax-based distance metrics, the one presented in the paper produced the best scenarios according to the domain experts.
The teams have universally found the tool easy to use and navigate. Although no detailed feedback was collected for each scenario, the teams have reported that approximately 80% of generated scenarios had identified the implications that directly or indirectly affect the business. By design, the tool aims at helping the business users to think outside the box and is expected to generate some irrelevant scenarios, among others. Judging by the provided comments, the teams whose business is affected by frequent political, regulatory, and economic change have found the tool more useful than those operating under relatively stable conditions. In addition, the teams found the explanation graph, a visualization of a set of plans, essential to the adoption of the tool. They believe that the explanation graph “demystifies” the tool by providing them with an explanation of why they are presented with a particular scenario. This is critical for the business users or policy-makers who would be basing their decisions on the generated scenarios.
In working with the domain experts and users from the start of the pilot deployment, we learned several lessons, which can be applicable to other settings: (1) the users are interested in using AI planning techniques, but expressing their problems in PDDL or another existing formal planning language is a barrier. To overcome this, we asked the experts to provide their knowledge in the form of structured Mind Maps, which we then translated to the planning task. Further, different experts may want to work on different parts of the problem; hence, rather than having one huge Mind Map, we allow them to provide a set of Mind Maps, each of which can be developed separately, by different experts; (2) the users are interested in being presented with several scenarios rather than one, along with the explanation of each scenario. This captures the possible alternatives rather than a precise prediction, analogous to a generation of a multiple plans rather than a single (optimal) plan; (3) the users are interested in personalized scenarios, specific to their particular use case. To address that we consider the Mind Maps as a template and allow personalization of the scenarios by incorporating additional information provided by the Force Impact. Hence, computing a set of high-quality plans for different use cases results in different set of plans, which in turn results in different scenarios.
Related work and summary
There exist a body of work on the plan recognition problem (e.g., [11,24]). However, most approaches assume that the observations are perfect, mainly because raw data is not taken as input, but analyzed and transformed into observations in pre-processing [21]. Also, plan libraries as input are mostly assumed (e.g., [5]), whereas we use planning tools. Furthermore, there is a body of work on learning the domain knowledge (e.g., [22,23]). Our focus in addressing knowledge engineering challenges was to transform one form of knowledge, expressed in Mind Maps, into another form that is accessible by automated planners, similarly to the work of [16], adapting it to scenario planning. However, learning can be beneficial in domains in which plan traces are available.
In this paper, we applied AI planning techniques to a novel application, scenario planning for enterprise risk management. We addressed knowledge engineering challenges of encoding the domain knowledge from domain experts. To this end, we designed a tool, Scenario Planning Advisor (SPA), that takes as input raw data, news and social media posts, and interacts with the business user to obtain observations. SPA also allows uploading Mind Maps, a way of expressing the domain knowledge by the domain experts, and obtains additional information based on these Mind Maps from an automatically generated questionnaire. SPA then generates scenarios by first finding a many quality plans and then clustering the found plans into a small set of clusters, to be consumable by a human user. The SPA system is in pilot deployment with business users. The feedback received so far has been positive and confirms the benefits of our approach to the scenario generation application.
Footnotes
Acknowledgements
We thank Claudio Martinez, Deepak Turaga, Nagui Halim, and Edward Shay for their guidance and support. This material is based upon work supported in whole or in part with funding from the Laboratory for Analytic Sciences (LAS). Any opinions, findings, conclusions, or recommendations expressed in this material are those of the authors and do not necessarily reflect the views of the LAS and/or any agency or entity of the United States Government.