
Abstract
Enabling Ride-sharing (RS) in Mobility-on-demand (MoD) systems allows reduction in vehicle fleet size while preserving the level of service. This, however, requires an efficient vehicle to request assignment, and a vehicle rebalancing strategy, which counteracts the uneven geographical spread of demand and relocates unoccupied vehicles to the areas of higher demand. Existing research into rebalancing generally divides the coverage area into predefined geographical zones. Division is done statically, at design-time, impeding adaptivity to evolving demand patterns. To enable more accurate dynamic rebalancing, this paper proposes a Dynamic Demand-Responsive Rebalancer (D2R2) for RS systems. D2R2 uses Expectation-Maximization (EM) technique to recalculate zones at each decision step based on current demand. We integrate D2R2 with a Deep Reinforcement Learning multi-agent MoD system consisting of 200 vehicles serving 10,000 trips from New York taxi dataset. Results show a more fair workload division across the fleet when compared to static pre-defined equiprobable zones.
Introduction
Mobility-on-Demand (MoD) systems are gaining popularity over privately owned vehicles and public transport due to lower prices and shorter journey times [8], reducing the number of vehicles with few passengers on board and, in the long run, reducing the quantity of privately owned vehicles. In this paper, we consider a MoD scenario in which a fleet of ride-sharing enabled vehicles operates as a door-to-door MoD service. In other words, we consider a situation in which passengers are not willing to walk towards a meeting point or from the drop-off location to their final destination. Each vehicle in the fleet aims to gather multiple riders from multiple requests onboard, driving them to their destinations. Recent works within this line of research and application suggest that MoD systems with ride-sharing (RS) can achieve similar level of service with a small number of vehicles by better optimizing: (i) vehicle to requests assignment [2] and (ii) rebalancing (RB) idle vehicles to fit real-time demand [29]. In this paper we present a solution that addressed both of these items, with the focus of an innovative aspect being an improvement in the RB algorithm. However, for completion and understanding of the overall approach, we discuss vehicle to request assignment as well.
Vehicle to request assignment addresses how, when a request by a passenger (or a group of passengers) comes in, a specific vehicle is assigned to serve it. It depends on the contextual situation (e.g., the geographical position of the request origin and the desired destination, the positions of vehicles with available space to accommodate the number of passengers in request, etc). We provide an overview of the approaches which address this issue in Section 2.2.
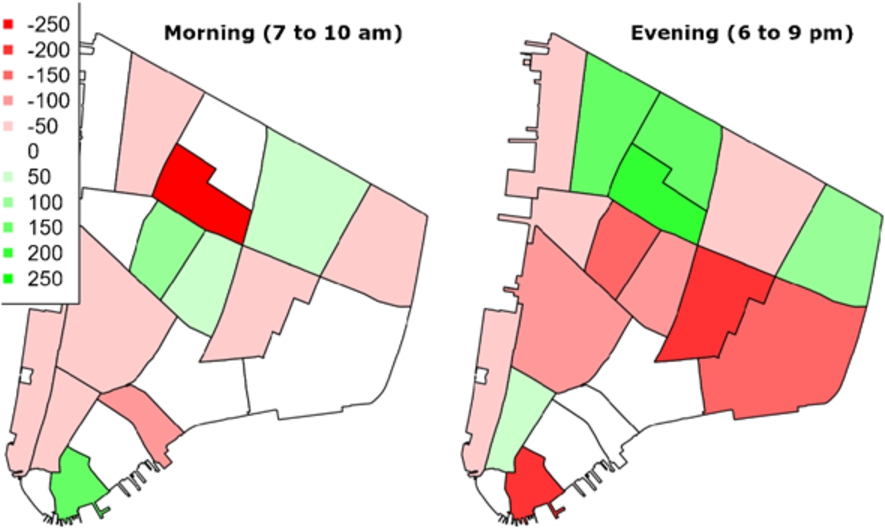
Observed demand imbalance in New York taxi dataset [26] trips between morning (7–10 am) and evening (6–9 pm) peak hours in the south part of Manhattan on tuesday, February 2nd 2016.
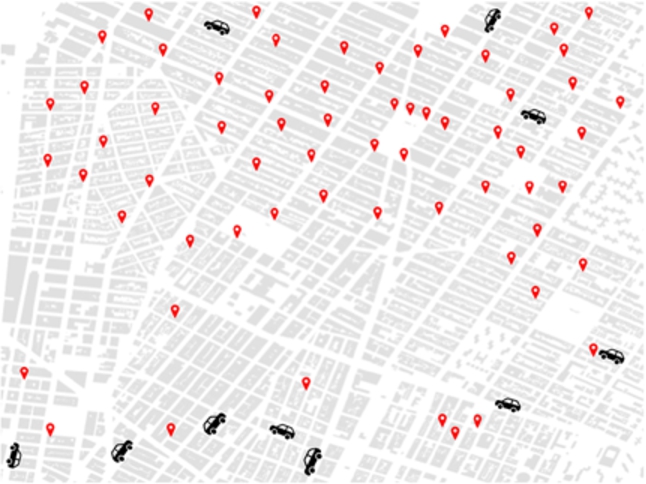
Example of an unbalanced fleet distribution where demand (requests in red) location differs from available supply (vehicles).
The main focus of our contribution is, however, on fleet rebalancing, an aspect of MoD systems that has not yet been significantly investigated despite having a strong impact on level of service of RS-enabled systems [29]. To illustrate the problem we are addressing, we first discuss the imbalance in density of requests in different areas of the system. Figure 1 shows requests from New York taxi dataset [26], and shows the difference in the number of passengers arriving to the area as their destination, and leaving the area, i.e., having it as an origin of their MoD request. Green shows areas where more passengers are reaching the zone than those who are leaving it, white depicts the situation where the two flows are balanced, and red shows areas with a negative balance. The intensity of the colour, and associated numbers in the legend, depict how significant this difference is. For example, – 250 red, depicts that the number of people who left the zone is 250 larger than the number of people who arrived in, during the listed time period. This imbalance in number of passengers results in imbalance in locations of MoD vehicles serving them. We illustrate this effect in Fig. 2, where most of the demand (red marks) is concentrated in the top area while the majority of vehicles (black marks) are located in the opposite side after finishing their last trip. Adaptively adjusting the fleet positioning to better follow (or even predict) changes in the demand spatial patterns can improve the level of service from the perspective of the users of the MoD system. Previous works on fleet rebalancing adopt strategies that relocate vehicles according to past or current demand. Within a system characterised by a rebalancing strategy, agents can choose, according to the current situation evaluated also in the light of the recent past, that it is reasonable to move to an area in which the current density of vehicles is low and upcoming ride requests are likely and they would be hard to serve. This decision can lead to travels with an empty vehicle: this cost actually represents an investment on future rides. Rebalancing can be achieved using pre-defined locations for the vehicles (station-based relocation) or by defining a set of areas (also called zones) each vehicle can be sent to. Rebalancing approaches can rely on a static [1,10,12,24,29,30] or a dynamic partition of the network to split it into zones. Rebalancing vehicles using a dynamic partition is expected to better track changes in mobility demand e.g., caused by temporary network disruptions, special events concentrating demand temporarily and long-term city developments affecting observed patterns. However, only a single approach to dynamic rebalancing has been presented so far [19]. While it represents an important step in dynamic rebalancing, in that it enables boundaries between the zones to change dynamically, it still consists of a fixed number of zones, i.e., more fine- or coarse-grained partitioning is not possible.
To address this gap, in this paper, we propose a Dynamic Demand-Responsive Rebalancer (D2R2) which utilizes Expectation-Maximization (EM) to derive dynamic zones (represented as request clusters). D2R2 estimates numbers and position of relocating zones based on the current distribution of requests, and then defines a probability distribution for the vehicle to be relocated into, every time a vehicle needs to relocate.
The novelty of our approach is twofold: first, boundaries and number of relocating areas are computed when required and second, rebalancing probability for each zone is allocated dynamically using only unserved requests data available in real-time. Therefore, D2R2 does not require data collection and no training phase is required to rebalance vehicles, enabling our proposal to operate from the beginning while being responsive to current demand.
To evaluate D2R2, we integrate it as an additional rebalancing module with a Multi-Agent Reinforcement Learning (MARL) ride-sharing enabled MoD system used to dispatch requests to vehicles. The system consists of 200 vehicles (implemented as RL agents) which serve 10,000 ride requests in lower Manhattan road network. Requests have been generated according to the open NYC taxi dataset [26] to be representative of real demand patterns. We assumed that riders use a mobile application to request a vehicle ride from an origin to a destination. Agents connected to the rider-request system receive the requests, however, to limit the complexity of the problem, at each time step it considers serving only the three closest requests that it can serve given the seat availabilty and the number of passengers in the request. A vehicle estimates the time needed to reach the pick-up point of a request. If this time, taking into account also the time already waited by the rider(s), is less then the maximum waiting time that the rider(s) is willing to wait, the vehicle could serve this request. Note that, we only take into account congestion estimate based on historical data, but not current congestion, so travel time might not exactly match our estimation. Our evaluation shows that, with our approach, requesters have to wait less time to be served, but probably the most interestingly, the improvement is on the vehicle side.We show, in fact, that the proposed rebalancing scheme, despite requiring vehicles to perform movements without any passenger, sees both an expected reduction in idle time, as well as a consistent improvement of the overall number of served rides (which can be seen as a proxy for economic benefit on the vehicle side). This means that the overall fleet is more effective, and that each member will see a benefit in the form of increased vehicle usage, although of course this will come at the cost of a slightly increased overall travelled distance.
The rest of this paper is organized as follows. Related work on rebalancing for MoD is presented in Section 2. Then, after presenting underlying Deep RL and clustering technique in Section 3, D2R2 approach to demand-responsive rebalancing is detailed in Section 4. Simulation set up is introduced in Section 5 and results of our approach are presented in Section 6. Finally, Section 7 summarizes the work and discusses future work directions.
Ride-sharing systems consist of two main steps: matching ride requests with empty vehicles or those that have available seats. In this section we review how both of these steps are achieve in state of the art research.
Vehicle rebalancing
Characteristics of existing rebalancing algorithms
Characteristics of existing rebalancing algorithms
Rebalancing for MoD can be categorized in the approaches relying on static rebalancing zones [1,10,12,29,30] and dynamic zones [19]. In static rebalancing zone generation, geographical coverage of relocation zones is predefined at design time. For example, in [12], NYC Lower Manhattan area is divided in predefined zones which do not change over time. Each vehicle, using RL, learns and decides at each time step whether to relocate to one of the neighbouring zones or to stay in its current zone. In [10], rebalancing areas in Austin, Texas, are defined by partitioning the area in 2-mile by 2-mile square blocks. Block balance is calculated for each zone, capturing the excess or deficit of vehicles within the block in relation to supply and expected travel demand. Blocks with a negative balance try to gather vehicles from neighbourhood where there is a surplus, and expected travel demand is estimated from historical data and current requests. In [1], zones are defined using a fine-grained but also static grid. In [30], if a vehicle is idling, it can rebalance based on its local knowledge: according to the demand distribution in surrounding areas, it decides to rebalance to a neighbouring zone or not. The work presented in [29] partitions the area into rebalancing zones according to the road network layout. Zones are defined such as that for each region
The majority of the approaches allow rebalancing only for idle (and empty) vehicles, while [1] and [12] enable vehicles to rebalance during the execution of the routes, and as such is available in any system that enables ride-sharing. Mix rebalancing with RS assignment allow RS pick-ups from neighbouring zones, shortening waiting time for passengers, but increasing their travel time.
The only current work that uses dynamic zone generation for rebalancing is presented in [19]; rebalancing zones are computed using a clustering algorithm. A k-means clustering is applied on virtual requests generated by a distribution defined on historical data. Therefore the coverage and the size of the zones can change, but the total number of zones remains fixed. This approach is the closest related work, however, we allow different number of zones based on different density of requests. Furthermore, our approach relies on real time data rather than historical to have a better respond to dynamic demand.
Table 1 summarizes existing work on rebalancing for MoD systems, categorized by four main characteristics: Analysed data, which can be historical, real-time or both, depending on what kind of data is rebalancing based; Dynamic # zones, i.e., whether the number of rebalancing zones can change over time; RB empty, whether the vehicles relocate only when empty or can relocate as a part of RS assignment; and Dynamic boundaries, whether the area covered by each rebalancing zone can adapt dynamically.
We observe that the main issue of reviewed research is the low adaptability to demand changes (daily, seasonal, or more long-term ones resulting from new city developments), as the addition of new city areas/zones, or changing their granularity, requires system redesign.
With respect to request assignment, multiple algorithms are used in the literature to match riders and vehicles. A full review of vehicle assignment algorithms is out of scope of this paper as our contribution focuses on rebalancing, nevertheless, we highlight some of the vehicle-requests assignment techniques.
A basic vehicle-rider matching systems, e.g., [4,17], simplify the matching by grouping passengers with common pick-up and drop-off locations. Similarly, [9,22] enable ride-sharing by defining a common pick-up and/or drop-off location which suits multiple riders at the cost of a short walk to reach the pick-up point or from the drop-off location to their final destination.
More sophisticated systems include a centralized schedule-based vehicle-request assignment, where schedules are computed to enable ride-sharing and updated on a fixed time base, e.g., [2,29] or graph-based models, e.g., [19] which represent requests on a graph and solve using Integer Linear Programming.
RL-based approaches are also common, and can be divided into two categories, centralized, where a single agent controls the whole fleet, e.g., [10,30]. Decentralized approaches define vehicles as agents which independently explore the environment and discover a policy to serve the ride requests. To simplify the problem, limitations can be applied while picking requests, e.g., that requests served in ride-sharing are within the same zone [1], or that have at most a one-zone-detour [11].
In this paper, we adopt such a decentralized approach. It is worth mentioning, however, that, even though we illustrate D2R2 application in conjunction with an RL-based vehicle assignment, D2R2 is designed to be independent from the assignment algorithm used in the MoD system.
Background
This section introduces the background information needed to understand D2R2 design and implementation: Reinforcement Learning (RL) used for vehicle assignment problem and expectation maximization (EM) with model selection criterion for rebalancing.
Deep reinforcement learning
RL is a branch of machine learning in which an agent learns autonomously by trial-and-error to map actions to the current environment state, by receiving a positive or negative reward for their execution [28]. The goal of the agent is to learn actions that maximize the long term cumulative reward. RL iterates three tasks: at each time step an agent obtains the perception of the environment and maps it to a state s from its overall state space. Based on past experience, it can select an action a from the action space. The agent then, at timestep t receives a reward
In most of real-world scenarios, the environment space is complex or continuous, making it intractable to handle all possible state-action pairs. To overcome this issue, RL has been combined with deep neural networks to approximate states, giving rise to a range of Deep RL techniques. The approach we choose for our implementation is Proximal Policy Optimization (PPO) [27], which is simpler to implement and tune without affecting the performance when compared to other state-of-the-art Deep RL approaches. PPO uses a novel objective function, formed by three terms, which is maximized each iteration:
While we are not aware of any application of PPO in a ride-sharing problem, it shows good performance in many other applications with similar characteristics, such as portfolio management [18], robot control [15,20,23] or simulation and games [3,31], which motivated our decision to use it as basis for our implementation.
During training, PPO method collects a sequence of samples of length T from the environment and then it begins the update process through Eq. (1) to maximise gathered experience. As first, it estimates the advantage
Clustering
Expectation-Maximization (EM) is an iterative algorithm to find the maximum-likelihood estimates of parameters of a statistical model [25]. Although, its nature is to estimate the latent parameters, it has proved as good method for clustering as well. In fact, over the year has been largely used for that scope, to cite but a few, see [5,6,13]. In this work, we use EM to estimate cluster memberships across several Gaussian distributions. EM consists of two steps, Expectation (E step), which computes the complete log-likelihood of data memberships in clusters, and Maximization (M step), which, by maximizing the computed likelihood, updates the hidden parameters θ related to normal distribution, hence mean, variance and prior probability for each cluster.
Once terminated, the likelihood indicates how good our model fits data. However, this parameter alone does not take into account over-fitting and the number of clusters; in fact likelihood could be maximized with each datapoint belonging to a different cluster. An option to validate and select a model is by using Bayesian Information Criteria (BIC) [7]. It prevents over-fitting by taking into account number of clusters. BIC is computed through Eq. (6), where number of free parameters, k, depends on number of clusters. BIC measure weighs the number of free parameters with the number of samples available. It looks for the true model among the set of candidates.
We have opted to use EM over other clustering techniques, i.e., k-means, because it derives clusters by estimating parameters of normal distribution that underlies data. As result, EM defines good clusters, compared to other clustering techniques, even when some data are missing or not observable since it does not work directly on the data, i.e., by using a distance measure. Furthermore, EM enables clusters to have different shapes unlike other clustering methods which tends to find clusters with comparable areas by working directly on data points. Since EM aims to maximise the complete log-likelihood, as reported by Eq. (4), it could sometimes lead to suboptimal results due to local maxima. To overcome this, multiple runs of EM could be performed. However, we limit this issue by picking the best model across several candidates using BIC defined in Eq. (6).
Dynamic demand-responsive rebalancer
This section describes overall architecture of our MoD system, describing first ride-sharing request-to-vehicle assignment using RL in Section 4.1, followed by describing the main novel contribution of our paper, a Demand-Responsive Zone Generation for Real-Time Vehicle Rebalancing (D2R2) in RS fleets.
Although we presented this as a single system as shown by Fig. 4, where D2R2 exploits the requests obtained by the agent through the demand filter, the two modules, D2R2 and request-rider matcher, could work as stand-alone components. We first introduce our RS system using multi-agent Deep Reinforcement Learning, and then our novel rebalancer.
Ride-sharing using deep reinforcement learning
We designed a multi-agent decentralized algorithm for RS applied to a fleet composed of 5-seater autonomous vehicles for a MoD system, which is model-free and designed to be replicable to any other city.
To take a decision during exploration, agent samples an action based on some probabilities defined over the q-values where actions with higher q-values have higher probability of getting selected. The policy, i.e., Q-value estimates, are learnt using PPO [27], introduced in Section 3.1.
Each agent controls a vehicle, taking an action at each step by evaluating its internal state and perception, without communicating or coordinating with other vehicles. Agents evaluate and decide of an action in a sequential order. At each time step, each agent perceives the environment, updating perception and internal state, and decides of the next action: to pick-up a ride, to drop-off passengers or to wait being parked. Finally, it stores the transition in a buffer and evaluates if an update is necessary (line 33 in Algorithm 1). This cycle is described in Algorithm 1. Policy update relies on Eq. (1), after T transitions have been stored, the agent uses these samples to estimate the advantage (Eq. (3)).

Controller for a single vehicle V
The agent’s internal state (V.status in Algorithm 1) is composed of the vehicle position, represented by latitude-longitude pair, its destination, and the number of vacant seats. For an empty vehicle, destination is void, and if a vehicle is serving one or more requests, its destination matches to that of the request
The representation of agent internal state has been kept simple to enable multiple agents sharing the same knowledge. When designing the requests assignment module, we aimed for a solution that could easily scale up by treating vehicles in a standard way regardless the equipped seats. Thus, internal state records the available free seats rather than information of carried passengers. Vehicle destination matches the one of the passenger(s) that can be served the quickest.
Including an higher level of details into internal state, i.e., reporting all the passengers destination, not only demands a complicated model, but also requires multiple models when scaling the problem to a fleet composed by vehicles with different number of equipped seats. In addition, many times these neurons are fed with empty values, since the vehicle is not always getting around full.
Perception P (V.perception in Algorithm 1) is composed of the three closest requests that an agent could serve and are filtered from the set of available requests at the given time. A request r is available to a vehicle v if v has enough empty seats to accommodate the number of passengers associated with the request (ranging from 1 to 6), and the total waiting time for r, i.e., the delay between request being created and estimated passengers pick-up time, is less than the maximum time allowed (set to 15 minutes). All customers, who have waited more than 15 minutes leave the system without being served, and the request is recorded as not served. Finally, requests already picked-up by the vehicle, are represented as V.queue in Algorithm 1.
Perception is defined as the aggregation of states of requests perceived by an agent,
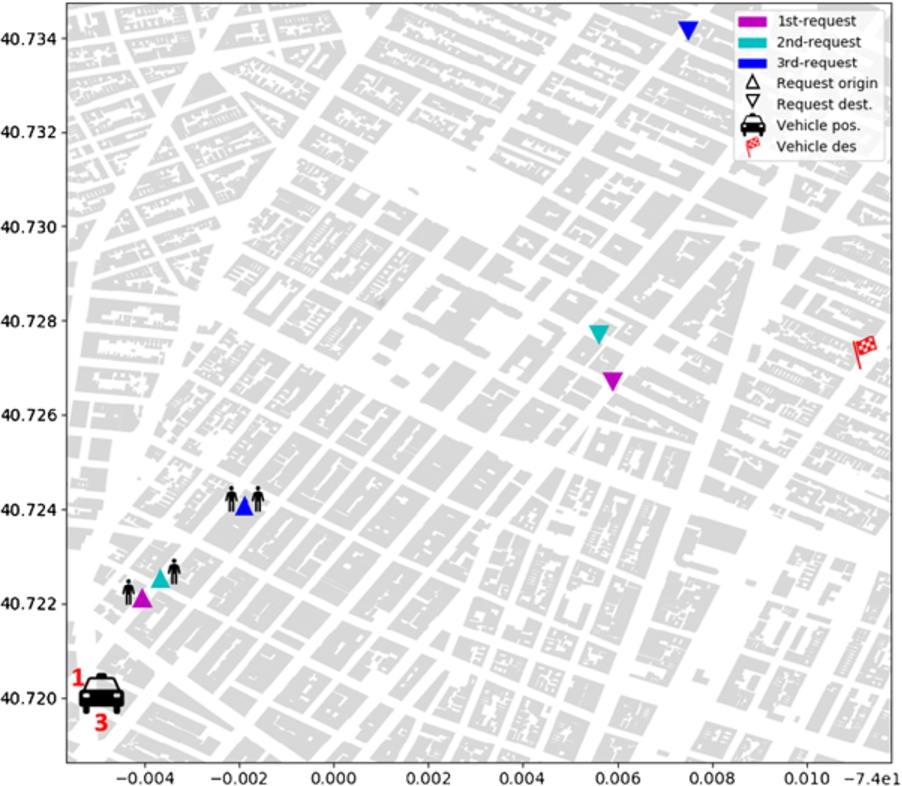
Vehicle state and perception. Vehicle is already carrying a single passenger and evaluates whether pick-up one of the three perceived requests, doing ride-sharing, or not.
Rewards associated to actions are shown in Algorithm 1. An agent get a penalty (impossibleActionReward) whenever tries to perform an action impossible to fulfill: attempting to drop-off while being empty, as shown at line 14, or trying to assign a request that could not be assigned, line 29. When the vehicle successfully assigns the request, a reward is received, lines 26–27. This, corresponds to commonReward if the picked passengers are the firsts, otherwise corresponds to RSReward. The best (DOReward) and the potential worst reward are related to the same action, lines 18–20: when a vehicle is doing a drop-off while carrying passengers from several requests. If the travel time for passengers to reach their destination exceeds the estimated travel time without RS from request origin to destination more than a defined value, then DOReward is penalised based on the additional travel time caused by the detour. In detail, we compute the detour ratio (detourRatio), defined as travel time to serve the request enabling ride-sharing over the expected travel time from the origin to the destination of the request, we compare it to a fixed threshold (max_detourRatio) and finally, if needed, reward is penalised.
Finally, a mild penalty is given whenever the agent decides to being parked, lines 4–8. This is tuned according to the possibility of the agent to perform other valid actions. In detail, ordered by severity of penalty, onlyPossibleAReward whether the agent would receive impossibleActionReward if trying to perform other actions, notOptimalAReward if the vehicle, being empty, decides of stay parked rather than evaluating new requests, and lastly badActionReward if the agent could have performed any of the other actions instead.
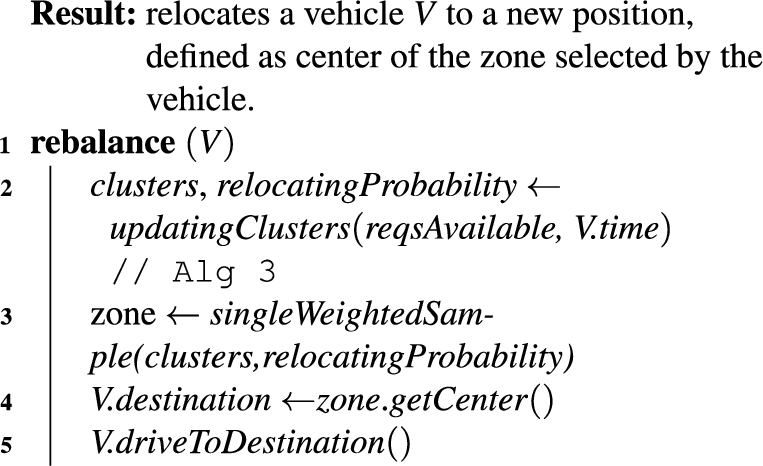
D2R2 rebalancer can be used with different MoD systems, however for illustration we describe its implementation as combined with the Deep RL ride-sharing request assignment strategy presented in previous section. Rebalancing is triggered by the park action and when the vehicle is not serving any requests and it has no further requests to serve in its neighbourhood. D2R2 aims to dispatch vehicles efficiently and dynamically according to current demand, preventing fleet unbalance, which in turn can result in longer passenger waiting times, or an increased number of unserved requests. D2R2 infers relocating zones and computes their associated probabilities (Eq. (7)) for a vehicle to be relocated into:
The D2R2 framework is illustrated in Fig. 4, depicting the rebalancing module and an agent behaviour. The demand filter has a double role: it filters three requests for the agent perception and also provide those for computing rebalancing zone and probabilities. D2R2 takes as input pending requests available at current time filtered according to the time frame timeFrame (line 2–5 Algorithm 3). All previous unsatisfied requests and future requests (estimated or scheduled), are not taken into account. Algorithm 2 describes the procedure applied to relocate an idle vehicle to a new position. First, D2R2 generates new clusters, based on pick-up position for pending requests, following Algorithm 3. For a single rebalancing task, several runs of EM occur, producing different number of clusters ranging between min_#zones and max_#zones as shown in Algorithm 3 at line 7. The algorithm then selects the model which better represents the data by choosing the clustering model which minimizes BIC measure (line 7 in Algorithm 3). The vehicle is then rebalanced to a zone within the selected clustering model according to a weighted random selection defined over a probability distribution among clusters and computed in Eq. (7) (line 3 in Algorithm 2). Among different approaches we preferred a weighted random selection to enable vehicles exploring different zones while rebalancing, avoiding all the vehicles to rebalance in a similar area.

Architecture of the implemented framework from a single agent perspective. D2R2 is integrated to the requests assigner module.
Single vehicle relocating by D2R2

Defining relocating zones for rebalancing
Each agent therefore, at each timestep, takes an action using its policy trained though PPO and, when needed, relocates by computing zones through EM as described in this section.
We evaluate the performance of D2R2 in an RL-based RS system by using a fleet of 200 5-seater vehicles controlled by autonomous agents. Requests have been extracted from NYC city taxi data, and filtered to include only requests within lower Manhattan in New York City. Our evaluation is performed using data for the evening peak hour (from 6 to 9 pm), and consists of the first 10,000 requests available that match our criteria as follows. The 10,000 requests have been generated by aggregating trips from 50 consecutive Tuesdays between July 2015 and June 2016 (to represent a typical weekday demand pattern). Passengers by request, during evening peak time, are distributed as follows: 71.95% of demand is composed single passenger request, 13% by two, 4.1% by three, 2.28% by four, 5.3% by 5 and the remaining 3.37% by 6. On the other hand, training is performed on the morning peak hours (from 7 to 10 am) obtained in the same way as the set used for evaluation. By using different datasets for training and testing, we wanted to test resilience of our RL-based model and preventing overfitting to training data. In addition, using different demand sets emulates a significant change in demand pattern as could occur in a real word scenario over time. Agents learning stage is performed by running multiple rounds of single-vehicle training. Only a single vehicle
This emulates a multi-vehicle concurrent exploration without competition between vehicles in serving customers. All the experience gained by all of the vehicles during training is gathered into a single learning process. In this way, all the agents update the same learning process, to optimize the use of acquired knowledge and speed up the overall learning process. However, if one vehicle fails to do the update, or is not available to serve requests in a particular location, the others can continue seamlessly. Once training is completed, knowledge is replicated to all vehicles of the fleet. This allows new vehicles/agents to join the fleet without carrying out any additional training.
Travel information for vehicles is estimated using the Open Source Routing Machine (OSRM) [21], which, given two longitude-latitude coordinates, estimates the distance and travel time driving on the shortest route from origin and destination. Distance and time are computed according to a 24-hours snap-shot acquired from a real-world scenario. It is important to note that OSRM does not evaluate the real-time congestion, so its impact on our approach is not evaluated. This is listed later as a limitation of our work, and is currently a very common assumption/limitation in other existing MoD/RS literature.
Agents, which are implemented using Tensorforce [16], use PPO with a deep neural network with a dense topology. Input layer has 20 neurons since an agent can perceive at most 3 requests and for each request we take number of passengers and position with destination, as latitude-longitude coordinates, while the output layer has 5 neurons, one for each action. Between input and output layer lie three hidden layers, each of them composed of 32 neurons. Activation function used is tanh for all the layers except for the final where softmax is used. This enables the network to obtain a distribution over the Q-values. During training, agent samples an action according to weighted probabilities defined by the last layer. The clipping ratio is set to 0.2 and the discount factor to 0.99. We used Adam [14] optimizer, with a learning rate of
PPO batching capacity is 100, and we executed 10 iterations over the batches of the PPO objective. The model was trained during 20 episodes, and each episode is composed of 10 rounds in which a vehicle serves requests. Each episode does not have a fixed number of iterations, as it terminates when a given agent does not have any more requests to serve.
For training and testing, agent follows the procedure reported by Algorithm 1. For vehicle rebalancing, timeFrame is set to 10 minutes while number of zones, min_#zones and max_#zones, ranges between 3 and 50. The reward model has been designed to promote ride-sharing and to prevent long detour for passengers. impossibleActionReward is set to
During training, rebalancing is disabled to avoid unpredictable bias as it relies on a random weighted choice to select the new zone in which a vehicle is relocated into. For this reason integrating rebalancing as an action would have affected agents learning, requiring more exploration.
Evaluation results and analysis
To evaluate the performance of D2R2 rebalancing strategy, we propose 5 different scenarios, as presented in Table 2.
Specification of evaluated scenarios
Specification of evaluated scenarios
Vehicle randomly chooses the rebalancing zone.
The first baseline scenario (Base – no RB, no RS) imitates the behaviour of a simple MoD system without ride-sharing or rebalancing. In the second baseline scenario (RS only) ride-sharing alone is enabled. Third baseline is a MoD with both ride-sharing and rebalancing, but the number, size, and boundaries of zones are fixed (similarly to existing related work) and the zone for rebalancing is chosen randomly. We also evaluate two variations of D2R2. (D2R2 RB only) uses D2R2 without ride-sharing while (D2R2 RB and RS) uses both ride-sharing and rebalancing. This combination of scenarios allows us to evaluate the benefits of rebalancing overall as well as the benefits of D2R2-based rebalancing specifically.
For all simulations, we assumed each vehicle to have a capacity of 5 passengers, therefore requests with more passengers are ignored by vehicles. This means that, based on the dataset used, the maximum level of service the fleet can reach is serving 96.63% of the 10,000 requests.
We rely on commonly used measures adopted by related work [1,2,12,29] to evaluate the performance of D2R2 in the proposed scenarios. The overall performance of the MoD fleet is assessed by analysing the number/percentage of served requests and the percentage of requests that involved ride-sharing (as opposed to occupancy of the vehicle only by one or more passengers from a single request). From the passenger perspective, we evaluate the average detour ratio (
From the vehicles perspective, we recorded the distribution of the number of passengers per vehicle in the fleet and computed its variance (σpass). We also recorded the average distance travelled per vehicle (
Simulation results
This section presents the simulation results for all the scenarios.
Level of service. From the system perspective, as reported in Table 3, each scenario shows a different level of service. Scenario Base – no RB, no RS, which models a classical taxi service, serves around 74% of requests, and D2R2 RB only serves 95% of the requests. All other scenarios (RS only, RS with fixed zones RB, and D2R2 RB and RS) achieve maximum level of service possible with 5-seater cars, of 96.63% requests. The results show that by enabling ride-sharing in combination with a rebalancing strategy, with fixed zones or D2R2, decreases number of request ride-share (70% and 68% vs 80%) when compared to RS only. However, detour ratio is decreased (1.5 vs 1.7), which means that average time needed for passengers to reach their destination is decreased in D2R2 RB and RS and RS only with fixed zones RB. Note that,

Comparison of simulation results for all the 5 analysed scenarios for the following metrics: waiting time
Passenger waiting time. Figure 5a shows passenger waiting times for each scenario. By enabling ride-sharing in the baseline scenario (RS with fixed zones RB) or D2R2 (D2R2 RB and RS), we observed a significant reduction when compared to Base – no RB, no RS. RS only shows lower overall waiting times (3.761 minutes) when compared to D2R2 RB only (4.218 min). However, ride-sharing can generate additional delay for passengers as vehicles are following a detour to serve more requests as shown in Table 3. Rebalancing in addition can limit the additional travelled distance due to detours as the vehicle relocates in zones with closer requests that can be matched. Hence, D2R2 RB only results as the best option for passengers with respect to travel time.
Passenger distribution. We can observe in Fig. 5b that in Base – no RB, no RS many vehicles are driving with only a few passengers. These vehicles, once serving one or few requests, may end up in an area of the network that is empty of any further request. Enabling rebalancing or ride-sharing can prevent them from staying idle and help vehicle to find new requests. This can be observed from scenarios D2R2 RB only and RS only, where further improvements are achieved by enabling ride-sharing and rebalancing, as all vehicles serve a similar number of passengers. In particular, D2R2 RB and RS seems to converge to a higher average value when compared to baseline rebalancer RS with fixed zones RB. Moreover, as shown in Table 3, the variance of the number of served passengers is also lower: the combinations of these leads to conclude that the ROI for the individual vehicle/agent, member of this network, is more consistent and stable (for a fixed number of vehicles serving shared rides).
Vehicle mileage. Distance travelled by agents is depicted in Fig. 5c. Base scenario Base – no RB, no RS shows that around one fourth of vehicles are travelling only a few kilometres, confirming they only serve a few requests and then stay idle in an area with no further demand. Also, since the number of served requests varies by scenario, an important difference in terms of distance travelled was recorded. We further investigate travelled distance in Table 3. From the table, we can confirm that enabling rebalancing adds additional travel distance for empty vehicles.
Performance metrics across all the 5 evaluated approaches. All values refer to 10,000 requests served by a fleet composed by 200 5-seater vehicles
As our approach relies on learning and clustering techniques, we further investigated its performance by performing additional simulations to observe if the results are consistent across runs. Here we focus only on scenarios combining ride-sharing and rebalancing, specifically our approach D2R2 RB and RS, and a baseline RS with fixed zones RB. Figure 6 and Table 4 show the same three metrics (waiting time, number of passengers served, vehicle mileage) across the two RS- RB- enabled scenarios over 20 simulations. Figure 6a shows waiting time for all satisfied requests over the different runs (193,260 requests in total over 20 simulations), while the remaining, served passengers Fig. 6b and distance travelled Fig. 6c, regard 200 vehicles, composing the fleet, over 20 simulations, i.e, total of 4,000 vehicles. We can observe that D2R2 provides consistent performance, with waiting time mean being 196 seconds, from Table 4 and 90% confidence interval ranging from 1 to 4 minutes and 57 seconds, with served passengers mean being 73 and 90% confidence interval ranging from 49 to 97 and with distance travelled mean being 140.3, from Table 4 and 90% confidence interval ranging from 143 to 150.
As graphs show, our proposal D2R2 RB and RS is consistent across multiple runs, even though it relies on a degree of randomness given by a RL-based system for vehicle-request matching and a dynamic demand-responsive strategy to relocate empty vehicles.

Comparison of simulation results over 20 simulations for the RS- RB-enabled scenarios: waiting time (a), passengers distribution per vehicle (b) and distance travelled per vehicle (c). Data shown are obtained by aggregating results generated from 20 simulations composed by 10,000 requests served by a fleet of 200 5-seater vehicles.
Performance metrics comparison over 20 simulations between the two RS, RB (fixed and D2R2) enabled scenarios. Values refer to 10,000 requests served by a fleet composed by 5-seater vehicles
Simulation results show that enabling ride-sharing alone is enough to satisfy all of the requests possible to serve, when the baseline Base – no RB, no RS only serves 74%. Introducing rebalancing (whether fixed, or D2R2) increases level of service to satisfying 97% requests. However, D2R2 rebalancing results in slightly shorter waiting time and lower detour ratio than fixed zone rebalancing. However, the main observed advantage of D2R2 (with RB and RS) is that the workload that each vehicle has to carry out seems to better converge to a global average value (Fig. 5b), resulting in fairer workload distribution. This is in contrast to other scenarios, where we observed that a few agents are contributing more that the others and some vehicles can be under-utilized, serving only a few requests. The closest in terms of workload distribution to our approach is (RS with fixed zones RB), however the variance is still larger at 82 passengers vs 63 in our approach (as σ pass in Table 3 shows). Interestingly, fairness is not a metric existing work considered. Our results show that this should be included as a standard measure when evaluating ride-sharing systems, along side other system, user and vehicle metrics. We also observe that approaches with rebalancing (RS with fixed zones RB and both D2R2 scenarios) generate additional travelled distance: total mileage is slightly increased due to empty vehicles travelling as a part of relocation process.
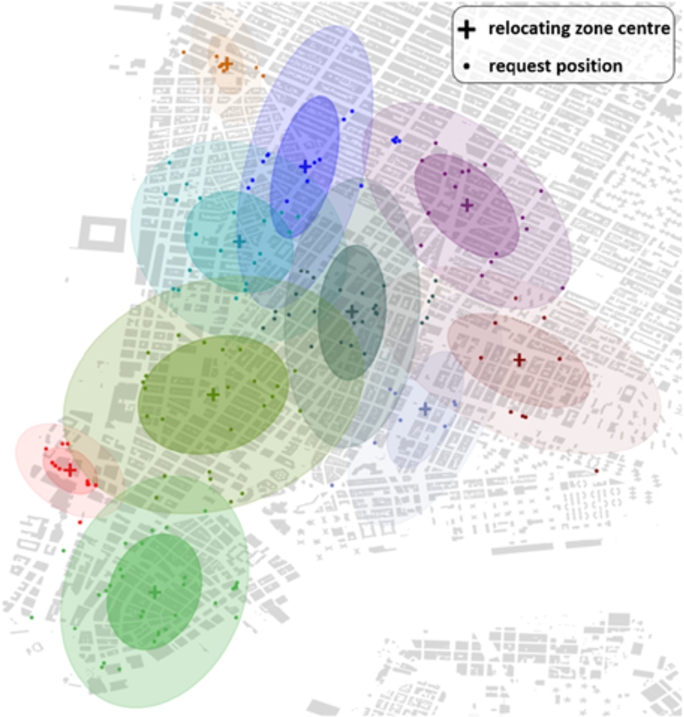
Sample D2R2 outcome, during a simulation run of D2R2 RB and RS scenario over the evening peak, while evaluating rebalancing zones for a single vehicle. Requests origin that lead to this partitioning are also displayed.
To illustrate the zone outcomes of D2R2 and how does it differ from fixed zone clustering, we here show a snapshot of the number, size, and shape of the clusters it generated for a particular vehicle v at time t (Fig. 7). In this instance, 10 relocation zones were computed by D2R2. Cluster centres are represented by a cross and colours intensity indicates its rebalancing probability. However, the number of clusters throughout the simulation, based on the demand at any particular time, ranged from 4 to 30, as illustrated in Fig. 8, with the majority being in range between 13 and 20. To conclude, at the cost of additional processing in onboard devices, D2R2 removes the need for more complex centralized computation. The required processing cost is not really resource demanding and can be affordable by onboard devices since are not either power or processing constrained.
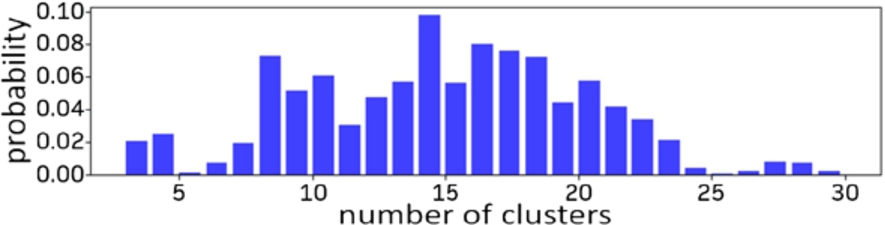
Distribution of number of zones identified by D2R2 during a single run of the simulated scenarioD2R2 RB and RS for a fleet composed by 200 vehicles.
While evaluating our proposed rebalancer D2R2, we had to make some simplyfing assumptions which introduced limitations in the current version of the approach. We discuss these limitations here. First, since we are retrieving the travel time through the use of an external engine as OSRM, our vehicles are not impacted by, or impact on, current congestion. Second, D2R2 does not evaluate the distances between vehicle and zones when computing rebalancing probabilities. By taking into account these distances, relocating cost, due to travelling while being empty, could be reduced and total travelled distance further minimised. Third, when picking up a request, an agent can choose only between closest three requests. This limitation has been added to reduce the complexity of the decision-making neural network. A change in filtered requests would require a re-training of the model from scratch. Forth, we kept our reward structure for underlying RS system simple. Many reward models with different granularity are proposed in RL-literature, (e.g., based on distance to additional request, or waiting time) but these were never compared in a common scenario to select optimal one. Fifth, we only present the results in terms of temporal metrics for passengers (e.g., waiting time) and vehicle load, without analysing impact and implications of these results on economic benefits. RS systems have three sets of stakeholders: passengers, vehicle drivers, and overall fleet operators,each aiming to maximize their own performance, from financial, as well as from quality of service perspective. If we consider the impact of the RS system on the comprehensive traffic context, probably also the hosting municipality and regional authorities should probably be included, both as relevant economical actors as well as regulators. Such an analysis, which would require an interdisciplinary effort, is out of scope of this paper, but our results indicate that fairness, in the form of passenger to vehicle distribution, should be added as a metric when evaluating economic benefits. Lastly, there are few constraints applied to our scenario that can be tuned without requiring a full re-training process. Vehicles are equipped of 5 seats dedicated to passengers, while in real world there are several options available. Maximum detour ratio when picking up an additional request is fixed to 30% added to the estimated journey time of the original passenger from origin to destination. 1.3, which means that when planning for a new pick-up, the onboard passengers will not be required to pick other. Note that, after arriving to destination, the detour experienced by passengers could exceed the fixed threshold, this can happen when the agent gives the drop-off priority to other passengers, since vehicle destination matches the one of the request that can be served the quickest. Further development and evaluation of the approach should remove these limitations and evaluate their impact on the overall performance.
Conclusion and future work
This paper presents D2R2, a novel vehicle rebalancing algorithm for ride-sharing mobility-on-demand systems. Unlike existing approaches which use a fixed number and fixed geographical division of the network in zones to relocate empty vehicles, D2R2 uses EM clustering to dynamically generate zones. D2R2 enables zones to be dynamic in terms of their number, position and boundaries. First, rebalancing zones are identified by analysing real-time pending requests at each time step from each vehicle perspective. The zone to which a vehicle rebalances is then selected, among the defined zones according to a probability distribution defined over the zones. Thus, idle vehicles are spread across the area rather than rebalanced to the same zone(s). D2R2 effectiveness is shown by integrating it with 200 RL-based ride-sharing vehicles, which serve 10,000 ride-sharing requests in the lower Manhattan area. We compare D2R2 to approaches with no rebalancing and fixed-zone rebalancing, and observe a more fair workload division across the fleet when using D2R2, indicating a more accurate rebalancing strategy, without loss of performance with respect to waiting time and distribution of passengers per vehicle.
This paper presents a preliminary study to evaluate if dynamic rebalancing is promising, since it is, further evaluation studies are required. In particular, we need to test 1) the effectiveness of computing dynamic rebalancing zones in presence of congestion caused by our fleet; 2) ROI evaluating cost and profit of a single vehicle and of the whole fleet. Finally, this work can be expanded in multiple directions. To verify its general applicability, it should be integrated with other RS approaches, and evaluated on other road network maps and datasets. In terms of improving the underlying PPO learning process, vehicles could be enabled with further online learning, to fine-tune their behaviours to new request patterns as they arise.
Footnotes
Acknowledgement
This publication has emanated from research supported in part by research grants from Science Foundation Ireland (SFI) under Grant Number 18/CRT/6223, Center for Research Training in Artificial Intelligence, and Grant Number 16/SP/3804 (Enable).