
Abstract
Conventional k nearest neighbor (KNN) rule is a simple yet effective method for classification, but its classification performance is easily degraded in the case of small size training samples with existing outliers. To address this issue, A multi-average based pseudo nearest neighbor classifier (MAPNN) rule is proposed. In the proposed MAPNN rule,
Introduction
K-Nearest neighbor (KNN) rule is easy yet effective classification algorithm. In KNN rule, the asymptotically classification performance can be achieved by using the Bayes method under sufficient conditions [16]. It was first proposed for classification [3]. According to this algorithm, a query sample is assigned to the class represented by the majority of the k nearest neighbors in the training set. It is one of the top ten classification algorithms in data mining [23]. Hence, KNN has attracted wide attention. Many KNN-based classification methods, such as [16,18,22,24], have been reported.
As a nonparametric classifier, KNN classification results are easily affected by outliers, especially in the case of small size training sets [26]. To deal with this problem, some powerful methods have been proposed to improve classification performance. A local mean-based nonparametric classifier (LMKNN) has been proposed [19]. Its classification accuracy is better than the ordinary KNN in the case of small samples with the existing outliers. The category of a query point is classified according to the distance-weighted sum of k nearest points chosen from each class in pseudo nearest neighbor [25] (PNN) rule, which is based on the distance weighted k-nearest neighbor (WKNN) rule [6]. The classification performance is better than KNN in small-size training sample case with outliers. As an extension of both PNN and LMKNN, a local mean-based pseudo nearest neighbor classifier (LMPNN) was proposed [14]. In the LMPNN classifier rule, the class label of a query point is determined by the weighted distance sum between the k pseudo nearest neighbors and the query point. The classification accuracy is higher than other methods such as KNN, LMKNN, and PNN in general. Based on the ideas of LMKNN, PNN, and LMPNN, some new methods have been proposed [9–13,15,17,21,22,27] to improve classification performance.
A number of KNN-based classification methods have been proposed above. Based on this basis, a new multi-average pseudo nearest neighbor classifier (MAPNN) is introduced in this paper. MAPNN calculates
The key work in this paper is summarized as follows:
1. A new multi-average pseudo nearest neighbor classifier is proposed. In this method,
2. Experiments were conducted to verify the effectiveness and superiority of MAPNN.
The organization of the rest of this article is as follows. In Section 2, we briefly summarize the related work. In Section 3, we introduce the proposed MAPNN method. In Section 4, Differences between MAPNN and LMPNN are described. Section 5 presents extensive experiments on numerical data sets and synthetic data sets. Finally, the conclusions are given in Section 6.
Related work
In this section, we briefly review some related typical KNN-based classifiers.
LMKNN classifier
As a classical extension of KNN, LMKNN [19] is a simple yet effective classification algorithm. It utilizes average method to reduce the influence of outlier points. It’s less sensitive to k than KNN, especially in the case of small size training samples with existing outliers.
In the LMKNN rule, a given query sample
Step1. Calculate the euclidean distances between the query sample y and training samples from each class
Step2. A categorical local mean vector
Step3. Calculate the distance between the local mean vector
PNN classifier
For the improvement of KNN, The pseudo nearest neighbor classifier(PNN) shows good performance. The algorithm is described as follows:
1. Calculate the distance between a query sample y and the training sample
2. Assume that
3. Finally, the query sample y is classified into the class with the minimum distance of
LMPNN classifier
Multiple local mean-based pseudo nearest neighbors are utilized to predict the query sample pattern in LMPNN rule. As an extension of the PNN, LMPNN can further improve classification performance in the case of small size training samples with outliers. In the LMPNN rule, the category of an unclassified sample
Step1. Compute the distances between training samples in each class i and point y.
Step2. Calculate k pseudo local mean vectors for each class by the following formula:
Step3. Let
Step4. The pattern of the query point y is assigned into the class w when the distance
The proposed MAPNN classifier
In this section, we introduce multi-average pseudo nearest neighbor classifier rule, which is based on the ideas of KNN rules. The purpose of MAPNN rule is to improve the KNN-based classification performance in the situation of small size training samples with existing outliers.
The basic idea
In KNN rule, the classification accuracy is easily affected by outliers, especially in small size training samples cases. The choice of k value has a great impact on the KNN classification effect. If k is too small, the nearest neighbors may be outliers, hence, the classification performance is affected [12]. On the contrary, the classification accuracy may be degraded with large k value due to containing too many points from other classes among k-nearest neighbor points [12]. Furthermore, the farther neighbors has less importance in traditional KNN methods [25]. However, the farther neighbors may have more contributions to classification [14].
PNN, LMKNN, LPMNN have been reported to improve classification performance in the case of small size training samples with outliers. The larger weight coefficients are assigned to the nearer neighbors in PNN. This method reduces the negative impact of outliers, to a certain content. However, the classification performance can also be degraded by the outliers when the value of k is very big. LMKNN can overcome the negative influence of the existing outliers in some degree. However, the same neighbor size for each class, the same weight coefficient of k nearest neighbors may affect classification performance [12,22]. LMPNN utilizes the multiple pseudo local mean vectors based on k nearest neighbors of each class to classify a query point. It captures more class information compared to LMKNN [14]. Hence, the classification performance is better than LMKNN.
Based on the KNN-based algorithms above, a new multi-average based pseudo nearest neighbor classifier is proposed to further reduce the negative influence of existing outliers in the small size training samples cases.
The MAPNN classification rule
Let
1. Compute the distances between the training samples in each class
2.
3. Calculate the distances between
4. Let
5. Classify y as the class
As described above, the proposed MAPNN method is summarized as shown in Algorithm 1.
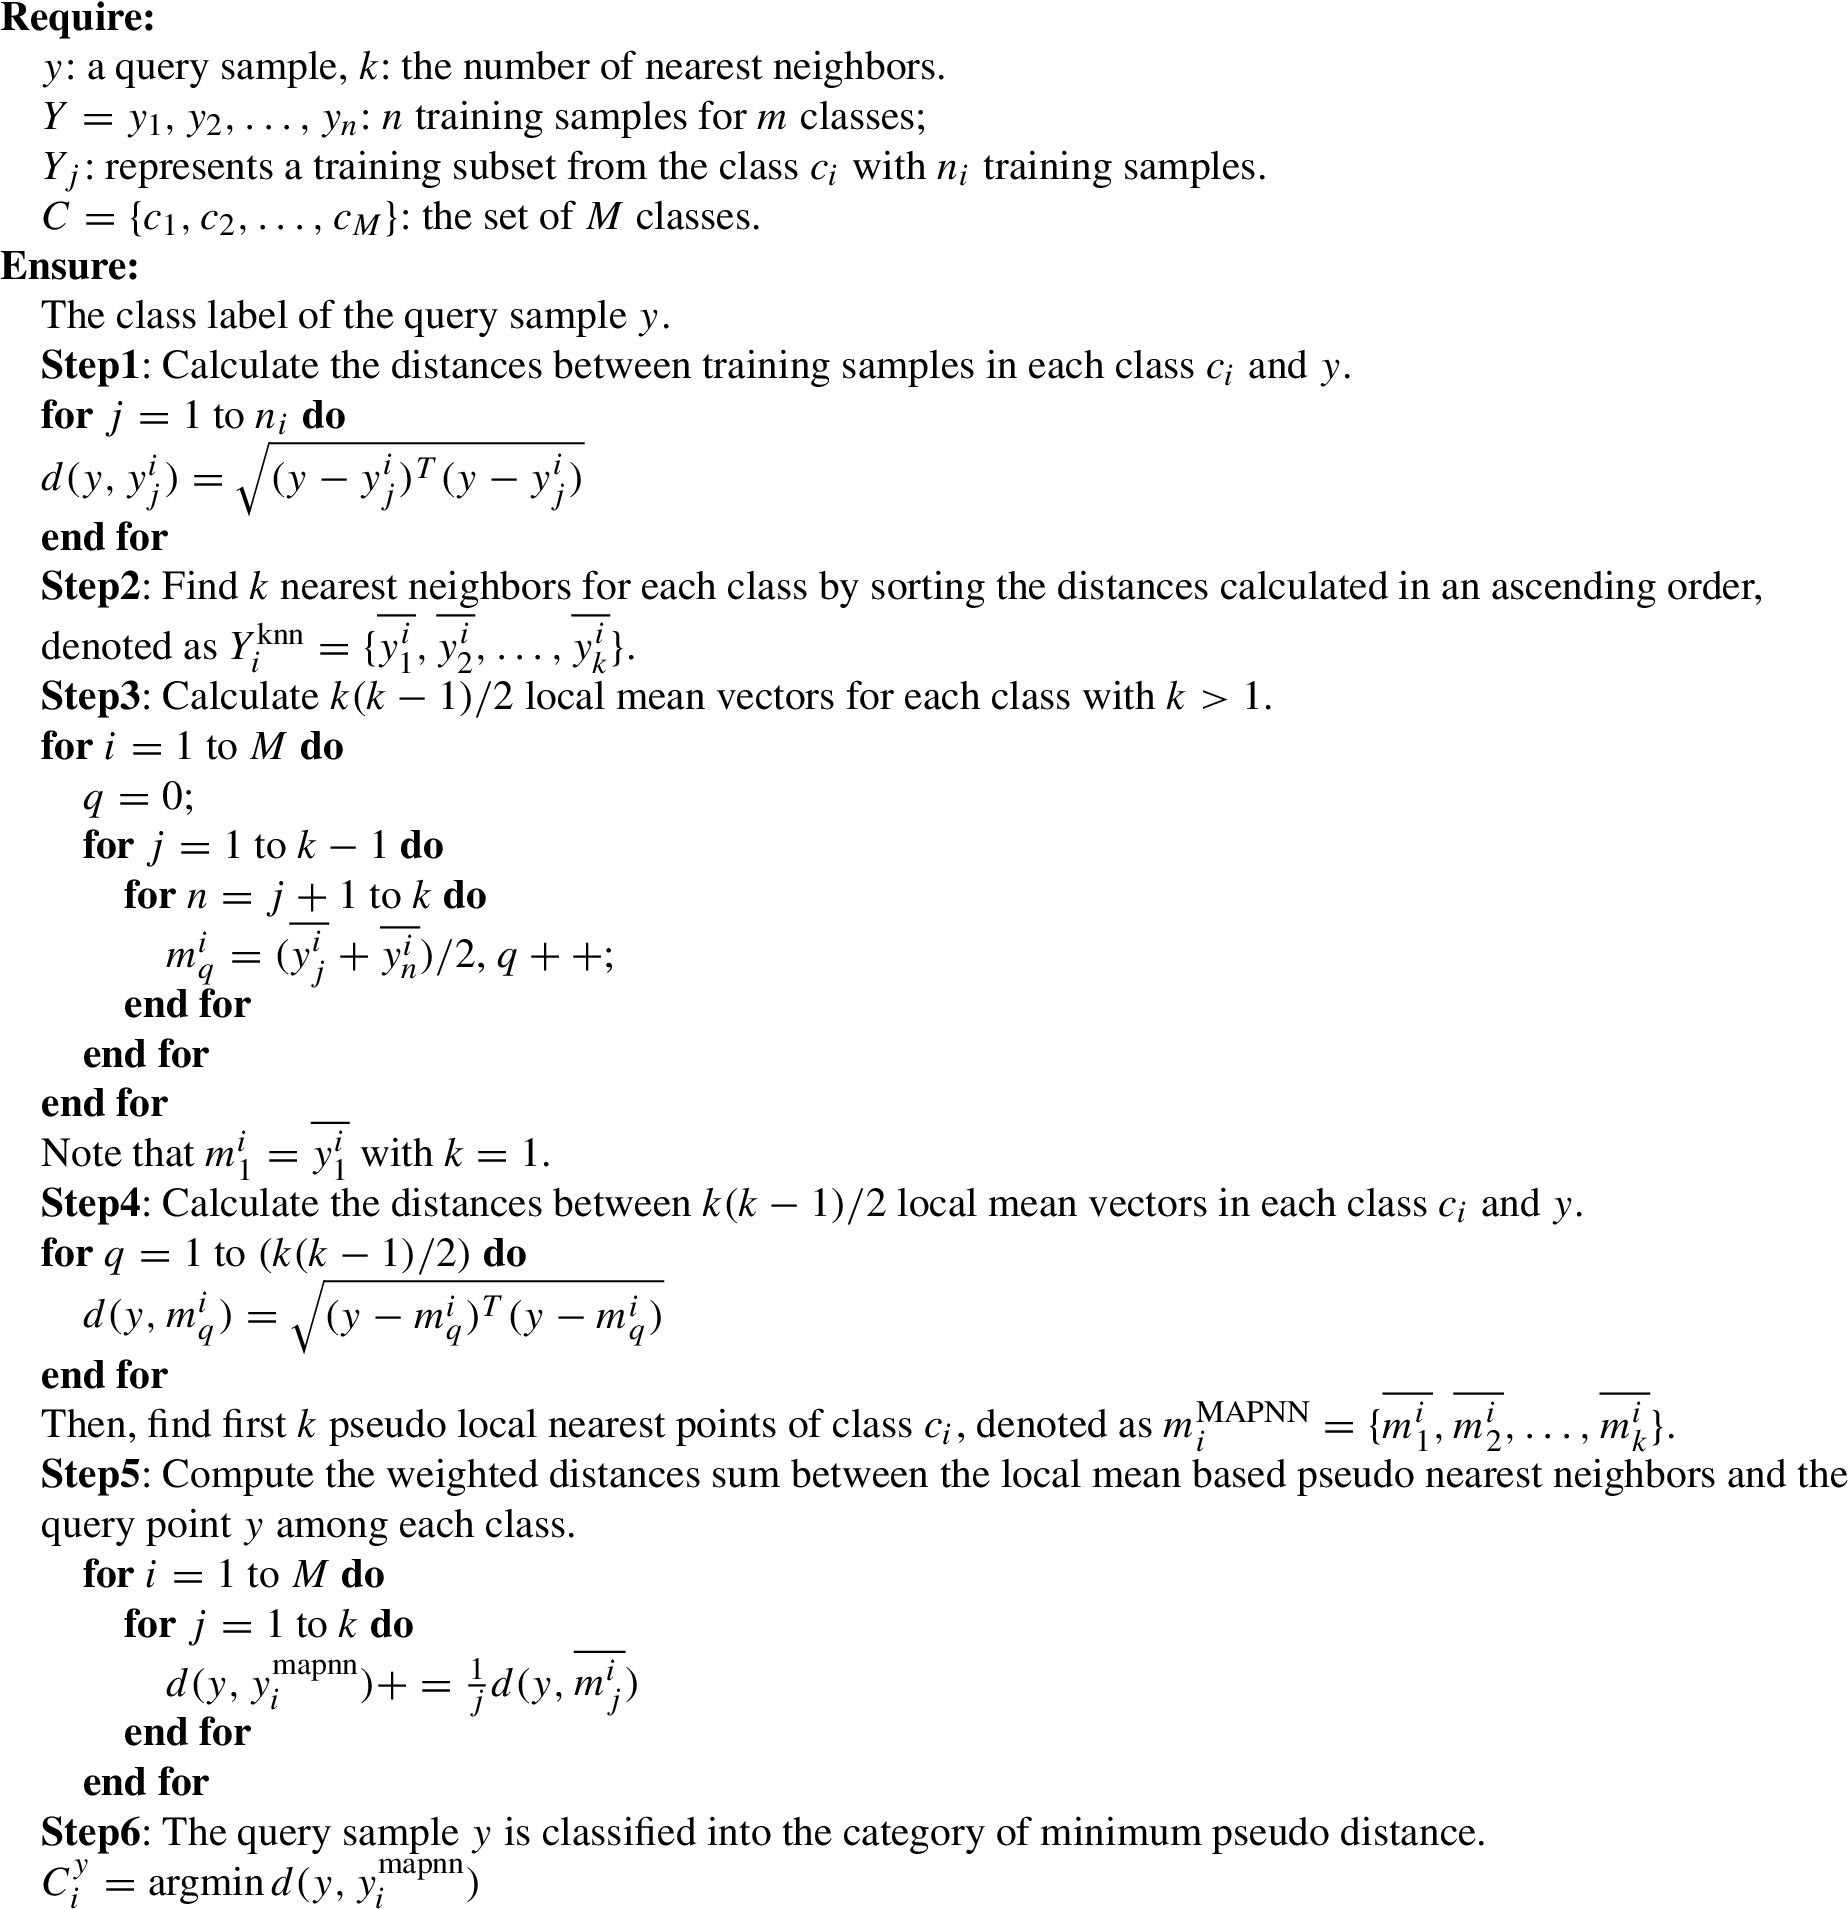
Outline of the Proposed Algorithm

The example of two-class classification problem with
The differences between LMPNN and MAPNN.
As described in 2.1–2.3 and 3.2, LMKNN, PNN, LMPNN, MAPNN are all local classifiers. LMKNN utilizes a local mean vector of every class for classification. As an extension of LMKNN and PNN, k local mean vectors from each class are used in LMPNN rule, more class information can be represented compared to LMKNN and PNN rules [14]. MAPNN selects the k pseudo nearest neighbors from
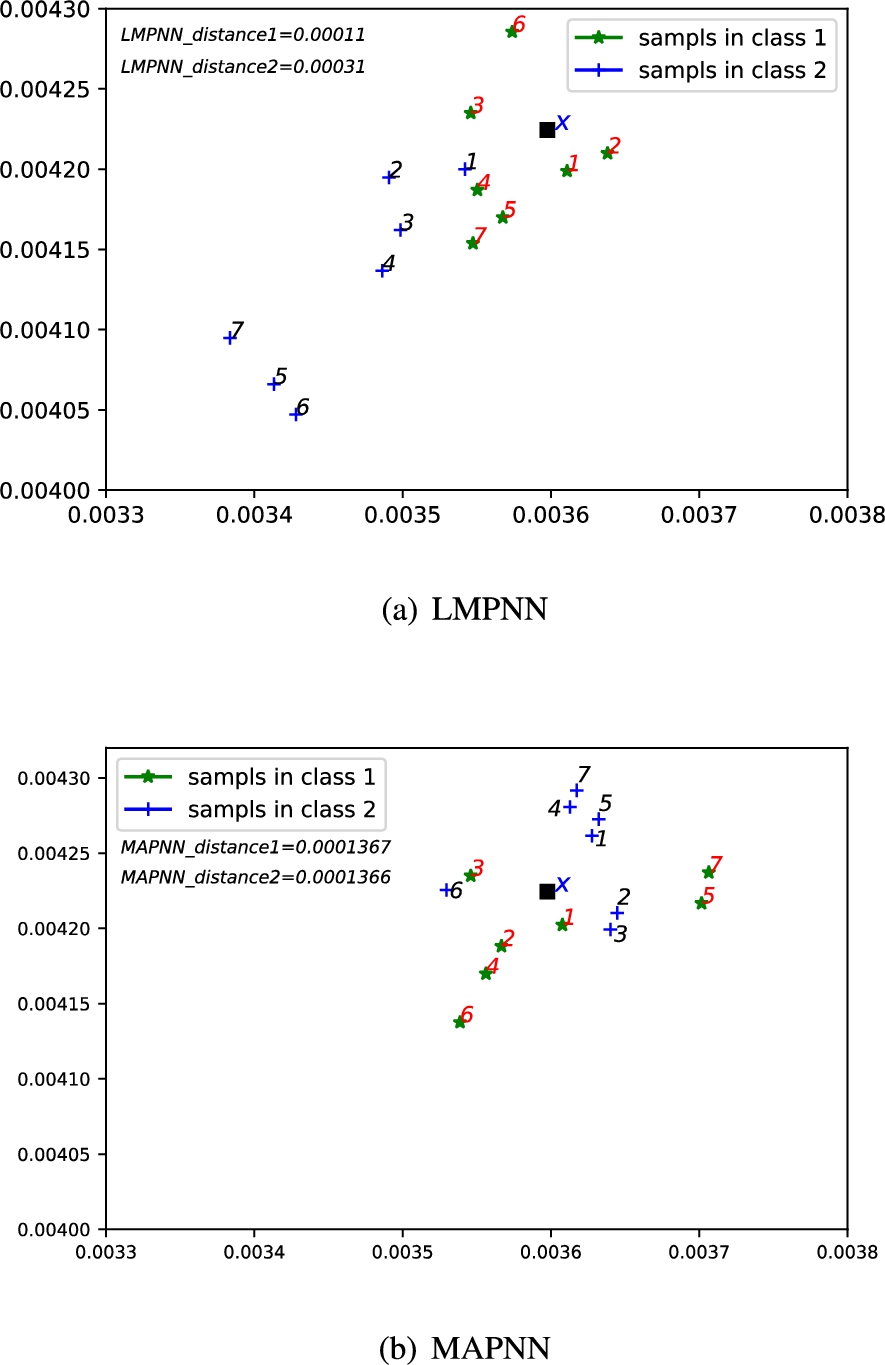
In order to compare MAPNN to LMPNN intuitively, for instance, a classification task on real numerical data set ‘Hill’ is illustrated. The dimensionality of the samples is reduced from 100 to 2 for visualization by Fisher Criterion [14,19]. The Fisher Criterion
A two class classification problem through the Fisher criterion for a query pattern x with
Distance values between x of class 2 and seven pseudo nearest neighbors in class 2 by using LMPNN and MAPNN
Distance values between x of class 2 and seven pseudo nearest neighbors in class 2 by using LMPNN and MAPNN
The data sets used in the experiments
In Fig. 2(a), ‘LMPNN_distance1’ and ‘LMPNN_distance2’ denote the values of the distances between the query point x and the seven pseudo nearest neighbors for two classes. As shown in Fig. 2(a), the query pattern x is wrongly classified to class 1 by using LMPNN. In MANPNN rule,
Table 1 lists the distances between the query point x of class 2 and seven selected nearest neighbors of class 2 by using MAPNN and LMPNN, respectively. It can be seen that the distance values of class 2 in MAPNN are less than the distance values in LMPNN. It implies that MAPNN can choose nearer pseudo nearest neighbors from more local mean neighbors comparing to LMPNN. Hence, MAPNN may further reduce the impact of outliers in some degree.
To validate the classification performance of MAPNN rule, we conduct the extensive experiments from numerical real data sets and synthetic data sets to evaluate the performance of our proposed algorithm.
Data sets
In this subsection, we briefly give the information of the selected data sets used in our experiments.
Real data sets
Synthetic data set: I
Synthetic data set: I
Synthetic data set:
Synthetic data set:
The twenty-one numerical real data sets are taken from the UCI Machine Learning Repository [2] and the KEEL Repository [1], which are Vehicle, Balance, Blood, Bupa, Ionosphere, hill, musk-1, climate, Sonar, Wine, Seeds, Cardiotocography, Band, Wine(keel), Thyroid, segment, arrhythmia, Robot, Opt, Image and Page, respectively. Among these twenty-one real-world data sets, The numbers of total samples, attributes, classes of each data set and source are also listed in Table 2. From Table 2, it can be seen that the data sets have different characteristics in numbers of attributes, samples, and classes. The numbers of all samples in the selected data sets are mostly small. These data sets can be well used to verify the proposed method classification performance in the small training sample size cases.
Synthetic data set: Ness
The average error rate of each classifier with the corresponding standard deviations (stds) on twenty one real-world datasets
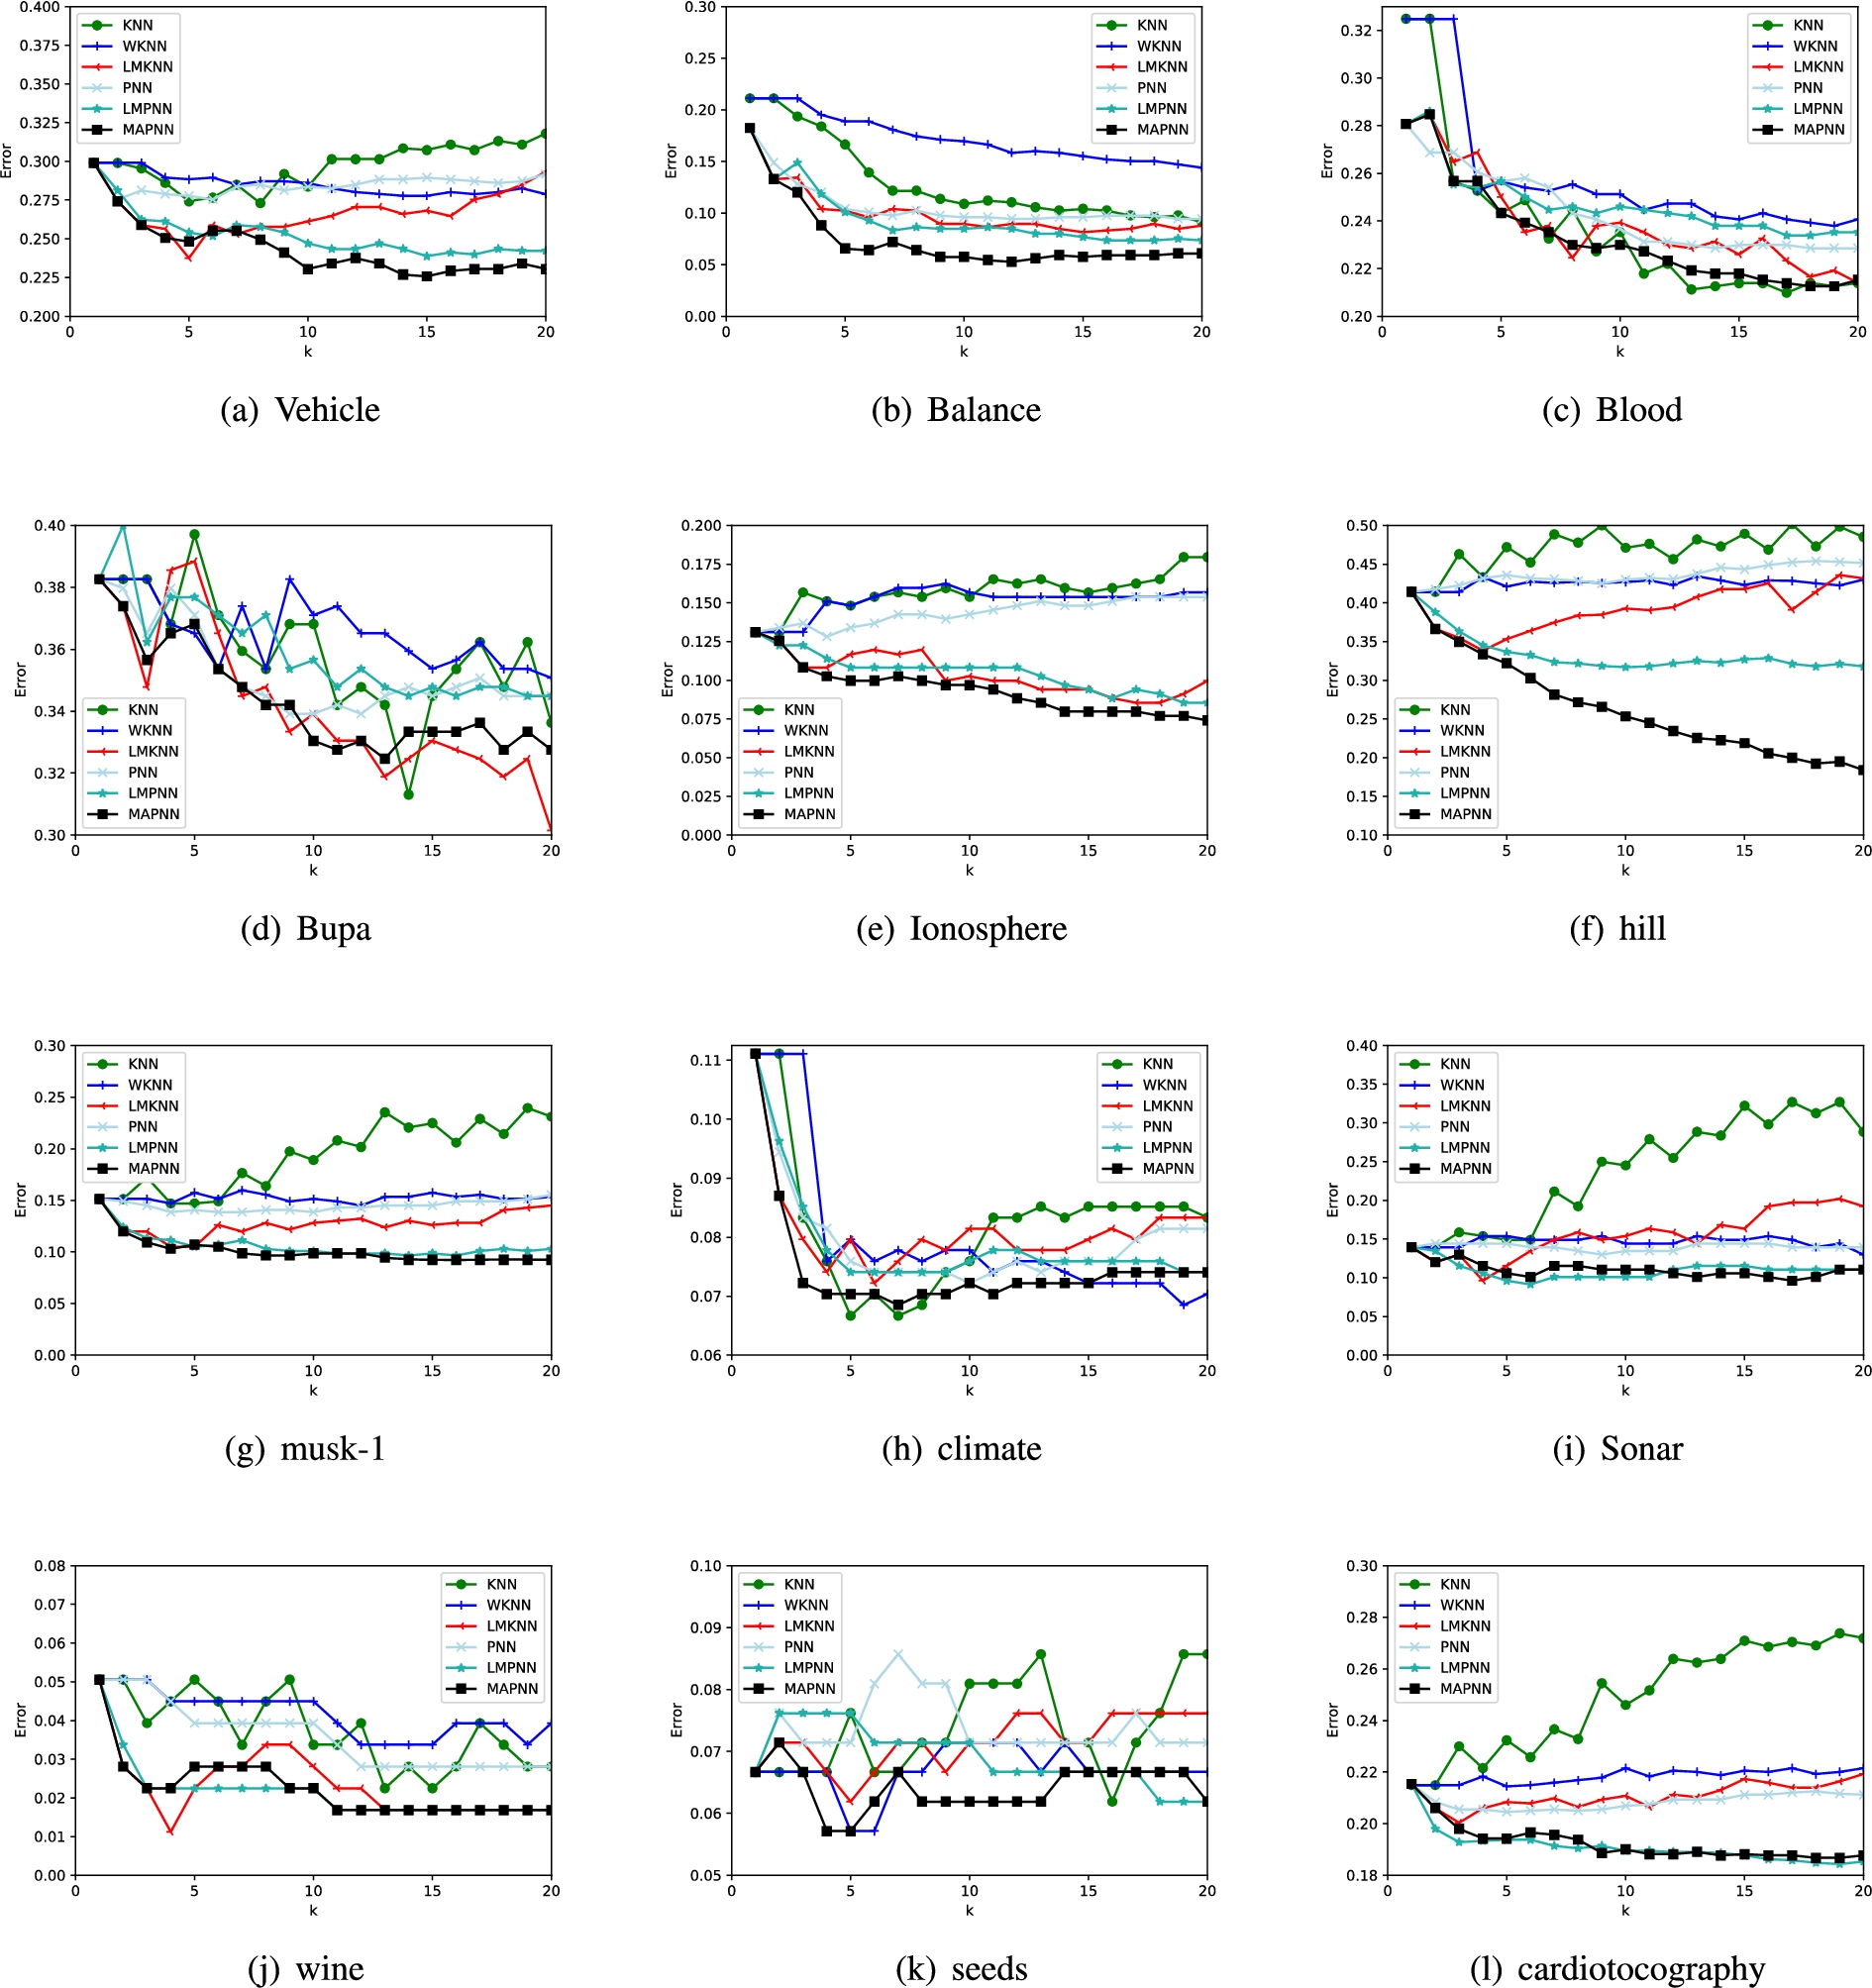
The classification error rates of each method via k on each numerical data set.
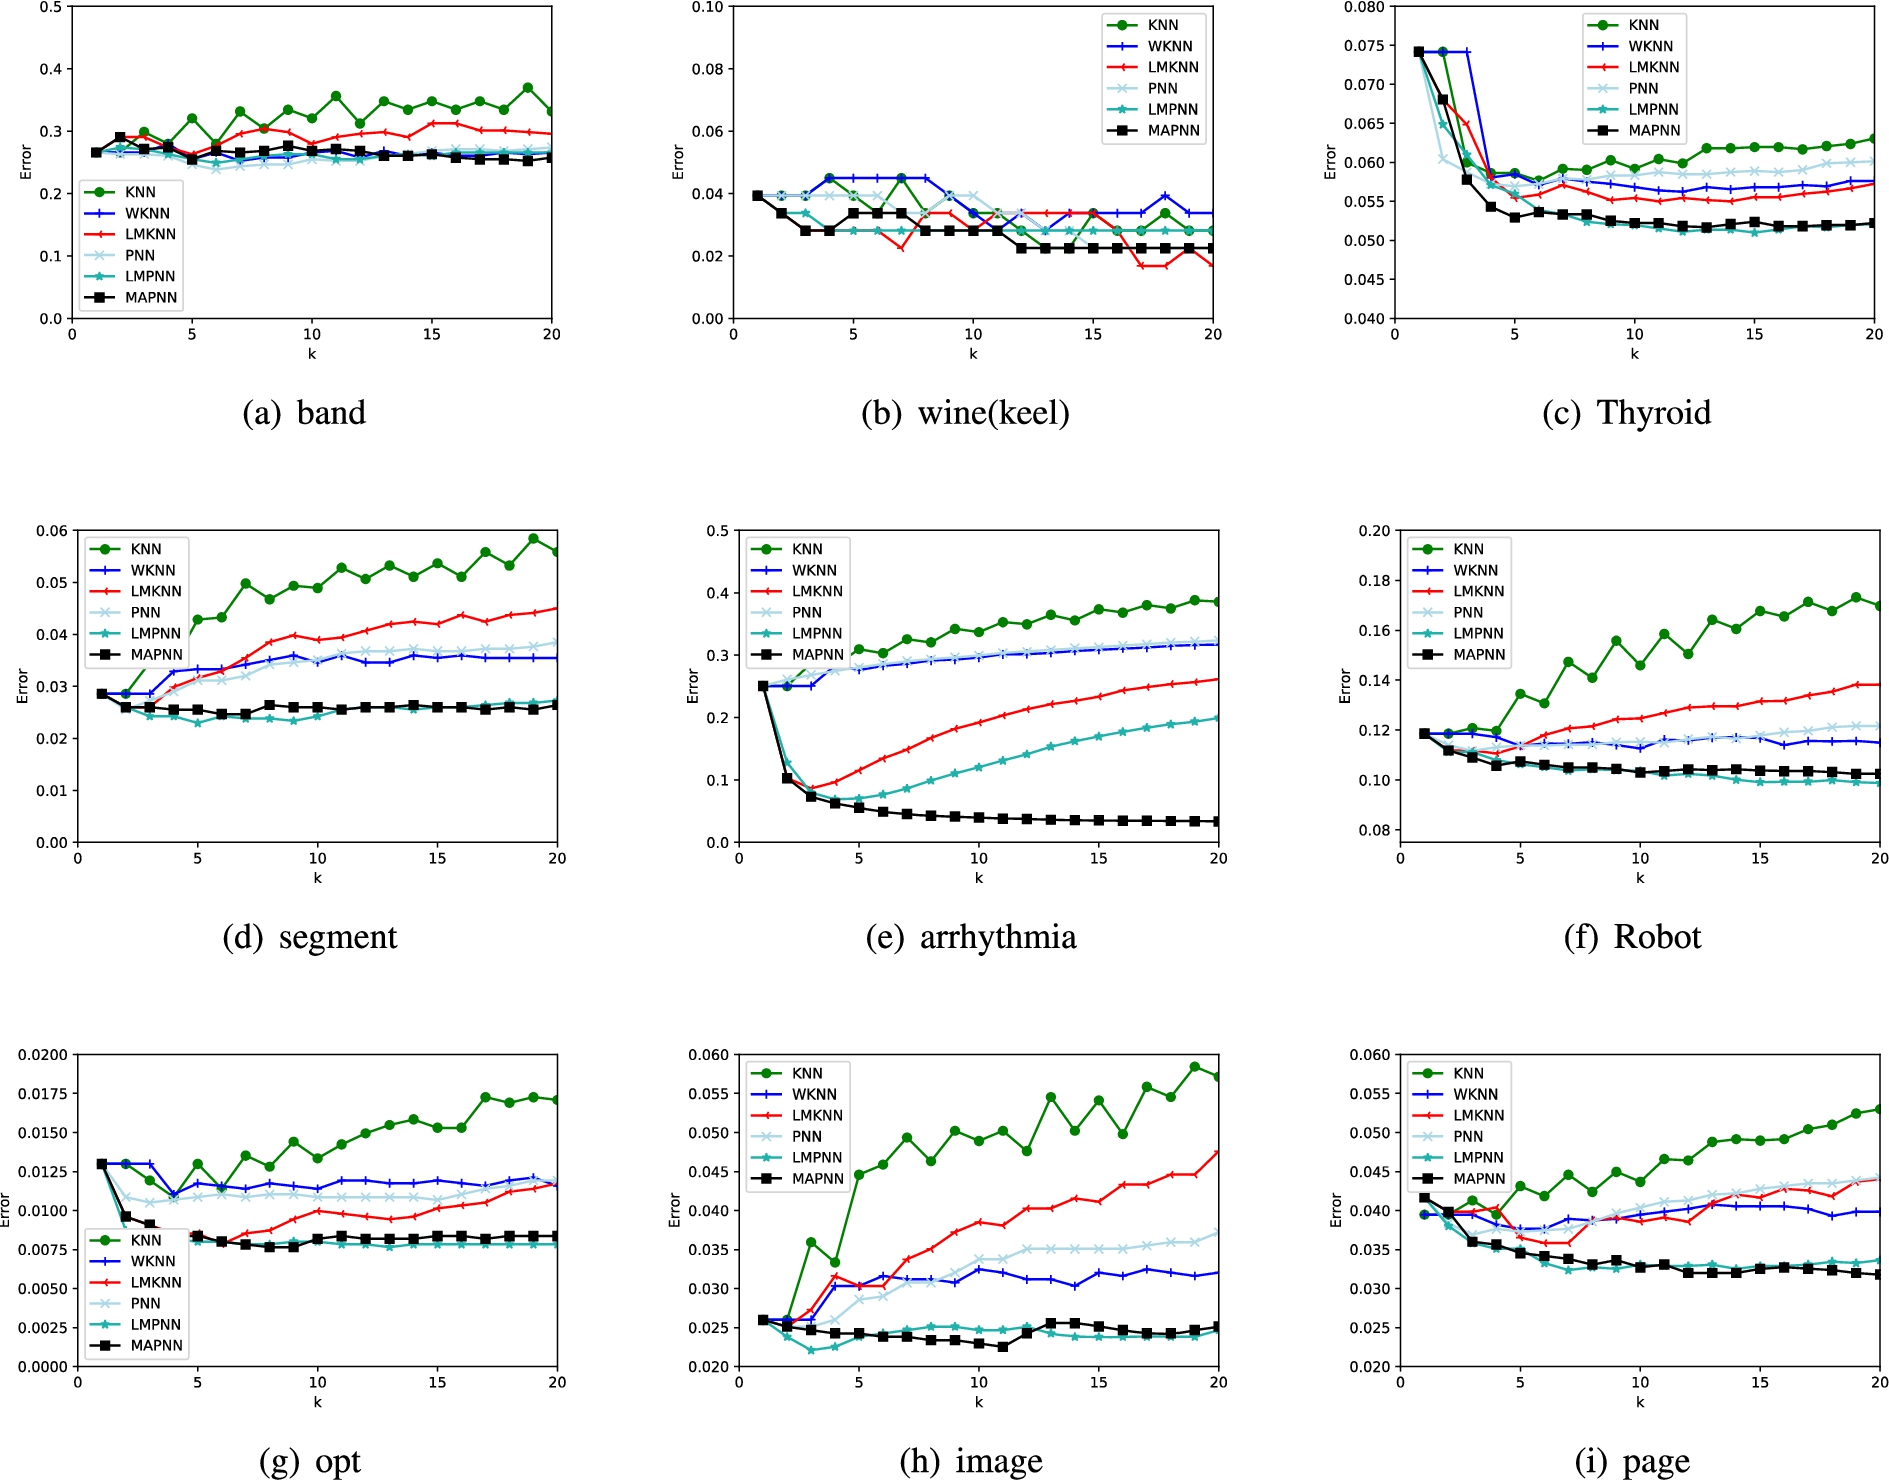
The classification error rates of each method via k on each numerical data set.
In addition to the real data sets, the Gaussian synthesized data sets are used in this experiment. I [25], II [25], I-I [7,25] and Ness [19,20] are adopted in the experiments, the four data sets consists of 8-dimensional Gaussian data. The settings of the four data sets are shown in the following Table 3–6, where
Experiments on the real data sets
The experiments are carried out by 10-fold cross validation. The value of the nearest neighbor parameter k are varied from 1 to 20 with a step of 1. Classification performance is determined by averaging 10 times classification error rate.
The comparison results in terms of classification performance of each classifier by giving the average error rate is shown in Table 7. Note that the best classification results for each data set are shown in bold. It can be observed that the proposed MAPNN method achieves better performance, compared to other five classifiers on the whole. The experimental result illustrates the fact that: 1) MAPNN is effective in the situation of small size samples case, such as Vehicle, Balance, Blood, Ionosphere and seeds. 2) MAPNN rule achieves almost better performance on the whole, compared to other five methods.
To further illustrate the effectiveness of the proposed MAPNN, The experimental comparisons on each real numerical data set at different values of k are displayed in Figs 3 and 4. It can be seen from Figs 3 and 4 that the classification error rate of the proposed MAPNN is lower than other five classification methods in most cases at relatively large values of k, and MAPNN is less sensitive to k.
The experimental results illustrate that the proposed MAPNN method is effective for classification.
However, the comparisons of six classification methods in terms of classification error rates cannot be convincing in statistics. Hence, a nonparametric statistical test called Friedman test [4,5,8] is conducted to compare the differences of the experimental results of the proposed MAPNN method and other five classifiers. The Friedman test ranks the classification results shown in Table 7 of the six classifiers on each data set. Let
The average ranks of six methods using Friedman test on twenty-one real-world datasets
The average ranks of six methods using Friedman test on twenty-one real-world datasets
The classification error rates of each method via k on each synthetic data set.
The Friedman test are adopted to investigate the classification performance of the proposed MAPNN, compared to the other five classification methods. The average ranks of six methods are listed in Table 8 according to the classification results from Table 7. According to Equation (11),
The average error rate of each classifier with the corresponding standard deviations (stds) on the four synthetic data sets
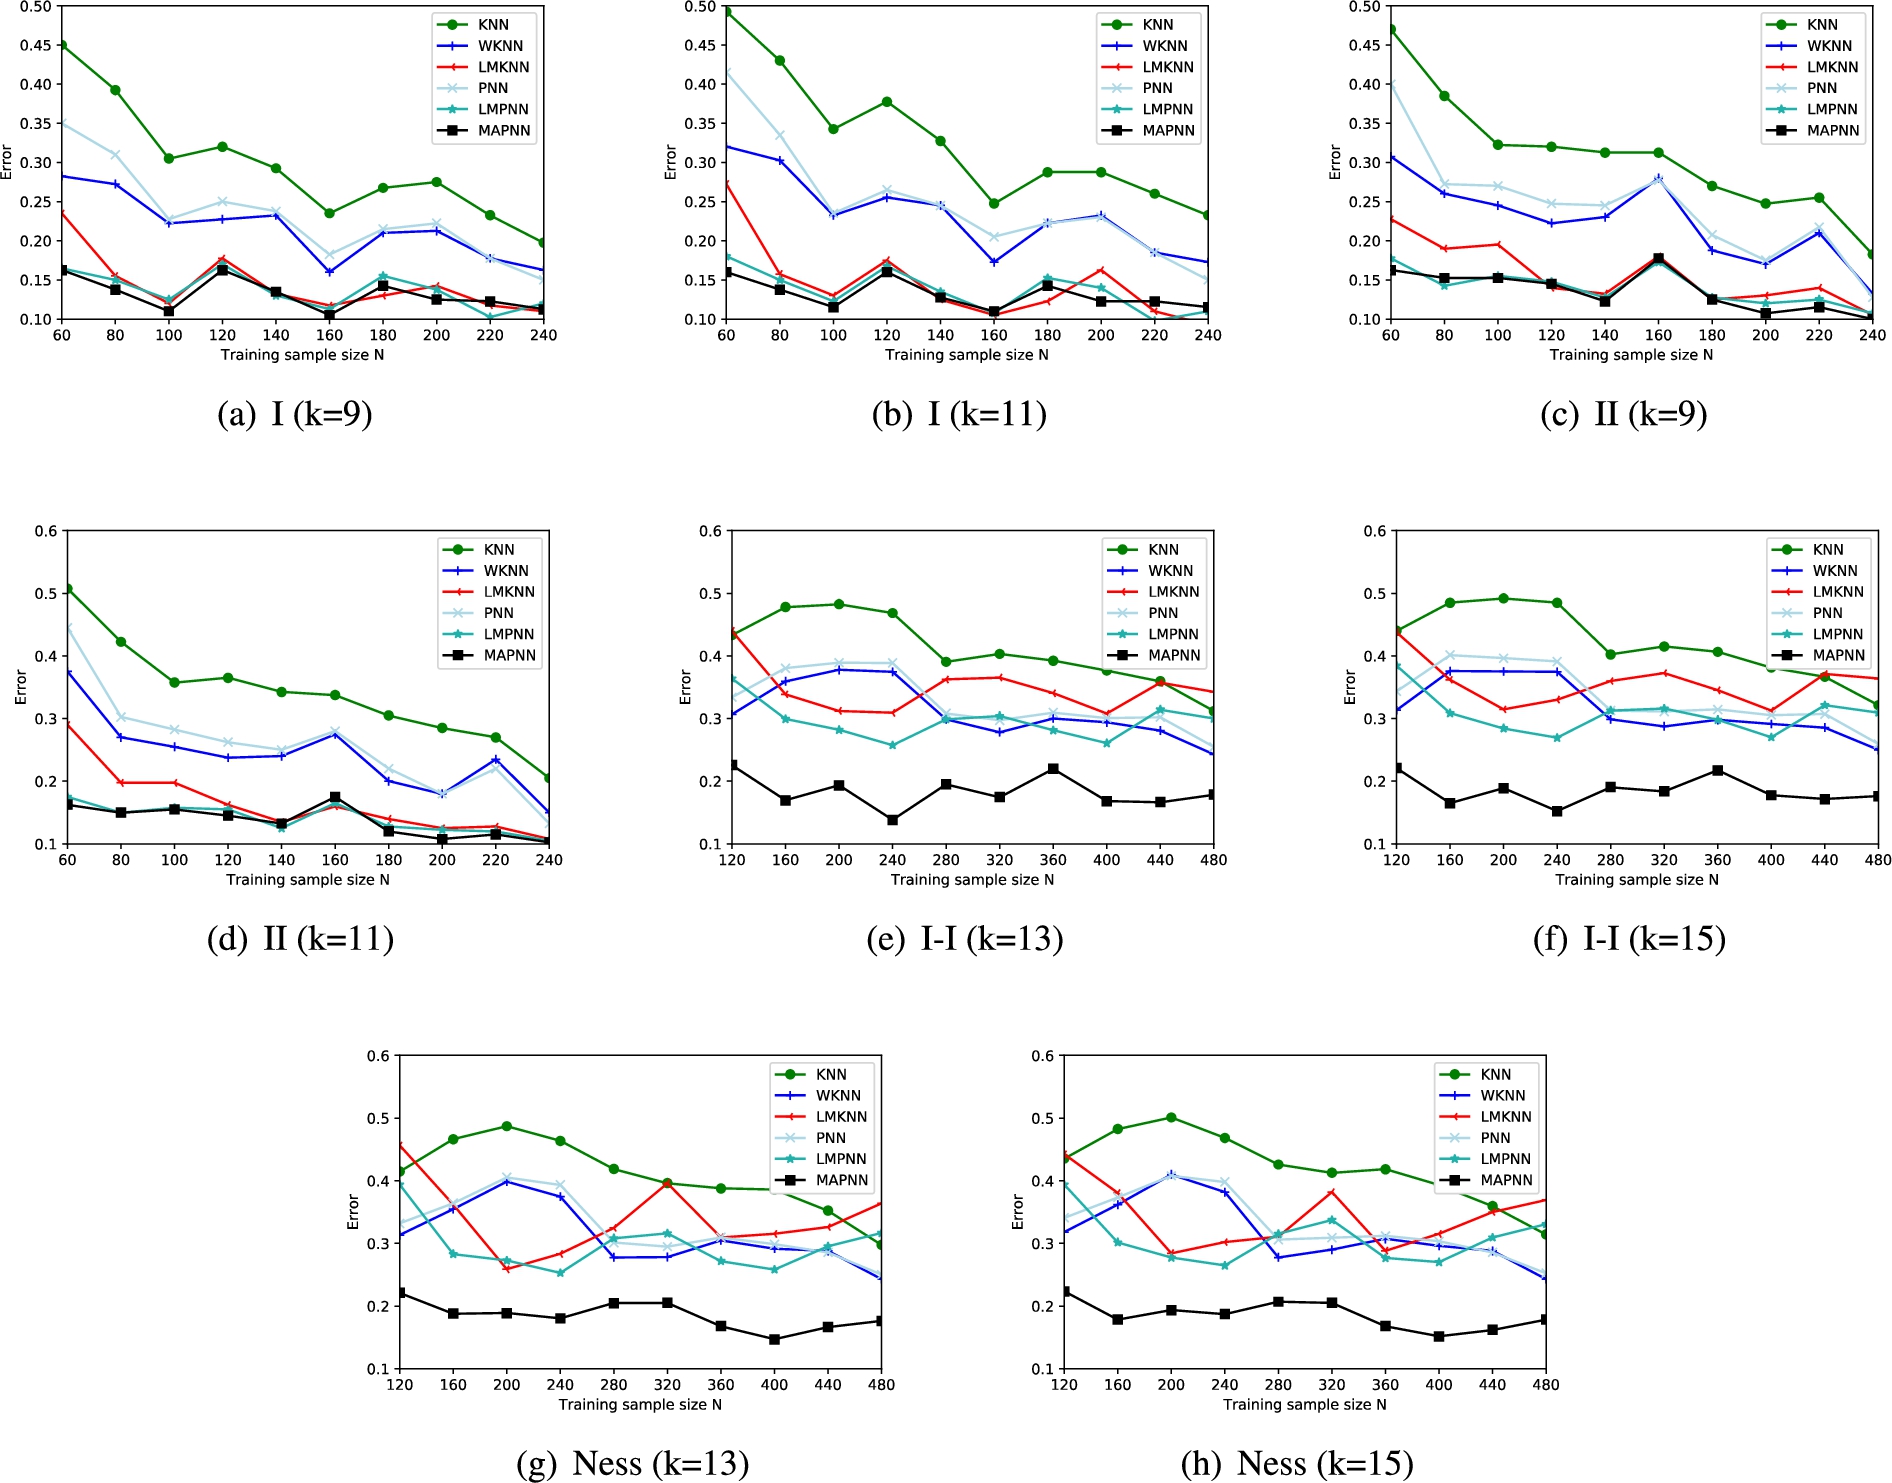
The error rates of MAPNN, KNN, WKNN, LMKNN, PNN and LMPNN with varying the training sample size N on each synthetic data set.
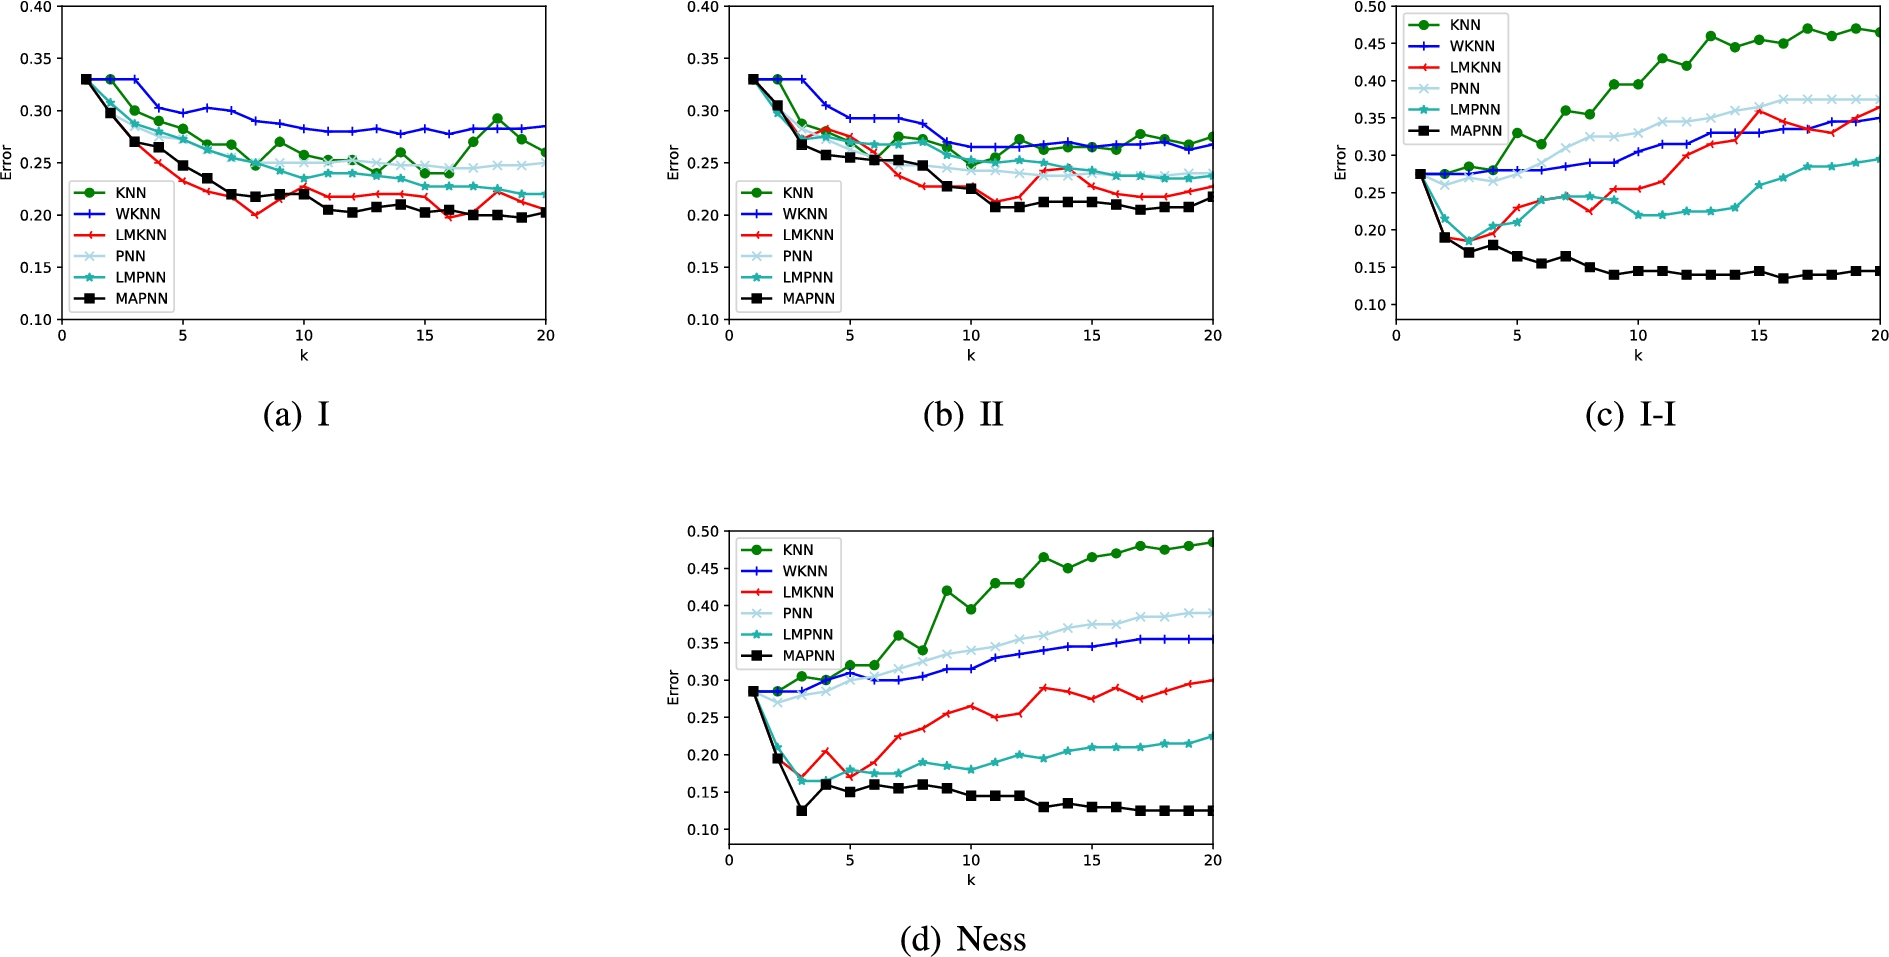
In this section, in order to further verify the performance of the proposed MAPNN, the experiments are conducted on four synthetic data sets in terms of classification error comparing to KNN, WKNN, LMKNN, PNN, LMPNN. The values of k are varied from 1 to 20 with a step of 1. The classification results of each method via k are shown in Fig. 5.
From Fig. 5, it can be seen that the classification error rate of the proposed MAPNN method is mostly lower than other five methods with relatively large values of the neighborhood size k. We can also observe that the error rates of KNN, WKNN, LMKNN, PNN, and LMPNN increase incrementally as the value of k increases on I-I and Ness data sets. Unlike KNN, WKNN, PNN, LMKNN and LMPNN, the error rates of MAPNN decrease initially when the values of k are small, and then tend to be a consistently stable at large values of k on these four artificial data sets. It illustrates that the proposed MAPNN method exhibits stronger robustness over a large interval of k values. The average error rate of six methods are listed in Table 9. The lowest classification error of six methods on each synthetic data set is highlighted in bold-face. It is obvious that the proposed MAPNN method almost has a better classification performance than other five methods.
Furthermore, the experiments on these artificial data sets by adjusting the number of training samples are conducted to verify the classification performance of the proposed MAPNN method. The comparison results are obtained according to classification errors. For I and II data sets, the training samples from 60 to 240 with an interval of 20 are randomly generated, and the number of testing samples is 400. The training sample numbers of I-I and Ness data sets are randomly generated with the number from 120 to 480 with step 40, and the number of the test samples is set as 400. The experimental results are shown in Fig. 6. The neighborhood size k are randomly preset as 11 and 13 on I and II, 13 and 15 on I-I and Ness. From Fig. 6, it can be observed that the classification performance of the proposed MAPNN method is superior to KNN, WKNN, LMKNN, PNN and LMPNN with varying the number of the training samples on the whole. The experimental results demonstrate that MAPNN has good classification performance.
Conclusions
In this paper, a multi-average based pseudo nearest neighbor classifier (MAPNN) is newly proposed to improve the classification performance in the case of small size training samples with outliers.