
Abstract
Automatic human Activity Recognition (AR) is an important process for the provision of context-aware services in smart spaces such as voice-controlled smart homes. This paper presents an on-line Activities of Daily Living (ADL) recognition method for automatic identification within homes in which multiple sensors, actuators and automation equipment coexist, including audio sensors. Three sequence-based models are presented and compared: a Hidden Markov Model (HMM), Conditional Random Fields (CRF) and a sequential Markov Logic Network (MLN). These methods have been tested in two real Smart Homes thanks to experiments involving more than 30 participants. Their results were compared to those of three non-sequential models: a Support Vector Machine (SVM), a Random Forest (RF) and a non-sequential MLN. This comparative study shows that CRF gave the best results for on-line activity recognition from non-visual, audio and home automation sensors.
Keywords
Introduction
Automatic human Activity Recognition (AR) is an important process for human behaviour monitoring but it is also extensively studied for the provision of context-aware services for smart objects (smart-phones, robots…) and smart spaces (smart homes, smart rooms, public spaces…) [20]. Smart Homes in particular have become a topic of increasing interest since they are a promising way to improve the daily life of people with loss of independence (elderly people or people with physical or cognitive disabilities) so that they always keep control over their lives and continue to live independently, to learn and to stay involved in social life. These technologies can also improve the life of the carers (who are often close relatives) by reducing the human and financial burden of such situations [30,57,65,71].
Many projects related to Smart Homes have been supported by national and international research foundations to address the challenges imposed by a growing elderly population such as
Most of the progress made in the AR domain came from the computer vision domain [1]. However, the installation of video cameras in the user’s home is not only raising ethical questions [72], but is also rejected by some of the targeted population [59].2
As for any technology, video cameras can be very well accepted if the benefit is perceived to be higher than the feeling of intrusion.
In home automation sensor based AR, the problem has often been approached using off-line machine learning methods on pre-segmented activity intervals [6,26,54]. In that case the entire information (past, present, future) is considered to be accessible and the detection problem is ignored (i.e. detecting when an activity starts and ends). If such an approach is valid for off-line analyses of human behaviour, many real-world applications will need real-time or at least on-line AR. For instance, context aware systems must know, at the time of the user’s interaction, which activities the user is performing. This task is more difficult than the off-line one as only present and past information can be used and classification must be provided within a reasonable time. Another issue is that the system must deal with activities that are not known a priori to avoid undesirable behaviours.
In this paper, we present an on-line activity recognition method for AR within homes in which multiple sensors, actuators and home automation equipments coexist. This research is carried out as part of the
The integration of audio signals with home automation sensors for AR is an understudied area. This work not only demonstrates the interest of such fusion but also brings the first complete datasets for AR that contain home automation data as well as audio signals with multiple users. These datasets are available to the community [27,80]. Some of them were acquired during experiments in a realistic smart home involving elderly and visually impaired people [76].
The framework for on-line AR makes it possible to summarise asynchronous as well as continuous sampled signals into temporal windows.
The paper introduces a recent model for AR – Markov Logic Network – in both sequential and non-sequential versions. Moreover three sequential and two other non-sequential models for the AR task were tested and compared.
These models were evaluated on the above-mentioned datasets in a realistic way since windows of unknown class are fed to the classifiers. Indeed, in real world setting not all possible activities can be learned thus applications must be able to handle unforeseen situations. Moreover, to avoid overfitting, a cross validation technique was designed so as to exclude from the learning set, the participants’ records used for testing.
The paper is organised as follow. After a short description of the AR classification techniques in Section 2, the framework for on-line AR is detailed in Section 3. In particular this section introduces three sequence based models namely the Hidden Markov Models (HMMs), Conditional Random Fields (CRFs) and finally the Markov Logic Networks (MLNs), a statistical relational method that combines high expressibility (first order logic) with the handling of uncertainty. The methods were tested in two experiments performed in two real Smart Homes involving more than 30 participants. Moreover, their results were compared to those of state of the art non-sequential models such as are Support Vector Machine (SVM) and Random Forests (RF). These experiments and the corresponding results are described in Section 4. The paper ends with a discussion in Section 5 and a short conclusion in Section 6.
In the literature, Activity Recognition (AR) has been defined differently according to the level of granularity under consideration. In some works, for instance, a movement such as standing up, running or walking is considered as an activity [39]. As the activity to be recognized depends on the movement of the body, worn sensors are often used. This can be found in research concerning medical assessment [45] or daily activity interpretation [58]. Some other works consider the variation of a certain task: making tea, coffee, or preparing a meal [56]. In such cases, each activity is a specialization of a general task, and frequently the accuracy of the recognition is related to the number and type of the applied sensors since some subtask can only be recognized by the use of a particular sensor. In some applications of surveillance in public places, activities are considered as interactions among people. For instance, complex activities such as fighting and stealing are identified by means of video recognition techniques [3,47,67].
Besides the level of granularity of the activity, the way to perform the recognition can be divided into off-line and on-line. The former case consists of the analysis of a static set of data [6]. For example, when assessing the health state of a patient in a hospital, the sensor data of a previous time-span can be used to recognize the corresponding activities or to identify a change of behaviour. The advantage of such an analysis is that all temporal relations can be exploited allowing better accuracy since for every instance past and future events are available. In on-line recognition [34,40], the case we focus on, the analysis is done from a data stream while the subject is performing the activity. In this case the aim is to identify as quickly as possible the current activity at a certain instant relying only on past and present information.
Approaches for activity modeling can be divided mainly into two categories: knowledge-driven and data-driven. In the former category, a logic-based approach offers an ideal framework to model explicit knowledge which can be provided by an expert of the domain. Ontologies have been widely used for AR [16] since they provide readability and formal definitions while the inference can be performed by an ontology reasoner as a problem of satisfiability. Moreover, under a description-based approach, logic rules facilitate the implementation of expert knowledge within a model [70]. For instance, Augusto and Nugent [5] used logical models to represent the temporal relations among events to recognise activities. In Artikis et al. [3], Event Calculus (EC) has been used for AR because of its capacity to model complex activity and temporal relations. EC has also been used for behaviour reasoning by Chen et al. [15] in a framework aiming at assisting a person in a smart environment. Though logical approaches are highly expressive, they do not handle uncertainty whereas input data in smart home are highly noisy.
Data-driven approaches can be either unsupervised or supervised. Unsupervised activity recognition is pertinent when it is not required to recognize specific activities; for instance, in applications intended to recognize a change in the daily pattern of the inhabitant. Some relevant works [18,49] have studied methods to discover recurrent patterns, or motifs, from a stream of sensor data; other approaches consider the segmentation and clustering of the data in order to create models that can subsequently label a segment in one of the clusters [24,62].
In the case of supervised learning methods, the AR model is learnt by means of an annotated corpus. In most cases the training corpus is exploited in order to find the best parameters of the model. However the structure of the model can also be inferred automatically, for instance, by the induction of logical rules [4]. Many works have applied statistical methods in order to classify sets of sensor data produced over a short time interval as belonging to a particular activity [11,26]. As information in pervasive environments is uncertain in most cases, probabilistic approaches are suitable candidates to be applied for AR, although they assume a probabilistic independence between consecutive time intervals, which is often a false assumption. One of the most applied methods to include temporal relations in the model is dynamic Bayesian networks [84,86]. Activity recognition has also been treated like a problem of sequence labeling: to label a segment of sensor data into the most probable activity performed. Thus, modeling activities by Hidden Markov Models (HMMs) is extensive [23,52,83]. For instance, Duong et al. [23] extended a conventional HMM to model the duration of an activity, and Naeem et al. [52] defined activities as a composition of tasks modeled by hierarchical HMMs. During recent years, conditional random fields (CRFs) [42] have also been widely applied to AR. In particular, Chieu et al. [17] presented an application of CRFs for AR using physiological data. Nazerfard et al. [54] and Vail et al. [81] showed that CRFs can give better results than HMMs since they do not assume the probabilistic independence of the observation variables. Tong and Chen presented a method using Latent-Dynamic CRF for recognizing activities in smart homes [74].
Recently, Statistical Relational Learning (SRL) [29], a sub domain of machine learning, has gained much attention as it integrates elements of first order logic and probabilistic models. Under the SRL scheme, models are defined in a formal logical language that makes them reusable and easy to verify, that systematically takes uncertainty into account, and that allows easy inclusion of a priori knowledge. SRL has recently attracted attention in the domain of human activity modelling and recognition. For instance, Logic HMMs [38] and relational Markov networks [73] are both SRL methods that were considered for AR [33,46,53,58]. In our work, we applied Markov Logic Networks (MLN) [66], which become Markov networks when their predicates are grounded during the inference process. It is also possible to define a MLN which is equivalent to a dynamic model such as a linear CRF.
Some other researchers have carried out comparative studies on the application of machine learning methods [2,81]. However these works have focused mainly on the properties of the methods that make some of them more appropriate for AR than others. We consider it essential to extend these studies through the analysis of the inherent characteristics of the problems relative to this recognition task, such as the most influential sensor information for AR, or the importance of historical information in this specific task. Moreover, an analysis of state-of-the-art sequential methods compared to non-sequential methods for modelling historical information statically can shed light on the AR problem. Another original aspect of the present work with regard to the state of the art is that our evaluation is done under the assumption of on-line recognition, where future information is not available.
Method

Diagram of the overall methodology for activity model determination.
Our approach for on-line activity recognition from audio and home automation sensors is detailed in this section. In Smart Homes, AR can be performed from a set of very heterogeneous raw data streams of various sensors, such as binary presence detectors (Presence Infra-Red sensors or PIR), continuous microphone signals or temperature measurement. To handle this heterogeneity, the overall strategy we adopted is to summarise data from these sensors within temporal sliding windows to generate vectors of attributes that will feed into an activity classifier. This approach relies on the hypothesis that each instance of any activity is composed of a set of events whose observations are captured by the set of sensors. These observations are signatures of the activities and they can be described by statistics of predefined variables computed over temporal windows shorter than the minimal activity duration. Although activities captured in this manner might be large scale activities, we showed that they can provide sufficient contextual information to an home automation decision module [13].
The method to recognise activities from streams of raw sensor data goes through different levels of abstraction, as depicted in Fig. 1. The raw data are composed of symbolic timestamped values (from, e.g., infra-red sensors), state values (from e.g., switches), irregularly sampled signals (e.g., temperature) and equi-distantly sampled signals (from, e.g., microphones). Some of these data are pre-processed to extract higher-level information such as speech, non-speech sounds and the location of the inhabitant. This step is detailed in Section 3.1. Then, all the raw and inferred information is summarised as vectors of features
This section summarises the pre-processing stage, and details the attributes and the classifier models.
The raw data captured within the Smart Home (see bottom of Fig. 1) are summarised by features computed over a temporal window. This section details the windowing strategy applied and the features computed.
Windowing strategy
In this paper, the aim is to build classification models for on-line processing. In on-line processing, only current and past information is available. This means that, for each current time t, the temporal windows W will cover the interval
Given the dynamic nature of the activities, T must be chosen to be shorter than the minimal duration of an activity instance, but should be long enough to benefit from the past history. A problem with fixed-size windows is that an activity can be under-represented due to the windows boundaries (e.g., an activity covered by half each of two temporal windows). To solve this problem, overlapping of intervals in 0% to 50% of T may be used. In case of the intersection rate α between two consecutive windows then,
Finding the best values for T and α is a tedious task that requires testing each value for classification method on datasets partitioned with different combinations of T and α. In a previous work [11], we tested values for T of 60 and 120 seconds, with values for α of 0, 0.33 and 0.5 and we found that
Localisation and speech/non-speech sound detection
The raw data contains information that must be extracted to enhance activity recognition. Two types of information are considered: speech/non-speech sound event – which are important for activities of communication – and localisation of the inhabitant – which is of primary importance for activity recognition.
Speech/non-speech sound detection In this approach, sound events are detected in real-time by the
Localisation In Smart Homes, localisation can be performed using cheap infra-red sensors detecting human movements but these sensors can lack sensitivity. To improve this, our approach fuses information coming from different data sources, namely infra-red sensors, door contacts and microphones. The data fusion model is composed of a two-level dynamic network [12] whose nodes represent the different location hypotheses and whose edges represent the strength (i.e., certainty) of the relation between nodes. This method has demonstrated a correct localisation rate between 63% and 84% using uncertain data from several sensors.
Computed features
The traces generated from human activities are difficult to generalise, even in a given setting, due to the high inter and intra-person variability of realisations of a same task. This is why statistical attributes and inferred information were chosen to summarise the content of each window.
For all the binary sensors (e.g., infra-red motion detectors, switches), the number of firings in a time frame was computed. For all the contact-door sensors (e.g., doors, windows, furniture, curtains), the number of state changes was computed for each temporal window. For all events for which the duration is important (e.g., speech occurrences), the number of detections and their duration as a percentage of the temporal window were computed. For all signals (CO2 level, temperature, humidity, brightness, water or electricity), the difference of mean value between time frames was computed. Regarding location, the percentage of time of occupation of each room was computed for each time window. Moreover, to add past information, the previous main occupied room is added as a feature. Finally, to account for the level of “activeness”3
In this paper, we distinguish the activity – i.e., the task being performed – from the activeness – i.e., the state of being active. It is also called ‘total agitation’ in the paper from the French agitation equivalent to bustle in English.
Most of the activities under consideration in this study have a sequential pattern (e.g., sleeping implies going to the bedroom, then to lie down on the bed and to make no or infrequent large movements, dressing implies to get clothes and to make movements to put them on, etc.). However, in this windowing approach most of the temporal information within the temporal window is lost. But, given the high variability in the sequence of events for a simple activity even by the same person, we claim that such abstraction is a way to eliminate intra-class variations and noise in order to obtain a better generalization. Moreover, the duration of the windows being short, the hypothesis is that the sequential nature of the activities can be captured through sequence based models. Another advantage of these features is their very low computational cost.
The activities under consideration in the study are inspired by the well known Activities of the Daily Living introduced by Katz [37] which are often used in geriatric assessments (dressing, feeding, toileting, etc.). The chosen activities, slightly different in the two experiments, are detailed in Sections 4.2.1 and 4.2.2. They were chosen mainly to provide contextual information for decision making (e.g., for a voice-based home automation system [13]) but also to provide relevant information about the behaviour of the user.
Another class was also considered in the study: the
Activity modelling by Hidden Markov Model (HMM)
Hidden Markov Models (HMMs) [61] (Fig. 2) are extensively used in activity recognition, for which it has become a “standard” approach [23,52,83]. One use of HMM in AR is to compute the most probable sequence of hidden states

Representation of a classical HMM for labelling elements in a sequence:
Ergodic HMM models are based on two assumptions. The first one, which is true for any HMM, is the conditional independence of the observations. An observation
To model activities, a separate model was trained for each activity. Each hidden state was modelled by a Gaussian Mixture Model. The learning process was consequently carried out for each of the different activities (eating, dressing, etc.). This consisted in estimating the initial probabilities, the parameters of the GMMs (using the EM algorithm), and probabilities of the observations for each state and the state transition matrix. Convergence to the final parameters was obtained via the Baum-Welch algorithm. Finally, models with 2 hidden states and a GMM with 3 Gaussians for each state were obtained.
The AR was then performed by computing the log-likelihood of each of the N activity models with an input vector. We consider that we are handling the data as a datastream, so we also do not try to determine the frontiers of each activity performance. Sequencing the datastream and adapt the model could be part of future works. During these tests, only the current and previous windows were considered. The HMM with the maximum likelihood was retained as the most probable class of the input sequence.
Conditional Random Fields (CRFs) are graph based models to perform discriminative probabilistic inference over a set of variables in classification tasks [42].
Similarly to HMMs, CRFs can classify a sequence of variables

Representation of a CRF for labelling elements in a sequence.
Lafferty et al. [42] defines CRF as follows:
Let
Therefore, the probability of a node is conditioned by its neighbours and by the set of observations. CRFs are generally implemented as log linear models by means of feature functions
When considering a model to label temporal windows as performed activities, having
In our implementation of CRF for activity recognition the evidential variable
A Markov Logic Network (MLN) is a generative statistical relational model that combines First Order Logic (FOL) and probabilistic inference. A MLN model is expressive enough to include explicitly, by means of FOL, the main relations that exist among the elements of the smart environment involved in the activity recognition. In addition, every logical formula is given a numerical weight indicating a degree of truth. This logical representation along with its set of weights can be considered as a meta model that, during the inference process, allows the construction of a Markov network, a pure probabilistic model that can deal with uncertain variables. In this section, we introduce formally the MLN model and our implementations for activity recognition.
A MLN is composed of a set of FOL formulae, each one associated with a weight that expresses a degree of truth. This approach softens the assumption that a logic formula can only be true or false. A formula f is grounded by substituting each variable in f by a constant. A grounded formula that consists of a single predicate is a ground atom. A set of ground atoms is a possible world. All possible worlds in a MLN are true with a certain probability which depends on the number of formulae satisfied and the weights of these formulae. Let’s consider F a set of first-order logic formulae, with
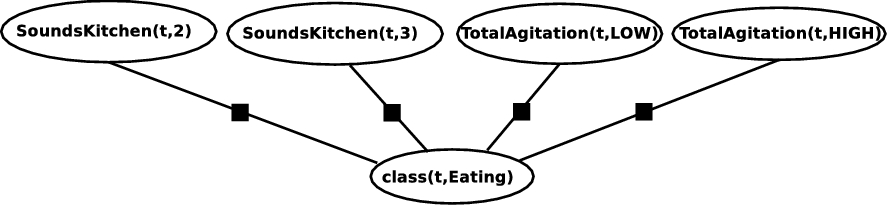
The implementation proposed for Activity Recognition uses a set of rules which models the relationship between each feature and the activity independently from the other features. Formally, if N discrete features are used for classification, the possible values for a feature i is given by the set
The rules used to classify activities have the following structure
The total number of rules in the model is given by
Ground Naive MLN.
In addition, we implemented a dynamic model that represents the activity recognition problem as a stochastic process in time. In this model, we use the same predicates, but the identifiers of the temporal windows become time arguments whose values are positive integers. We also introduce a temporal predicate
The purpose of these rules is to establish a sequential relation between consecutive temporal windows. In the ground Markov network two predicates
The two last methods considered in this study were Support Vector Machines (SVMs) and Random Forests. They are classification algorithms that have been executed on each temporal window independently. These two algorithms have previously been used for activity recognition and have demonstrated good performances (e.g. [21,25,26]).
The processing behind a SVM is to project an input vector into a feature space using a kernel (we choose here a Gaussian kernel, for which we have first to determine the standard deviation σ – the first parameter of the model). From the projected vectors, the learning algorithm determines the best possible separation hyperplane between the individuals of two classes, that is the hyperplane at the largest distance from all the points belonging to each class, called margin. A second parameter, C, controls the trade-off between the size of this margin and the number of possibly misclassified training samples. This algorithm, originally developed by Vapnik et al. [8] has demonstrated a very good efficiency on different kinds of classification tasks.
A Random Forest (RF) [10] is an ensemble classifier composed of several decision trees. For a new input, each decision tree decides a class and a voting strategy is used to determine, among the several trees, which class to attribute to the input vector. The induction of a RF combines random subspaces and bagging. It constructs a decision tree using a randomly selected reduced number of attributes (the number of trees created is a parameter of the algorithm).
For more details about these well known and documented models the reader is referred to the previously cited papers. The description of the determination of each of the parameters is provided in Section 4.3.2.
Experiments and results
The methods were applied on data collected in two Smart Homes during two experiments involving respectively 21 persons and 15 persons. This section describes the Smart Homes (Section 4.1), the data sets (Section 4.2) that were acquired and the attribute selection and model parametrisation (Section 4.3). At the end, the results of the activity recognition are presented in Section 4.4.
Pervasive environments
The Domus Smart Home
The first pervasive environment considered is the
The
The
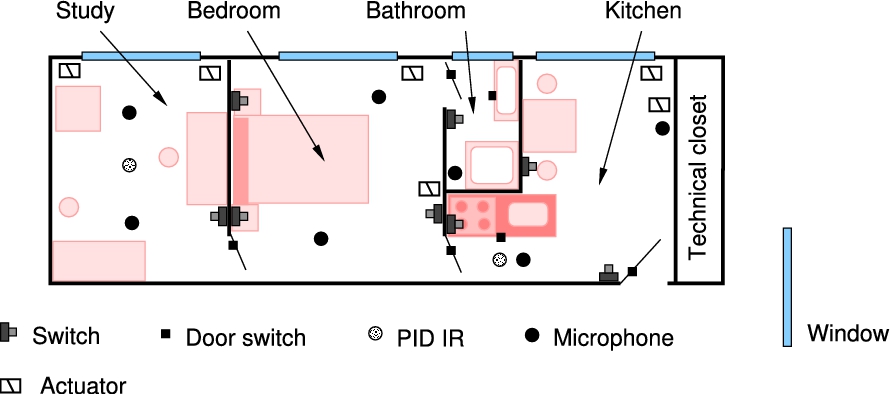
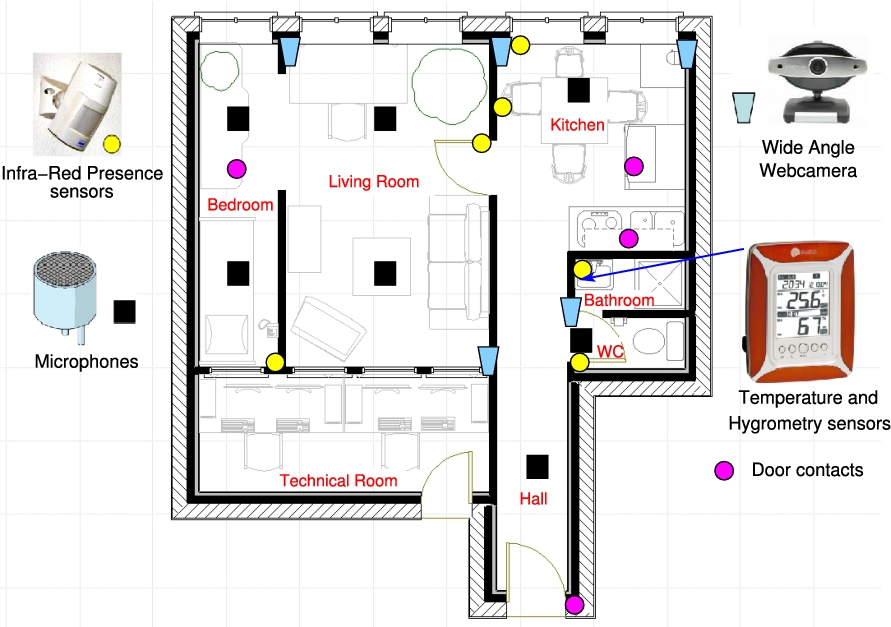
The second Smart Home has been set up inside the Faculty of Medicine of Grenoble by the researchers of the TIMC-IMAG laboratory. This 47 m2-flat is composed of a bedroom, a living-room, a hall, a kitchen (with cupboards, fridge…), a bathroom with a shower and a toilet. It was equipped with: (1) infra-red presence sensors (PIR), placed in each room to sense specific locations in the flat; (2) door contacts for the detection of the use of some of the commodities (fridge, cupboard and chest of drawers); (3) microphones, also in each room, to monitor, record and process all the sounds inside the flat and classify them into sounds of daily living or speech; and (4) large angle webcams (for annotation purposes only).
All the sensors, their location and also the organization of the flat are presented in Fig. 6. The basis of the flat is the wireless presence infra-red (PIR) sensor, used in the AILISA project to monitor the level of activity of the person [44]. The other sensors (i.e. the microphones, webcams, environmental and contact sensors), that have been added to the initial AILISA platform, are optimally distributed to the four computers of the technical room (to optimize both resources and processing time use). This room, next to the Health Smart Home (HIS), contains these computers and electronic devices that receive and store, in real time, the information from the HIS. These computers are from standard ones. Apart from the microphones that need a National Instrument multichannel acquisition board for the analog to digital conversion of the signals from the microphones, the other connections are done with serial or USB ports.
Equipment and layout of the Health Smart Home (HIS) of the TIMC-IMAG Laboratory in Grenoble.
This section details the acquisition and the characteristics of each of the two datasets and the procedures followed to record them before describing the manner they were used in this study. In all cases, cameras were used for video recording in each room for annotation purpose only, except in the toilet and bathroom in which there were no cameras in order to respect privacy.
The multimodal Sweet-Home (SH) dataset
The multimodal
In total, thanks to the 21 participants, more than 26 hours of data have been acquired with an average scenario duration of one hour. About 18 hours were kept for an activity recognition experiment while the remaining time was retained for specific audio analysis. Data were annotated with the 7 classes of activity using the Advene software.4
This corpus is freely available atThe HIS corpus [27] was acquired to monitor the activity of a person living alone at home, with the aim of helping geriatricians to evaluate the dependency level of various elderly people [26]. Seven activities were selected to be classified automatically: Preparing and having a meal, Performing hygiene activities, Dressing and undressing, Sleeping or having a nap, Resting and Communicating with relatives on the phone, and finally the Elimination activity (the fact to be in the toilet and using it). Each person was asked to perform the different activities for as long as they wanted and as often as they wanted. They were only instructed of the different activities to perform but not of the order in which to do them or of the way to perform them. The activities were performed by 15 healthy and non-elderly subjects (six women and nine men).
In total, about 13 hours of data have been acquired in the HIS flat. The average age of participants was 31.9 ± 9.0 years (min 24, max 57), the average height 1.74 ± 0.11 m (min 1.62, max 1.92), and the average weight 68.5 ± 9.11 kg (min 50, max 81). The mean execution time of each experiment was 51 min 40 s for a single participant (min 23 min 11 s, max 1 h 35 min 44 s). This corpus is freely available at
Implementation for evaluation purpose
From the raw data recorded by the different sensors of the flat, a vector V of attributes was extracted for each temporal window as described in Section 3.1. The duration T of the window W was set to 60 s. The attributes were inferred or computed from the different signals. This resulted in an attribute vector V of 94 elements in the case of the SH dataset and of 26 elements in the case of the HIS corpus.
Tables 1 and 2 present the distribution of the activity classes for 60 second frames for the SH corpus and the HIS corpus. The first column represents the activity classes, the second column shows the percentage of data that has been put apart for preprocessing and tuning, the third column is the percentage of data used for training and testing the activity classification models and the last column presents the total. For SH, the preprocessing and tuning set was composed of the data from participants 8, 10, 11, 13, 14, 15 while for HIS it consisted of data from the last four participants.
Distribution of time windows for each activity in each SH dataset part (
)
Distribution of time windows for each activity in each SH dataset part (
Distribution of time windows for each activity in each HIS dataset part (
The distribution of classes is unbalanced due to the natural differences in the duration of each daily activity and to the fact that the scenarios were different in the HIS and SH cases. For each experiment, participants were recruited to play a scenario in one of the two smart homes but the scenarios were different. The following section details attribute selection and model parametrisation.
This section details the pre-processing that has been applied to reduce the set of attributes and to tune the classification algorithms. The intervals that were not identified as one of the 7 specified activities were considered as belonging to the
Attribute selection
Performing attribute selection is a necessary step in data mining both to reduce the size of the data and to improve performance [50]. Moreover, for some of our algorithms, the number of features is important and its reduction is crucial for two reasons: (1) the speed of both training and testing can grow exponentially with the number of features and (2) the curse of high dimensionality makes difficult to interpret differences in distances in high dimensional spaces.
Information Gain Ratio (IGR) has been chosen for feature selection because it usually performs well in practice [50] and because it is independent of the classification model (by contrast with wrapping attribute selection methods [68]). IGR is the basis criterion of some decision tree algorithms (e.g., C4.5 [60]) which progress by selecting the best attributes at each decision step from the remaining set of attributes. Recall that information gain is defined considering the entropy and the probability of each values for this attribute currently under consideration. The entropy
The formula (4) is applied to each attribute to obtain the score, then a threshold can be chosen to retain the k best attributes.
The computation of the IGR is done on the complete dataset across classes. This gain is determined for each attribute and each class and for each attribute a weighted mean is computed to obtain its final value.
At the end, only those features with non-zero IGR (features including some information) were retained.
Attributes selected for the SH dataset using Information Gain Ratio for each attribute (66 attributes out of 94). The best 20 attributes are highlighted
Attributes selected for the SH dataset using Information Gain Ratio for each attribute (66 attributes out of 94). The best 20 attributes are highlighted
SH dataset The feature selection method was applied to the multimodal
Table 3 shows the 66 obtained attributes. In that case, only the attributes that have a non-null information gain were kept. In this table, the 20 attributes having the highest IGR scores are highlighted. It suggests that among the selected attributes those that provide the best information to classify activities are the attributes related to the location of the inhabitant and the acoustic features.
HIS dataset Following the same method as for the SH dataset, the HIS corpus, with data vectors originally composed of 27 features (26 plus the class) was reduced to 24 attributes with IGR. For this dataset, the number of features originally available was really small. That explains why only a few attributes were eliminated by the attribute selection process.
Table 4 sums up the reduced dataset.
Attributes selected for HIS using retained non-zero Information Gain Ratio for each attribute (24 attributes out of 26)
HMM, SVM and random forest tuning A 10-fold cross-validation on each tuning set was performed to optimize several parameters of the classifiers. For the Random Forest, the number of trees has been optimized, for the SVM, the pair
CRF and MLN tuning The feature functions designed for the CRF model consider the evidential information of the current temporal window and also the two previous ones. We found that using the two previous windows instead of only one, slightly improves the accuracy of the algorithm while keeping an acceptable processing time.
In the cases of the MLN and the CRF, all the continuous numerical variables were discretised. A supervised method for discretisation, CAIM (Class-Attribute Interdependence Maximization) [41], has been run on the tuning set. It resulted in a set of discretisation intervals for each continuous attribute that were applied as a preprocessing stage to the input data of the CRF and the MLN. This algorithm works individually on each feature without the need to fix the number of discrete intervals as parameter. CAIM’s optimization goal is to maximize the class-attribute interdependence while minimizing the number of intervals. The number of intervals found in the datasets was always between 3 and 8. Once again, only the tuning set was used to avoid overfitting.
Results
Overall accuracy (%) results on the two datasets with and without the Unknown class
Overall accuracy (%) results on the two datasets with and without the
The method used to evaluate the classifier was based on Cross-Validation but used a specific type namely Leave-One-Subject-Out-Cross-Validation (LOSOCV). If the dataset is composed of records5
Here ‘record’ means the full record for a single participant.
Performance was assessed using the accuracy measure over the full dataset, defined as:
In all the results presented in the Tables 6–9, the overall accuracy is given as well as the mean accuracy and standard deviation, computed over the participants, in brackets.
As presented in Section 3.1.2, two kinds of information were inferred from the raw data: location of the dweller and speech/non-speech sound events.
We adapted a dynamic network for multisource fusion with the aim of locating a participant in the smart home [12]. This process contains two levels: the first corresponds to generating location hypotheses from an event; and the second represents the context for which the activation indicates the most probable location given the previous events. Training was achieved separately on the two tuning sets, SH and HIS datasets (cf. Section 4.2) and gave 84% correct location for each 1 second windows of the Train-Test set of SH and 96% correct with HIS dataset. Thus, though the accuracy is acceptable for SH and excellent for HIS, the activity models are trained on imperfect data that may impact on the learning.
As far as sound processing is concerned, the discrimination module was a Gaussian Mixture Model (GMM) which classified each audio event as either an everyday life sound or a speech sound. The discrimination module was trained with an everyday life sound corpus [36] and with the Normal/Distress speech corpus recorded in our laboratory [79]. Acoustic features were Linear-Frequency Cepstral Coefficients (LFCC) with 16 filter banks and the classifier was made of 24 Gaussian models. Acoustic features were computed for every frame using a size of 16 ms, with an overlap of 50%. On the HIS Train-Test set, the global accuracy of the speech discrimination was 84.61%. 25% of the sounds classified as speech were actually “non-speech sounds” and 13% of the sounds classified as non-speech were actually “speech-sounds”. So the classifier is again imperfect regarding speech/non-speech sound related features.
Global results
Table 5 shows the overall accuracy results for all the classification models and datasets both with and without including the
It can be observed that the CRF approach has the highest accuracy in 3 out of 4 conditions but the HMM approach shows the best accuracy for the HIS without including the
Classification accuracy using the SH dataset without Unknown class: overall (per participant record
)
Classification accuracy using the SH dataset without
Classification accuracy using the SH dataset: overall (per participant record
Detailed results per class both without and with the
When the
Results on HIS dataset
Detailed results per class both without and with the
Classification accuracy using the HIS dataset without Unknown class: overall (per participant record
)
Classification accuracy using the HIS dataset without
Classification accuracy using the HIS dataset: overall (per participant record
When the
Some classes were more difficult to discriminate between than others, Tables 10 and 116
In these tables are also given sensitivity and specificity. As a reminder, let’s consider
Confusion Matrix for CRF – SH dataset
Confusion Matrix for CRF – HIS corpus
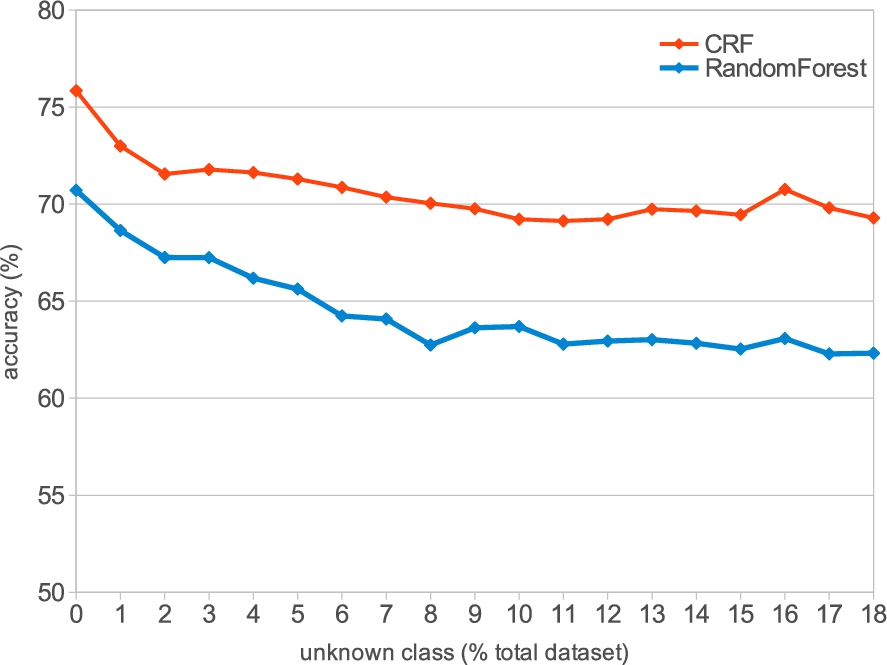
Accuracy against percentage of windows belonging to the
To assess the impact of including the
Discussion
Automatic recognition of human activities in smart spaces is an important challenge for Ambient Assisted Living (AAL). In real-world applications, this task would often have to be performed on-line using data from cheap, distant and noisy home automation sensors. In this paper, we present a study to recognize on-line the activities of one dweller from distant (i.e., not worn on the user’s body) home automation sensors (not including any video camera) and microphones using 6 different models: a SVM, Random Forest, dynamic/non-dynamic Markov Logic Networks, a M and CRF. This study, performed on 2 realistic and publicly available datasets, sheds light on the limitations and advantages of these models for the activity recognition tasks which are discussed below.
To achieve the on-line real-time classification requirement of the study, the sequential models (HMM, CRF and MLN) were only learned and applied using the past history, meaning that no future data are known at the time of making the decision. Moreover, on-line and realistic activity recognition in the home must deal with
The results of this study shows that the sequential models, as a group (HMM, MLN, CRF), do not significantly outperform the non-sequential models (SVM, Random Forest). This can be explained by two reasons. Firstly, AR is highly dependent on the location, the presence of this information alone in the temporal windows is important enough to allow accuracy classification in instance-based models. Secondly, the design of the features for classification in our method allows the inclusion of historical information in the temporal window. For instance, the time the person has spent in the same room is accumulative from one window to the next one, as long as the person does not change location. However, it must be emphasized that a sequential model is always ranked first in all conditions (CRF three times, HMM once). It can then be concluded that CRF is generally the best suited algorithm for on-line human activity recognition from simple non visual sensors, as it consistently outperforms its best non-sequential competitor, namely the Random Forest (RF). While a CRF has already been reported as outperforming a HMM in human activity classification tasks [81,82], the competition between CRF and RF has not been previously reported, mostly because these models do not belong to the same type.
The difference in performance between CRF and the HMM/MLN is due to their discriminative or generative natures. While a CRF is trained to maximize the likelihood over the whole dataset, the HMM/MLN are trained by maximizing the likelihood of each class independently. Thus, a CRF biases its learning towards the most dominant classes, as do the non-sequential discriminative schemes (SVM, Random Forest, Naïve MLN). On the contrary, the MLN and HMM model the classes independently, and this explains why they performed better on some activities. For instance, MLN had the best performance for recognizing the phone activity for 3 out of 4 conditions (cf. Tables 6–9), while the HMM showed the best general performance by class for the HIS dataset (cf. Tables 8 and 9).
The inclusion of the
The two datasets used in this study, though being of the same nature and comparable, were not acquired with the same participants or in the same smart home. But the most prominent difference between them is the amount of information each of them provides. The HIS dataset is far less informative than the multimodal HIS dataset:
where the head of each rule
Regarding speech/non-speech audio information, the results of the feature selection performed on both datasets during the tuning phase suggested that the most important features for activity recognition were those related to the location of the inhabitant followed by those related to speech/non-speech sound occurrences. This can also explain the role of acoustic information on the final accuracy. Even when the most important aspect was the location of the inhabitant since all the activities were performed in at most two rooms, it was also difficult to disambiguate two different activities that took place in the same room. The total agitation in a room, which was highly dependent on the number of sound events, was helpful to differentiate between eating and cleaning, both performed in the kitchen. In this particular case, the agitation produced by room doors and windows were very similar, however it was the number of sounds which helped classifiers to differentiate the activities. Likewise, reading and communication, when both performed in the study, had similar settings on door contacts and light states, but the number of speech events detected was informative enough for good classification. Also, in the MLN model, the weights of the rules relating acoustic information to some activities were large when the association was relevant, as in the following examples:
In this example, the first rule indicates that an eating activity is unlikely to generate a low amount of sound. The second rule expresses the fact that a reading activity is likely to generate a low amount of sound while the third rule shows that a phoning activity is expected to generate many sound events. These rules are further evidence that audio information is important for activity recognition.
Conclusion and future work
The study presented in this paper brings the following contributions:
The paper presents a complete framework for on-line AR, making it possible to summarise asynchronous as well as continuous sampled signals into temporal windows.
This framework has been evaluated on two smart home datasets, available to the community [27,80], integrating acoustic information, a kind of information which has been rarely included in previous studies of the domain. This evaluation shows the interest of these acoustic features for AR since they relate to the agitation level of the occupants (noise) as well as their social interactions (speech).
The AR task in the framework has been implemented with different sequential and instance-based models. This includes a recent model for AR – the Markov Logic Network – in both sequential and non-sequential versions. The evaluation exhibited strengths and weaknesses of each of the models for the AR task.
The models were evaluated on the datasets mentioned above in an realistic way since windows of unknown class are fed to the classifiers. Moreover, to avoid overfitting, a cross-validation technique was designed so as to exclude from the learning set one of the participant records used for testing.
Overall, Conditional Random Fields (CRF) are very competitive for on-line activity recognition from non-visual, audio and home automation sensors. Even though non-sequential models such as Random Forests show good performance on some datasets, the CRF approach is more robust to the presence of activities of
Although the CRF has the best performance overall, generative models such as the HMM and the MLN also perform well. These models show interesting features as they are able to model each class independently, and thus do not bias their learning towards the largest class. Moreover, the Markov Logic Network approach (MLN) is a statistical-relational model, and so its logical structure could be learned in conjunction with a priori knowledge provided by expert rules, so that the model can benefit from highly expressive previous knowledge whilst also being able to handle uncertainty.
The results presented in this study are based on two different datasets that have not been acquired in the same environment and that work with different sensors. Although the datasets are different in terms of activities considered, sensors and quantity of data, it has been shown that the trend in the results from the two sets are similar.
Finally, it has to be noted that, for some of the results, the standard deviation show a huge variability between subjects. Some of the activities were represented with few samples and the difference between subjects is then more predominant. For future models, a generic model that adapts to a participant with the first samples would be a very good direction of research.
We plan to extend our work in two directions. On the one hand, we would like to compare a window-based approach, which loses semantics and temporality but summarises the data well, against an event/state-based approach, which keeps semantic and time information but necessitates the use of even more robust models to handle errors in the data stream. It would be interesting to study the behaviour of the CRF and MLN approaches in these two cases. On the other hand, one of the main problems in human activity learning is the lack of annotated data. Indeed, in-lab recording of scenarios allow an accurate annotation with many participants, but it is not the case for real-world data. Field experiments in real homes do provide more realistic data but annotation is often performed by the participants themselves and cannot easily be verified [7]. Moreover, it is difficult to recruit participants who would be willing to have surveillance technology set up in their own home for experimental purposes. Besides, collecting real-world data is highly expensive in terms of time and resources. This is why we intend to use learning methods that either deal with partially labelled data [75] or use a Universal Background Model [64] so that a large amount of data, of which only a small portion is annotated, can be used for classification.
Footnotes
Acknowledgements
This work is a par of the