
Abstract
One in three elders over the age of 65 falls each year in the United States. This paper describes a non-invasive fall detection system based on a Doppler radar sensor. The developed system has been tested in two environments: laboratory and real senior living apartments. While some laboratory results appeared in our previous papers, the main novelty of this paper consists in the deployment of our fall detection system in six apartments from TigerPlace (a senior living facility in Columbia, Missouri). The fall detection results obtained in our laboratory were excellent, with the radar placed on the ceiling performing better than on the floor. The fall detection system was then evaluated using radar data collected over two weeks in six TigerPlace apartments. The fall detection system successfully detected all six natural senior falls in an apartment for the examined one week.
Introduction
Falls are the dominant reason for accidental death in population above age 65 [25]. Moreover, the death rate caused by falling is increasing in the past decade as more Americans live longer and more independent lives [34]. While prevention is desirable, falls still occur due to the limited success of prediction algorithms and intervention strategies [31]. After an injurious fall occurs, it is important that medical intervention follows as soon as possible in order to reduce long term consequences [15,24]. This paper describes a Doppler radar automatic fall detection system that could be used to alert the nursing personnel as soon as a fall happened.
Recently, many fall monitoring devices have been described in the literature. They can be divided into two categories: wearable and non-wearable. Wearable devices, such as accelerometers, gyroscopes [13] or “push-buttons”, are suitable for active elders but are less appropriate for less active or cognitively impaired ones [10]. Moreover, wearable devices are not suitable for night time or shower use [26]. Conversely, non-wearable devices such as floor vibration sensors [4,5,39], video cameras [6], passive infrared sensor [33,39], microphone arrays [18,27,28], and sensor networks [9,36] are more appropriate for less active elders and night-time use. In assistive living and ambient intelligence applications [7,8,29], each non-wearable device has its own advantages and disadvantages. Aside from privacy preserving, Doppler radars have advantages, such as independence on lighting conditions, inexpensive, non-invasive, sensing through occlusions, and deployable in bathrooms.
Based on the idea that different human body parts produce specific radar signatures, different types of radar sensors could recognize various human activities, such as continuous-wave (CW) radar for gait analysis [12], two-element receiver array for running, walking, and standing [17], M-sequence-based ultra-wideband sensor network for vitality monitoring [32]. We note that none of the above radars are deployed in a real life setting collecting realistic data. There are two main categories of Doppler signature representation methods. The methods in the first category are based on the pattern extracted from the spectrogram. Kim et al. [17] extracts six features from a filtered spectrogram: torso Doppler frequency, total bandwidth (BW), offset of the total Doppler, BW without micro-Dopplers, the normalized standard deviation (STD) of the signal strength, and the period of the limb motion. Wu et al. [37] applies image segmentation and morphological operations using the spectrogram as a binary image. The maximum/minimum frequency and time values generate three features: extreme frequency magnitude, extreme frequency ratio, and the time span of the event. In the second category, the features are derived from sound processing techniques due to the fact that sound waves and radar waves share similar characteristics in frequency changes. The sound wave frequency changes when the listener moves toward or away from the source [14]. An example of this kind of feature is represented by the mel-frequency cepstral coefficients (MFCCs) [16,20–22,38]. This approach is supported by the fact that human operators can differentiate certain targets by listening to the audio output of the surveillance Doppler radar [16].
In a related project, we used floor radars to compute gait velocity and stride duration to estimate the fall risk [38]. Inspired by this system, we proposed the idea of an automatic fall detection system based on Doppler radar signatures and presented preliminary laboratory results in [22]. In subsequent work [20,21], we proposed a two radar sensor system together with a decision-level fuzzy fusion method for integrating multiple information sources [21]. We examined the system performance in our laboratory for various sensor positions and fall directions because only the radial velocity (i.e. collinear to the beam) component of the moving subject can be detected by a Doppler radar [20]. We concluded that for sensors positioned on the floor, the detection of a fall lateral to the radar is not as good as a fall towards or away from it. At the same time, sensors installed on the ceiling are less sensitive to falling direction, since there will always be a downward (away from the radar) component of the radar signal.
In this paper we introduce two new refinements to our radar processing algorithm, one related to feature alignment and another needed for online fall detection. The developed algorithms were tuned first in our laboratory and then were evaluated in TigerPlace, a senior living facility in Columbia, MO [31]. Unlike other fall detection systems that are only evaluated in artificial environments [11], the main novelty of this paper is that it evaluates a Doppler radar fall detection system in a real living environment. A real living environment poses many challenges for fall detection such as antenna configuration, room size, furniture occlusions and movement, building materials, pets and visitors.
The context of our research is a parent study for addressing falls in elderly with a two-fold aim: to monitor gait for fall risk [10] and to develop methods for fall detection using Doppler radar. Radar sensors were first deployed on the floor for optimal gait detection. Although we previously showed that a ceiling placement is better than a floor one for fall detection [20], TigerPlace fall experiments presented here were performed with both of the floor radars due to our emphasis on fall prevention using gait evaluation, and ceiling radar for better performance in detecting natural falls.
This paper is organized as follows. Section 2 introduces the system overview. Section 3 describes the methods and algorithms. Section 4 provides the data collection and evaluation. Section 5 presents the experimental results. More details about the results are discussed in Section 6. We draw conclusions in Section 7.
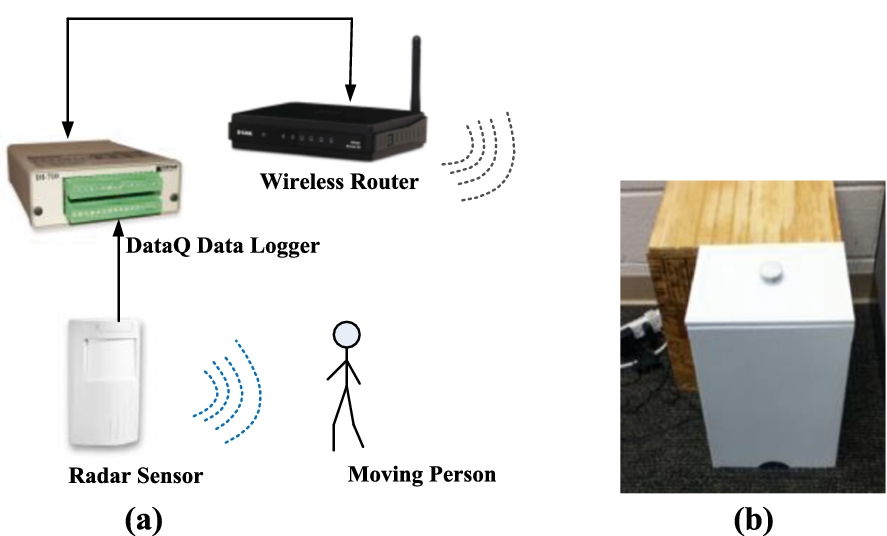
Radar sensor hardware setup. (a) Schematic view. (b) Floor sensor 0.42 m × 0.32 m × 0.23 m deployment box.
The fall detection system is composed of a Doppler radar sensor, and the related signal processing and pattern recognition algorithms.

Block diagram for the processing procedure to detect a fall.
We used a commercial GE range controlled Doppler radar (RCR) as in [20–22] with a center frequency of 5.8 GHz and a target velocity between 0.15 and 1.5 m/s. The range of the radar is set to 6 meters with a 90° viewing angle. Figure 1(a) shows the diagram of the hardware setup. We use a wireless router to transmit and store the sensor data from RCR to the apartment computer using a DI-710 DataQ (www.dataq.com) data logger. The data are then transferred from each apartment computer to a central server for further processing.
We used a 0.42 m × 0.32 m × 0.23 m wood box to deploy the RCR and its auxiliary equipment such as power supply, data acquisition board, and wireless router (see Fig. 1(b)). The RCR was mounted on a bracket inside the box at a height of 10 cm from the bottom. The data logger was mounted on the top of the RCR and the wireless router was placed on top of the DataQ. The signal and power supply wires are placed outside of the RCR range. The floor RCR surface is wrapped by foil with a slot to exclude potential false alarm sources, such as possible electronic fields formed by electric motors or high voltage equipment, and moving or vibrating objects, such as fans, pulleys and conveyor belts.
For ceiling RCR, we did not use the slotted foil in order to allow for a wider view range. In the laboratory tests, we placed the RCR on the ceiling of the laboratory at the room center (about 3.5 m high). In the apartment, we fixed the RCR in a wooden bracket in the attic, above the ceiling dry wall, at the living room center facing down to the floor. All the RCRs were carefully calibrated to obtain a clear signal before installation.
In order to assess the timing of the fall and to investigate the types of false alarms detected in each apartment by the fall detection system, we used a depth camera (Kinect). The Kinect camera was installed in the living room, above the entrance door.
The block diagram of the fall detection algorithm is displayed in Fig. 2. After the temporal position of a potential fall is identified, features are extracted in a two second window around it. Then, mel-frequency cepstral coefficients (MFCC) features are computed and aligned with similar feature vectors from the training set. The feature alignment procedure makes the fall detection algorithm more resilient to the fall location in the temporal window. Finally, a classifier is used to determine whether or not the feature vector represents a fall. A detailed description of each block in Fig. 2 is given in the following Section 3.
Potential fall segmentation
A typical time domain radar signal waveform segment in time domain with two falls is shown in Fig. 3. Two second windows around each fall are marked by dotted lines.
The fall location procedure is based on finding the energy burst peaks in the spectrogram. To compute the spectrogram of the radar signal
The spectrogram is defined as the magnitude of squared of STFT as:
The spectrogram of the time domain radar signal from Fig. 3 is shown in Fig. 4.

A typical time domain radar signal waveform segment including two falls (the signal waveform measured along time). Each fall is labeled with a 2-s green dotted window.
To identify falls using the spectrogram shown in Fig. 4, we compute the spectral energy burst (EB) by summing the energy in the [A, B] Hz frequency range as:

Spectrogram of the signal waveform from Fig. 3. The non-negative frequencies are only displayed because the negative frequency STFT values are complex-conjugates of the positive frequency values. So the magnitudes-squared are identical to their positive counterparts.
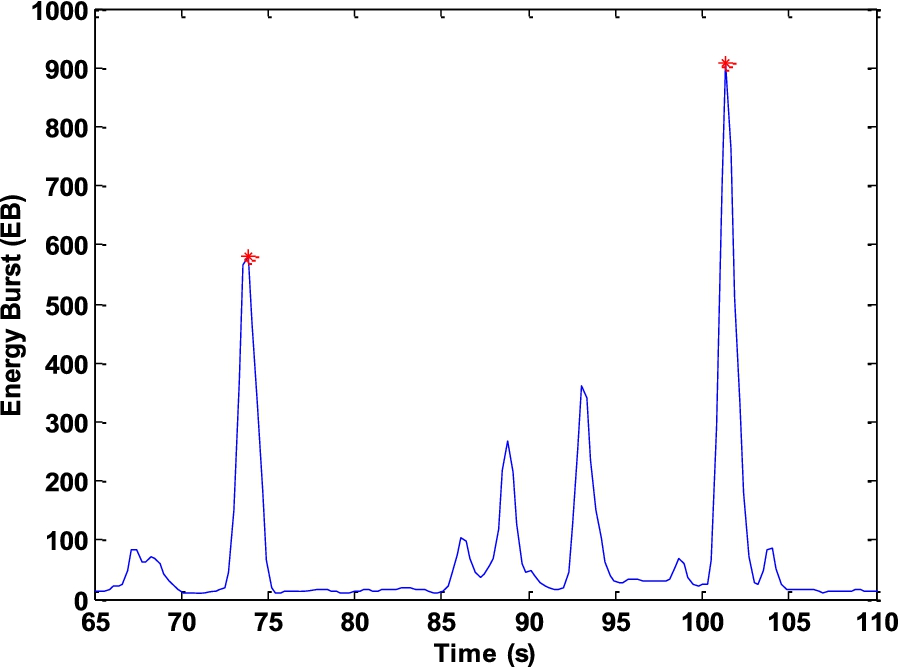
Energy burst curve for Fig. 4.
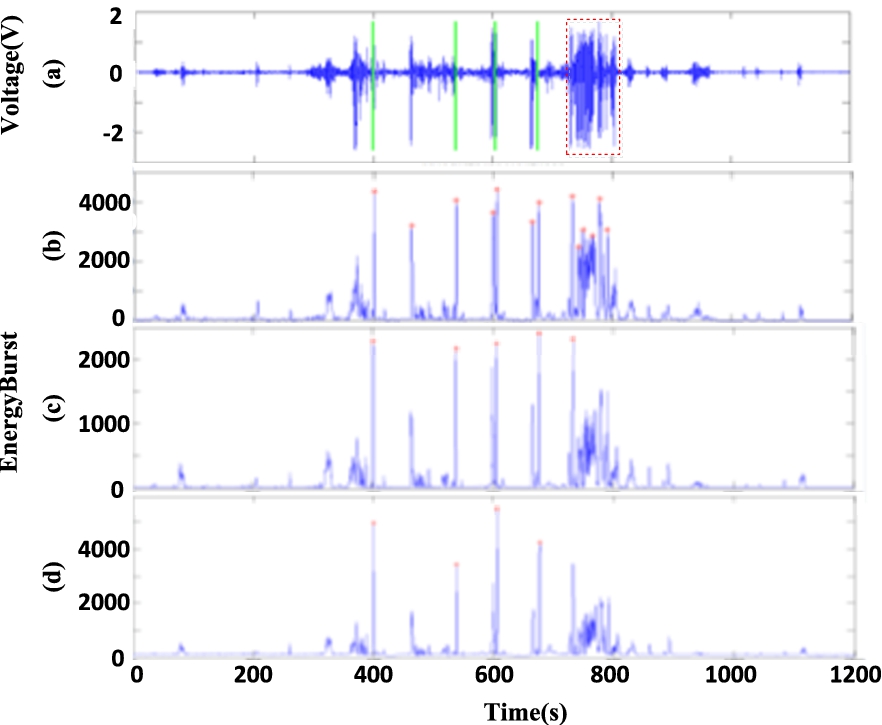
Influence of the frequency range on detecting potential falls (marked by red stars) on energy burst curve: a) original radar signal including 4 falls (green lines) and walking (red box); b) [10, 50] Hz range; c) [25, 50] Hz range; d) [30, 200] Hz range.
One question is determining the best choice for the frequency range [A, B]. The Doppler shift (hence the signal waveform in Fig. 3)
The frequencies below 25 Hz are typically associated with low speed activities such as walking (see extra detections in Fig. 6(b) vs 6(c)). As we increase the lower frequency threshold, A, the number of false alarms produced by walking decreases. Similarly, increasing the higher threshold, B, seems to slightly decrease the false alarms (see Fig. 6(c) vs 6(d)). However, less useful information seems to be present past 200 Hz (see Fig. 4). In this paper, for fall detection, we choose the [A, B] frequency range as [25, 50] Hz.
After the EB curve is computed, we then smooth it using a moving average with
On the energy burst curve, a peak means the occurrence of an extreme motion, such as a fall. A peak finder with a threshold is used to locate this potential fall location. By adjusting the threshold, the number of potential fall activities varies. Figure 5 shows an energy burst curve with located fall peaks.
To describe the Doppler signal we used features employed in speech recognition such as Mel-frequency cepstral coefficients (MFCC) and 1-D local binary patterns [40]. The reason for this choice is that human radar operators were able to identify certain targets by listening to the Doppler audio output [16]. In our laboratory experiments MFCCs outperformed other features, such as zero crossing rate and energy frequency bands [27] and LBP (see Fig. 12) due to, we believe, a superior false alarm representation.
We extracted MFCCs features from a 2 s window located around the potential fall. The window size is selected from the exhaustive searching of window size in [0.5 s, 6 s] with 0.5 s interval on floor radar dataset. Each 2 s window is considered as an input signal frame, which needs to be divided into sub-frames to extract features. If the signal sampling frequency is 960 Hz, an input signal frame has
After ignoring the first coefficient (DC term) in each sub-frame, we obtain a feature vector with the dimension of
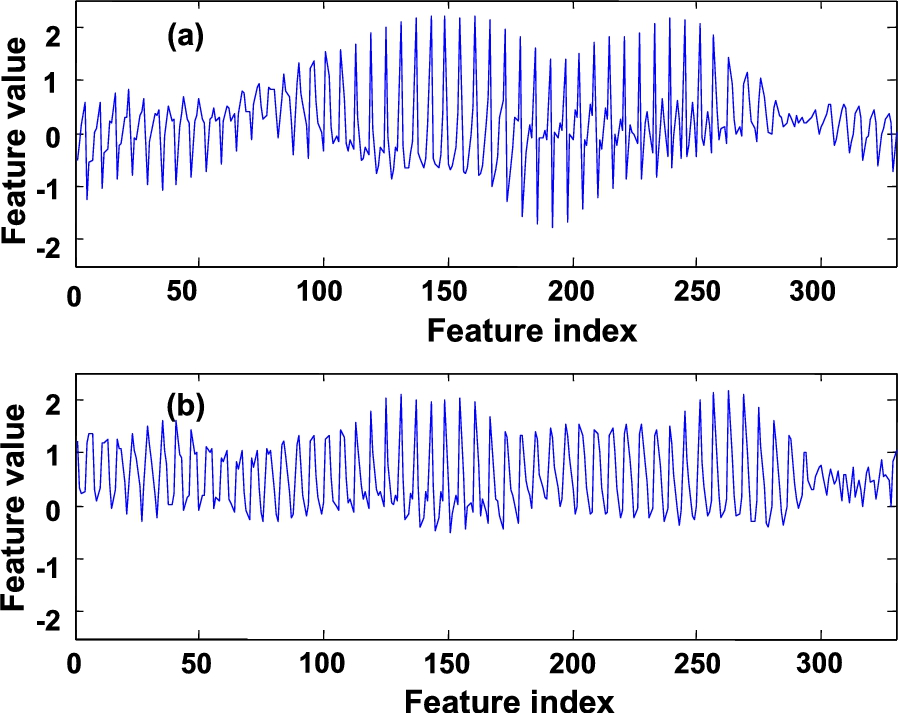
Examples of fall (a) and nonfall (b) feature vectors for a 2-second signal window.
One of the most challenging parts of developing our fall recognition system was developing a radar signature library. Although the ground truth has been observed by the depth camera monitoring system, there may be some uncertainty in the fall timing due to the fall type, direction and the clock difference between the PC and DataQ logger. In fact, it is hard to tell just by looking at a radar signature if it comes from a fall or not (see Fig. 3). To alleviate the effect of the fall timing in the 2 s window, we propose to apply a feature alignment procedure (somewhat similar to the ones used in bioinformatics [19]) for the entire training dataset. This will ensure the presence of fewer outliers in the training data and more compact fall and non-fall clusters in the feature space.
The feature vectors were aligned such that their correlation is maximized. For two feature vectors
We tried two alignment strategies: a simple one based on zero padding and a more complicated one based on search in a larger feature window. The zero-padding strategy consisted of shifting
Feature shifting algorithm
Support vector machines (SVM) are a popular classification method for two class problems. We employed LibSVM implementation for both training and testing steps [1,2]. We used a linear kernel SVM for computational efficiency.
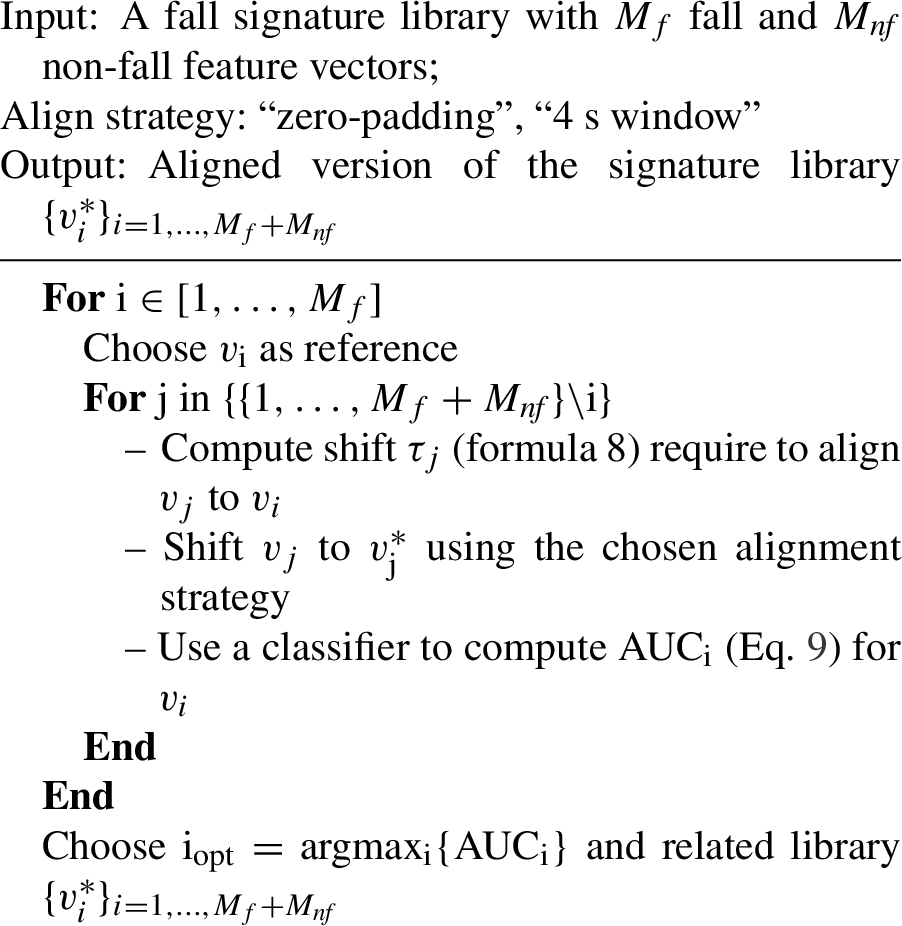
The classifiers were first trained and tested on signature libraries (ceiling and floor) obtained in our laboratory using a leave-one-out cross validation approach. Then, we used the classifiers trained on the laboratory signature to classify the continuous data obtained in the TigerPlace apartments. We also used a set of classifiers trained on the stunt actor falls obtained in TigerPlace to test the influence of the environment in the training process. This aspect is important for the real life application since we would like to avoid training the system for each apartment and person, if possible (see Fig. 11). The fall detection algorithm used for experiments on a signature library is summarized in Algorithm 2 below.
The online classification procedure used for continuous data was similar to Algorithm 2 except for three details. First, a sliding 2 s window with a 0.5 overlap rate was employed in step 1 above. Second, a 4 s buffer was available to perform the feature alignment procedure. Third, to reduce the number of false alarms, we used an energy threshold e to decide if steps 1–7 from Algorithm 2 will be performed or not. If the energy of the signal in window i,
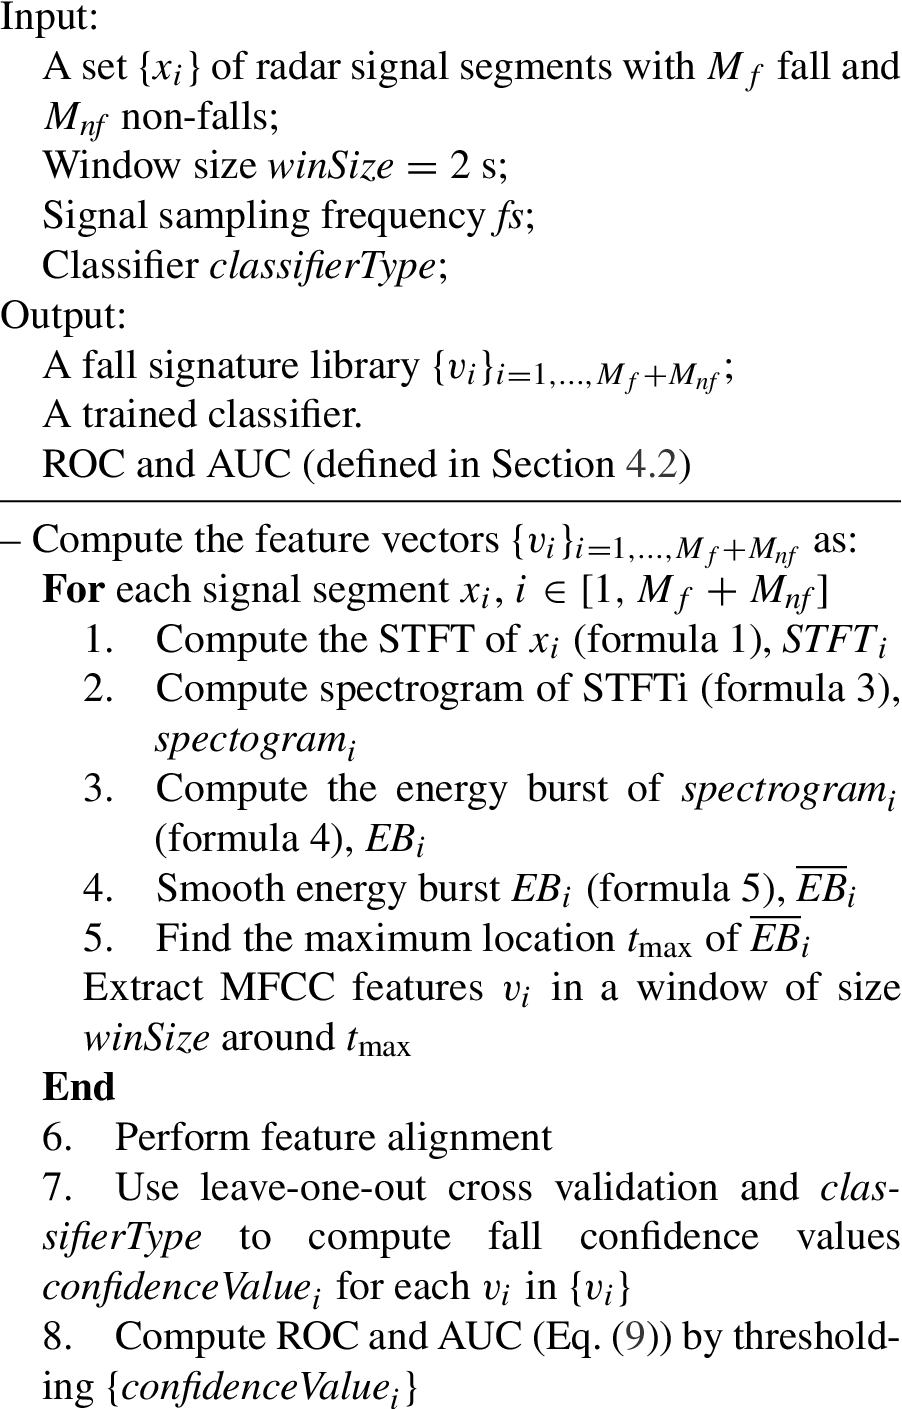
Fall detection algorithm
Data collection
The fall/non-fall activities were performed by stunt actors in both our laboratory and the senior apartments. Our nursing collaborators trained stunt actors using 21 fall types at the University of Missouri to fall in ways similar to older adults [30]. In our laboratory, aside from elderly falls, the stunt actors performed other possible activities of daily living in an independent living facility, such as walking, picking objects from the floor, sitting and standing [3] which might generate false alarms. While stunt actor falls were still used in TigerPlace, we obtained a large amount of data (mostly normal daily activities) from the TigerPlace residents themselves. While a variety of activities were recorded in the apartment, no real falls were observed during the two weeks period of the data collection. Note that our project had University of Missouri Institutional Review Board approval and written consents from all senior apartment residents involved in data collection. In this paper, we used three datasets denoted as DATA_Lab, DATA_Apt1 and DATA_Apt2, respectively.
Stunt actor profile in DATA_lab
Stunt actor profile in DATA_lab
Lab environment. RCR 1 is on floor and RCR 2 is on ceiling. (a) Front camera view. (b) Right side camera view.

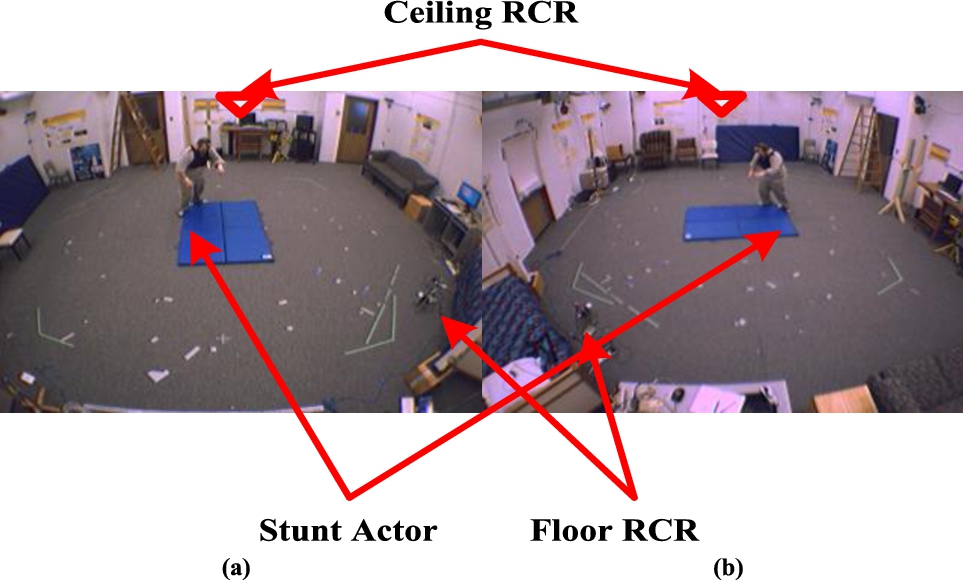
Senior apartment in TP. RCR 1 is on the floor and RCR 2 is in the attic. (a) Left side camera view. (b) Front camera view.
We used a receiver operating characteristic (ROC) curve to evaluate the performance of the classifier in the fall detection algorithm. The ROC is obtained by thresholding the fall confidence (a number between 0 and 1) generated by the classifier with a series of n thresholds,
We mention that in the case of continuous radar data (DATA_Apt1_r and DATA_Apt2) the number of events that can lead to false alarms is unknown. In this case we report the number of detected false positives (false alarms) per unit time (hour). Since this is not a traditional ROC, we will call it a “pseudo ROC”. In our opinion, this pseudo ROC is more suitable for evaluating online algorithms that run in real settings. Reporting the number of false alarms per hour instead of the false alarm rate, allows the clinical personnel to more easily evaluate and understand the fall detection system.
Experimental results
In this section we present the results of several experiments designed to answer the following questions: (1) Is feature alignment useful? (2) What is the best position of the radar sensor (floor/ceiling)? (3) What is the performance of a radar fall detection system in real settings? (4) Is this performance different from the one observed in the laboratory? Why?
Influence of feature alignment on classification
This paper used a window based approach for feature alignment. The size of the window is chosen and compared to other known windows using features. Although a segmentation based approach might be better, it requires a good segmentation process and a dynamic time warping method for alignment with a variable signal window. One of the greatest problems for the segmentation based approach would be that it is not easy to produce the ground truth for Doppler signal segmentation. So the window based approach is chosen to investigate the effect of feature alignment. We used the data collected in our laboratory, DATA_Lab (only the floor RCR), and ran multiple classification experiments with different numbers of MFCC coefficients for three cases: unaligned features, aligned using zero padding, and aligned using a 4 s window (see Fig. 10). We used a classifier and AUC to quantify the algorithm performance for each case. As expected, both feature alignment procedures resulted in better classification performances than the unaligned case: zero-padding by about 3% and 4 s window by about 6%. The increase in performance was independent of the number of MFCC coefficients employed. However, the best classification performance was observed in all three cases for
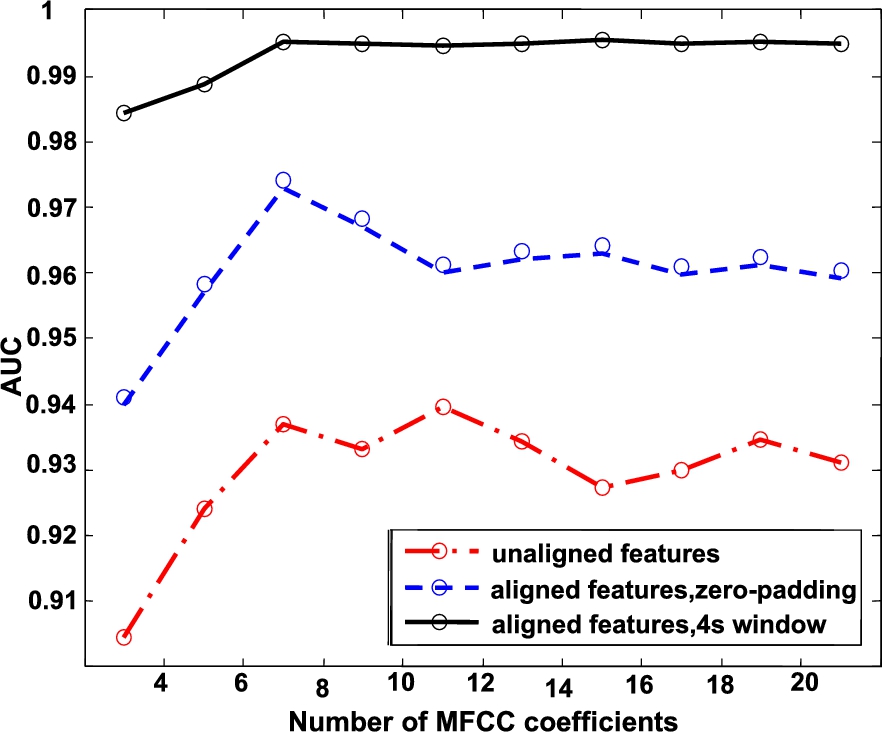
Fall detection performance for three feature alignment options: no alignment, zero-padding, and 4 s window, with the variable number of MFCC features, respectively.
To determine which radar position leads to better fall detection performance, we first used our laboratory data, DATA_Lab, and then the stunt actor part of the TigerPlace data, DATA_Apt1_s.
Fall detection in the laboratory setting
The ROC curves obtained for two radar positions using a SVM classifier with DATA_Lab are given in Fig. 11. From Fig. 11, we see that the ceiling RCR generates a larger AUC value. In addition, the ceiling RCR detects all the falls with only 20% false positive rate, which is better than the floor RCR. Clearly, placing the radar on the ceiling produced better results than placing it on the floor.
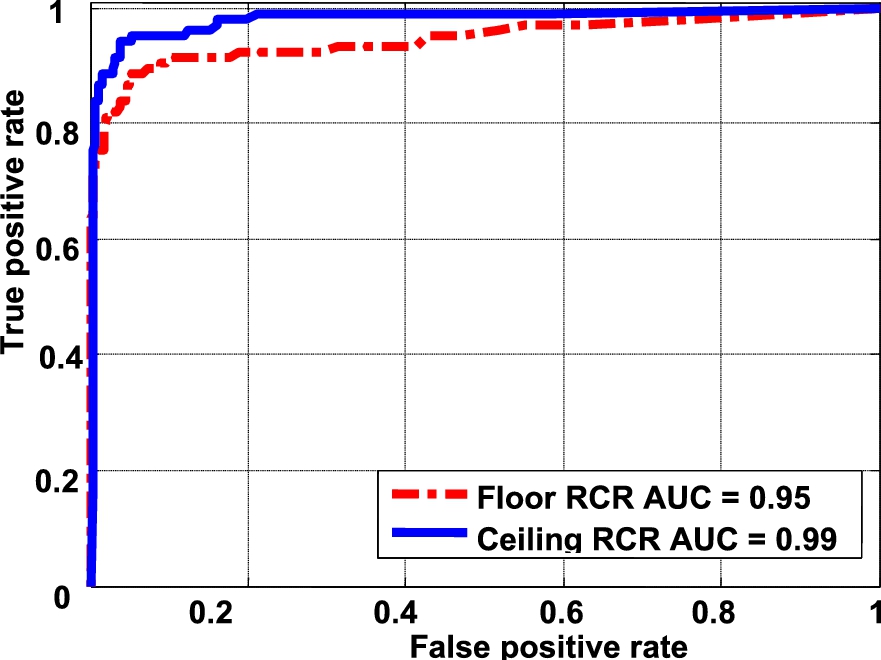
Fall detection in lab environment with DATA_Lab.
We conducted similar experiments using stunt actor data collected in TigerPlace, DATA_Apt1_s and DATA_Apt1_s_b.
The features were validated on DATA_Apt1_s_b, which has a clean signal background and full coverage to the room because of the limited space and furniture in the bathroom. For comparison, the performance of the LBP features [40] (AUC = 0.79) is about 20% worse than MFCC (AUC = 0.98) on the ceiling data collected in TigerPlace bathroom in Fig. 12.
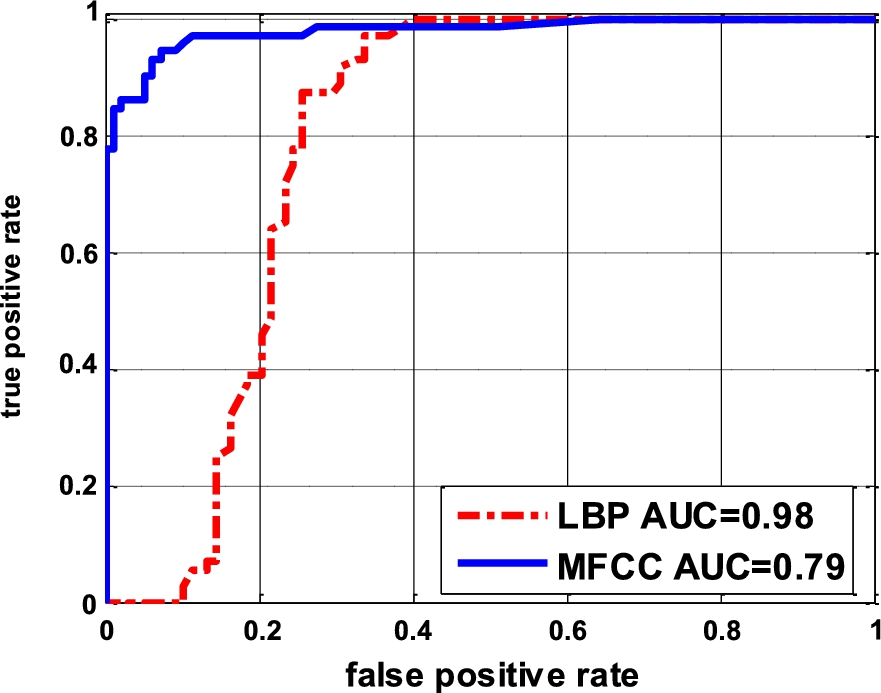
Performance comparison between different features: LBP and MFCC features on the ceiling data collected in TigerPlace bathroom.
To test if a classifier trained in the laboratory can be used in real settings, we performed two sets of experiments, as shown in Fig. 13: we tested DATA_Apt1_s with classifiers trained on DATA_Apt1_s (circles), and with classifiers trained on DATA_Lab (triangles). As we can see from Fig. 13, the loss in performance is only of about 2–3% between the two classifiers. This finding has important implications for the development of an online fall detection system. Immediately after deployment time, we can use a classifier trained in the laboratory that will later be improved using some online adaptive training strategy.

Fall detection in senior apartment environment with DATA_Apt1_s by using different training datasets, DATA_Lab and DATA_Apt1_s, respectively.
From Fig. 13 we also see that the performance of both RCRs decreased in the real setting due to various factors such as lower ceilings, apartment clutter and motion interference from other people present in the apartment. However, the results from Fig. 13 confirm that the best placement of the radar is on the ceiling. We note that the actual RCR position in the TigerPlace apartment was above the ceiling (in the attic) which on one hand was clean (no apartment modification required) but may not be accessible for some homes (such as apartment buildings).
We used the fall detection algorithms described above, trained on DATA_Lab and DATA_Apt, to detect falls in the two weeks of data collected in 6 TigerPlace apartments using floor RCRs. We centered our data collection on the day that the stunt actor performed 12 falls in each apartment near the floor radar, to make sure that our data included enough falls. Details about the detection algorithm used in this experiment are given in Algorithm 2 and its performance is shown in Fig. 14. For two apartments (1 and 4) we obtained 100% detection with about 2 false alarms per week (0.015 FA/hour). This proves that a Doppler radar can be used for fall detection. However, in two other apartments (5 and 6) the number of false alarms was greater than 1 FA/hour at 100% detection, which is clearly inacceptable.
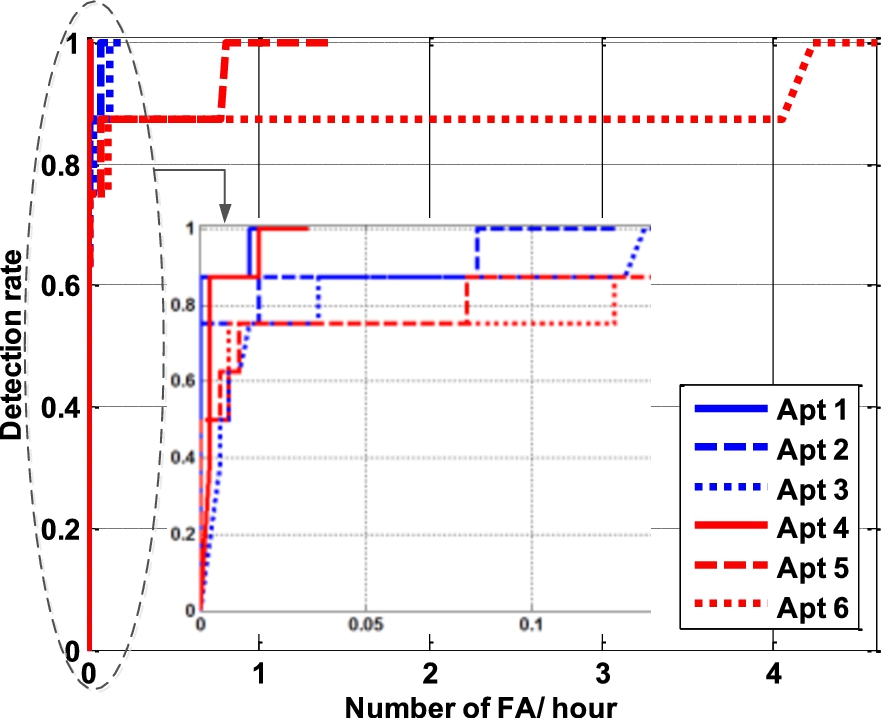
Fall detection and false alarm of floor RCR with two weeks senior apartment data in 6 different TigerPlace apartments.
In Fig. 15, we show the results on DATA_Apt2. A 75 years old resident lives alone in this apartment and she is a frequent faller. The data contains 6 natural falls during the one week long data collection.

Result obtained for DATA_Apt2.
As we see from Fig. 15, the Doppler radar system is able to detect all the real senior falls but with a significant number of false alarms. So this answers the question if we can identify falls from persons that were not included in the training dataset. To further reduce the false alarms, we can use a fusion approach with other sensors such as motion detectors. Using the depth cameras installed in the apartment (i.e. Microsoft Kinect) we were able to determine which activities produced false alarms. Among the most frequent false alarm sources we mention a big cat (around 4 kg) jumping on/off the chairs/couch and visits by the nursing staff and other visitors that come to help the resident multiple times every day in his apartment. All those activities contribute to a high false alarm rate during this one week data collection. However, in the meantime, our motion detectors are pet-insensitive and we should be able to tell if the activity is performed by the resident or by the cat [23]. Moreover, our Kinect based gait detection system is able to identify the resident in the room based on his gait [35]. Using the radar in conjunction with other sensors (such as motion sensors [23] or Kinect [35]) can further reduce the false alarm rate.
False alarms from two weeks data in each apartment

Motions for different daily activities: (a) sit down on floor with butt on floor first and keep both leg straight in front; (b) cross leg and sit down on floor; (c) lay down on floor; (d) sit down on a chair; (e) kneel down on floor; (f) drop a book on floor, bend over and squat down to pick it; (g) walking; (h) fall. The y-axis units are voltage (V), frequency (Hz) and squared-voltage (v2) for the raw signal, spectrogram and energy burst, respectively. The x-axis unit is time in second.
We showed in Section 5.2 that the ceiling is the best position for RCR to detect fall. However, since our work was part of a parent study that comprises both fall risk assessment and fall detection, the team decided to focus on prevention using gait assessment, which requires radars on the floor for a higher accuracy. Since the parent study has ended, we are in the process of moving all our floor radar on the ceiling to collect more data for fall detection.
The use of the floor RCR for gait detection had another implication on fall detection. To optimize gait detection, a thin aluminum foil shielding with a slit was placed on the detector in order to prevent secondary reflections to reach the antenna [10]. The size and placement of the shielding were not identical among the six apartments, being a possible source of the variability observed in Fig. 14.
In Table 2 we show an analysis of the false alarms detected by our algorithm in all six apartments. We chose the false alarms with fall confidence greater than 0.5 for apartments 1–4, and 0.95 for apartments 5 and 6. The false alarms were identified based on the Kinect depth images and classified into six categories: bend over or pick up an object, drop things on floor/chair, sitting or standing, running or fast walking, leave/enter the room and other. Figure 16 uses the raw signal waveform, spectrogram and energy burst curve to present the patterns for eight daily activities. Those activities in Figs 6(a)–(g) represent the most common false positives in a daily living environment. Figure 6(h) shows the occurrence of a fall.
Another possible explanation for the variability observed in Fig. 14 is the number of people and visitors in the apartments. For example, apartment 5 has a couple living in it, rather than just one person. The residents like to spend a lot of time in the living room and have many visitors. The fast runs observed in apartment 5 are due to kids running and sitting on the floor. In apartment 6, the female resident has severe osteoarthritis, and she uses an aluminum walker during walking. It is possible that the reflections caused by the walker resulted in the extra false alarms. Moreover, a physical therapist and nursing staff visit her apartment frequently leading to more false alarms. Pets are also a problem for our current system. The “other” false alarms (see Table 2) observed in apartment 4 are due to a dog jumping up/down from the couch.
The radar position on the floor is another source of variability. The floor radars are by the front door in the first two apartments being prone to detect walks in/out of the apartment. In apartment 4, the floor radar is in the bedroom and pointing toward the living room. This could lead to various false alarms (“other” in Table 2) caused by sudden turns or entering the bedroom. In the apartments 5 and 6, the radar is put beside the counter which is close to the center of the livingroom. This placement captures more visitor activity than the bedroom placement.
Conclusions
In this paper, we describe a fall detection system based on a Doppler radar sensor in senior homes. This system can differentiate a fall from daily non-fall activities based on MFCC features extracted from the radar signal using a SVM classifier. We first deployed the system in a simulated home-like laboratory environment and investigated classification performance for various variables such as the number of MFCC coefficients, feature alignment and radar position. We found that using 7 MFCC coefficients, feature alignment and ceiling positioning leads to the best performance.
Then, we deployed the system in six apartments in TigerPlace, an aging in place facility in Columbia, MO. The results obtained in TigerPlace varied from about 2 false alarms/week to about 4 false alarms/hour at 100% detection rate. After analyzing the false alarms, we concluded that the variability of the results was due to factors such as radar construction and positioning, number of people in the room (resident or visitors), pets and walkers. Moreover, the proposed system effectively detected all six natural falls in a continuous one week data from an apartment where a senior faller is living there.
In future work, we will try to address the variability of results by developing algorithms more robust to visitors, pets and interferences. We are currently deploying Doppler radars on the ceiling of ten TigerPlace apartments in order to further confirm the results presented in this paper.
Footnotes
Acknowledgement
This paper was funded by the AHRQ grant 5R01HS018477.