
Abstract
Previous studies have indicated the relation between a person’s gait related parameters and their health. Therefore, the ability to continuously monitor a person’s gait characteristics would be an advantage for caregivers. This paper proposes a solution that is able to estimate footstep locations based on audio measurements in a wireless acoustic sensor network (WASN). In realistic noisy environment this can however be difficult. A system proposed in previous work is first described and it is then discussed that it has difficulties to handle noisy environments. This paper proposes different modifications in order to improve noise robustness, i.e. average subtraction, multichannel Wiener filter and a noise robust footstep detector. These modifications and the original system are tested on a simulated dataset using stationary noise. This shows that an error reduction of 70% compared to the original system can be achieved. This improvement was confirmed on a real life dataset (error reduction of 60%). Finally the limits of the system are tested under highly non-stationary noise conditions. One modification was able to handle that difficult scenario under all SNR conditions (at best an error reduction of about 33% is observed in these experiments).
Introduction
Various studies have been performed to indicate correlations between gait related parameters (walking speed, stride length, step time, gait variability, …) and the health of a person. For example in [3,23,27,33] the authors describe the correlation between gait and cognitive functions, in [25] the relation to the functional independence is indicated and in [4,9,14,19,32] the relation to future fall incidents is shown. All of these studies used either expensive lab equipment (walkways equipped with pressure sensors [3,9,14,27,32], 3D imaging through markers on the feet [14]) or body-worn sensors (3D-accelerometer [9], shoe sole pressure sensors [19,23], ultrasonic portable timer [25]) to gather the gait parameters.
The former systems are costly and require a specially equipped environment. The latter systems are typically uncomfortable to wear for everyday use and can be easily forgotten to wear. A more preferable approach would be to gather the gait parameters in home using non-intrusive and contactless sensors. An obvious approach would be to estimate the footstep locations since the parameters mentioned above could all be extracted from this.
This paper aims at estimating footstep locations using acoustic information. Acoustic monitoring has the advantage that it is contactless (no need to wear a dedicated sensor which can be forgotten and is uncomfortable to wear) and it can be integrated with other acoustic systems that may be used to assist the user to e.g. control the environment by vocal commands [12] or automatically trigger an alarm when distressed speech is detected [21], etc. This paper proposes the use of a wireless acoustic sensor network (WASN) for the purpose of estimating footstep locations. A WASN basically consists of multiple nodes each containing one or more microphones, a processing unit and wireless communication capabilities. This setup allows a spatially uniform sampling covering large areas using small devices. A WASN does not require inconvenient cables for communication between nodes which is preferred when using the system in a home environment. Furthermore, the computational load (which can be significant) can be distributed among nodes so that cheaper hardware can be selected [5].
Our goal to estimate footstep locations in a home environment using a WASN setup comes with some specific challenges:
Low SNRs: footstep sounds contain low energy, so it is expected that the microphones receive these with low SNR. A previously published paper [31] showed promising results in estimating footstep locations under good SNR conditions. Here we will extend this work by validating the system in low SNR conditions and by considering improvements of the original system to increase the noise robustness.
Short sound events: footsteps produce short sound events (in our data set around 200 ms). As a consequence only a limited number of samples (duration × sample frequency) are available to detect the footstep and estimate its location.
Reverberated signals: the indoor environment causes reverberation effects which makes the sound partially diffuse and alters the spectral properties of the footstep. A typical measure for the amount of reverberation is the T60 (the time for the sound level to drop 60 dB after the emission has stopped). Typical living room T60 values are between 0.2 and 0.3 s.
Distributed processing: to be of practical use, the processing in the WASN must be distributed due to the limitations on communication bandwidth and computational resources.
Only a few papers have dealt with the estimation of footstep locations using acoustic signals. Most existing footstep localization systems rely on seismic sensors (measuring vibrations on the floor) [24]. This however has the main disadvantage that seismic signals travel with a medium-dependent speed (e.g. faster through concrete than through wooden floors) which implies the need for a calibration phase prior to the actual use of the system.
The little of research that focuses on estimating footstep locations using acoustic signals often use standard sound source localization techniques which are not directly suited to be used in a WASN, to operate in low SNR conditions or do not exploit footstep characteristics which are case-specific, to improve results [28,34].
Other research focusing on estimating sound source positions that is suited for a WASN [1,18], does not focus on footsteps and their specific challenges. However the algorithm described in [18] should have some tolerance against noise. It is based on Distributed Adaptive Node-specific Signal Estimation (DANSE) [6] which basically implements a network-wide signal enhancement so that the location estimation is improved. This method is related to the Multi channel Wiener Filter (MWF) that will be presented in this paper (please refer to Section 4.2 for more information).
This paper proposes a system suited to operate on a WASN using noise robust signal processing techniques such as Multi-channel Wiener Filter (MWF), average subtraction and a noise-robust footstep sound activity detector.
This paper is organized as follows. In Section 2 a formal definition of the problem is given. In Section 3 the basic system architecture as in [31] is reviewed and it is discussed that it would fail under low SNR conditions. Then in Section 4 modifications to the original system are proposed to make the basic system more noise robust. In Section 5 experimental setups, using both simulated and real-life data, are described which are used to validate the modifications under various adverse conditions. In Section 6 experimental results are presented and discussed. Finally, in Section 7 conclusions are drawn.
Problem statement
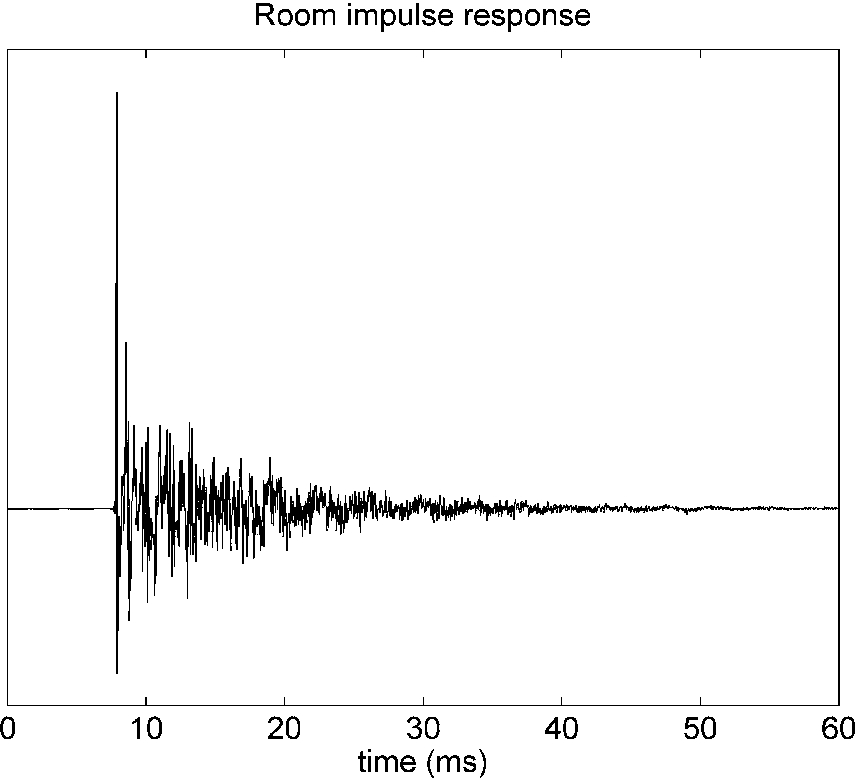
Example of a room impulse response.
In this setup all microphone nodes are placed at ground level, so that both microphones and footstep locations are located in the same 2-dimensional plane. Consider the data model for the mth microphone signal for one footstep to be:
A typical RIR,
The energy of the (already low energy) footstep sound y can be decreased drastically after traveling some distance to microphone m. Therefore the noise on the mth microphone
This could yield low SNR, complicating the footstep localization. In this paper prior knowledge on the characteristics of the footstep sound is used in order to improve the localization performance. This prior knowledge includes:
Rhythm: during a walk it is expected that footsteps are periodic.
Spectral features: footsteps produce sounds with a specific timbre.
Spatial features: the footstep locations are constrained to be at floor level.

The basic system as described in [31].
In this section the footstep location estimation system proposed in [31] will be reviewed along with all the used algorithms (Sections 3.1, 3.2). This system will serve as a basis to later define the noise-robust system that is proposed in this paper. Its architecture is shown in Fig. 2. First each node detects the footstep activity in order to select the signals parts used for further processing (in Fig. 2 denoted as “Footstep detector”). In [31] this is simply done by thresholding on the energy level of the microphone signals, i.e. if the sound is more powerful than a predefined threshold it is seen as a footstep sound. Then each node in the WASN, equipped with a microphone array, estimates the direction of arrival (DOA) of the footstep sound (in Fig. 2 denoted as “Direction of arrival estimation”). For this purpose [31] uses a standard DOA estimation technique, namely Steered Response Power PHAse Transform (SRP-PHAT), further explained in Section 3.1. The individual DOA estimates are then fused into a 2 dimensional power map using the Global Coherence Field (GCF) technique further described in Section 3.2 (in Fig. 2 denoted as “Combine directional energy”). Given such a power map generated during one footstep, the footstep location is determined by selecting the area containing the highest power (in Fig. 2 denoted as “Select footstep position”).
This system however has no means of dealing with noise. The footstep detector will detect every sound powerful enough and the DOA estimation will also detect the directions of noise sources. As a results all sounds will be considered as footsteps and estimations about actual footsteps can still be corrupted by noise. Therefore the system’s performance will drop when it is used in a noisy environment. After more detailed descriptions of the algorithms used in this system (SRP in Sections 3.1 and GCF in Section 3.2) modifications to make the system more noise robust are proposed in Section 4.
Steered Response Power (SRP) [30] consists of a delay-and-sum beamformer. Consider the data model for the mth microphone as described by Eq. (2). The discrete Fourier transform of this signal during one footstep at frequency
An enhancement can be made by decorrelating the signals over time and thereby narrowing the beamwidth of the delay-and-sum beamformer, making the DOA estimates more robust against reverberation. This is done by normalizing the microphone signal DFT per frequency bin and is denoted as PHAse Transform (PHAT) [30]:
By scanning the whole 180° (in this paper done with a 1° resolution) a function with power estimates of sound coming from all directions is build.
Global Coherence Field

Example of the GCF algorithm. (a): a setup with 1 footstep location (*) and 4 nodes (o), around each node the estimated DOA (
Given known positions and orientations of each node, the GCF projects the DOA estimates obtained by SRP-PHAT onto a predefined 2D grid, as shown in Fig. 3 (in this paper with a resolution of 1 cm2) [7,8]:

The proposed noise robust system. The gray blocks are adopted from the basic system. The white blocks are added for noise robustness.
In order to increase noise robustness a number of modifications to the former system (as in [31]) are proposed in this paper. This is shown in Fig. 4. The following modifications were implemented:
Average subtraction: In the 2D GCF map fixed noise source locations can be identified and suppressed before selecting the point with the highest power (in Fig. 4 denoted as “Average subtraction”). It is expected that this modification will improve the estimation results when the noise sources are on a fixed location. This is further described in Section 4.1.
Multichannel Wiener Filter: as a preprocessing operation the quality of the microphone signals can be enhanced by means of a noise reduction and thus boosting the SNR before further processing (in Fig. 4 denoted as “Enhance microphone data”). Therefore it is expected that when MWF is introduced the estimation results will be comparable with results otherwise only achieved at better SNR conditions. A commonly used algorithm for this purpose is called Multichannel Wiener Filter (MWF) [13], which is explained in Section 4.2.
Footstep detector: For the system to work adequately it first has to detect where a footstep sound starts and ends (in Fig. 4 denoted as “Footstep detector”). Under noisy conditions this can however be difficult. In Section 4.3 a footstep detector is described that uses knowledge of the footstep characteristics in order to achieve better results in noise conditions.
The MWF and average subtraction can be turned on or off, the footstep detector will always be used since its detections are always needed.
The contributions of all spatially and temporally stationary noise sources on the 2D power maps are the same for each footstep. After gathering the 2D maps for all F footsteps these maps can be averaged. Here the contributions of the non-stationary sources (namely the footsteps) are limited and the contributions of the stationary noise sources remain:
Multichannel Wiener filter
Numerous noise reduction techniques exist for multichannel data. In this paper we will use the multichannel Wiener filter (MWF) [13]. The MWF can be interpreted as a beamformer followed by a single-channel post-filter that optimally suppresses the noise in a reference channel in a mean squared error sense [29]. This is accomplished by relying on estimated noisy and noise-only correlations between the microphone signals. These correlations are estimated using a desired sound activity detection mechanism. As no prior knowledge about the source location or noise characteristics is needed, the MWF is favored above other noise reduction techniques available in the literature. The MWF will now be explained and extended to enhance all microphone channels of one node at once.
Considering the data model as in Eq. (2), a stacked version of delayed microphone signal samples (of all microphones in one node up to L delay taps per microphone) can be defined as:

Architecture for footstep detection.
Up till here the general form of a MWF is derived in Eq. (18). However some implementation decisions still have to be made:
The estimation of
Global/local processing: The MWF can be used with as many microphones as desired and typically (under the assumption that the estimates of
As both the MWF and SRP rely on the on- and offset detections of the footstep sounds a properly functioning footstep detector is required. However the footsteps can be strongly corrupted by noise, hence a robust detection will be difficult. But if the gait period (time between 2 steps) is known and assumed constant, one accurate detection could be sufficient. Then this detection could be repeated with the given periodicity. The architecture for the footstep signal detection is shown in Fig. 5.
On the left-hand side of the figure the gait period ( Cross-correlation with a template footstep sound: the microphone signals are correlated with a template footstep sound (it is assumed that the system is personalized) so that spikes emerge at the footstep occurrences. In a practical setting multiple pairs of footwear can be worn, altering the properties of the produced sounds. This is not yet considered here. In this case we expect that a possible solution could be to use multiple templates plus an extra algorithm selecting the template best fitting current observations. Similarity signal (beat spectrum): the calculation of the similarity signal (described in [16] as part of the calculation of the beat spectrum) starts by extracting feature vectors at different time instances out of the microphone signals. In our implementation MEL features where used which are typically used for sound classification purposes, i.e. recognition [20]. First the audio is cut in overlapping (by 15 ms) frames of length 25 ms on which a frequency analysis is performed using the Discrete Fourier Transform (DFT). These DFT spectra are sent through 25 different triangularly shaped filters in order to extract the 25 MEL features forming one features vector. These triangular filters are designed to uniformly cover the MEL frequency scale from 0 to 16 kHz. For more detailed information refer to [20]. For a certain time shift t all feature vectors are paired with the feature vectors extracted a time t later. Then the similarity signal at time t is calculated as the average Euclidean distance (similarity) between all pairs of feature vectors. At times Probability score: on a set of 5 example footsteps the same feature vectors are extracted as for the similarity signal. Over these features a Gaussian mixture model (GMM) [22] with 3 Gaussians and full covariance is fitted using the Expectation-Maximization (EM) method as described in [26]. This way a model is created describing the probability for a feature vector to originate from a footstep. Now the incoming microphone data can be validated. During a footstep the probability should be large, during noise it should be low.
On the resulting signals (cross-correlation signal, similarity signal or probability score over time) the gait period can be estimated by means of a high resolution frequency analysis. A interpolated Discrete Fourier Transform (DFT) is calculated from the signal and the frequency with the highest energy is selected as the gait frequency (in Fig. 5 denoted as “Estimate stepping period”). In case of the similarity signal this frequency analysis is better known as the beat spectrum [16] Furthermore, the gait period estimates are first made locally on each node and then averaged over all nodes in a central processor.
On the right-hand side of Fig. 5 the actual detections are performed. First (in Fig. 5 denoted as “Sum microphone energy over all periods”) all M microphone signals and F gait periods are split up in
This is under the assumption that all F footsteps are perfectly periodic. In practice this will not be the case but imperfections can be limited by utilizing the system were long walking sequences are expected, i.e. an hallway.
Then the most energetic 200 ms (the time a footstep produces sound, determined from the template footstep) within
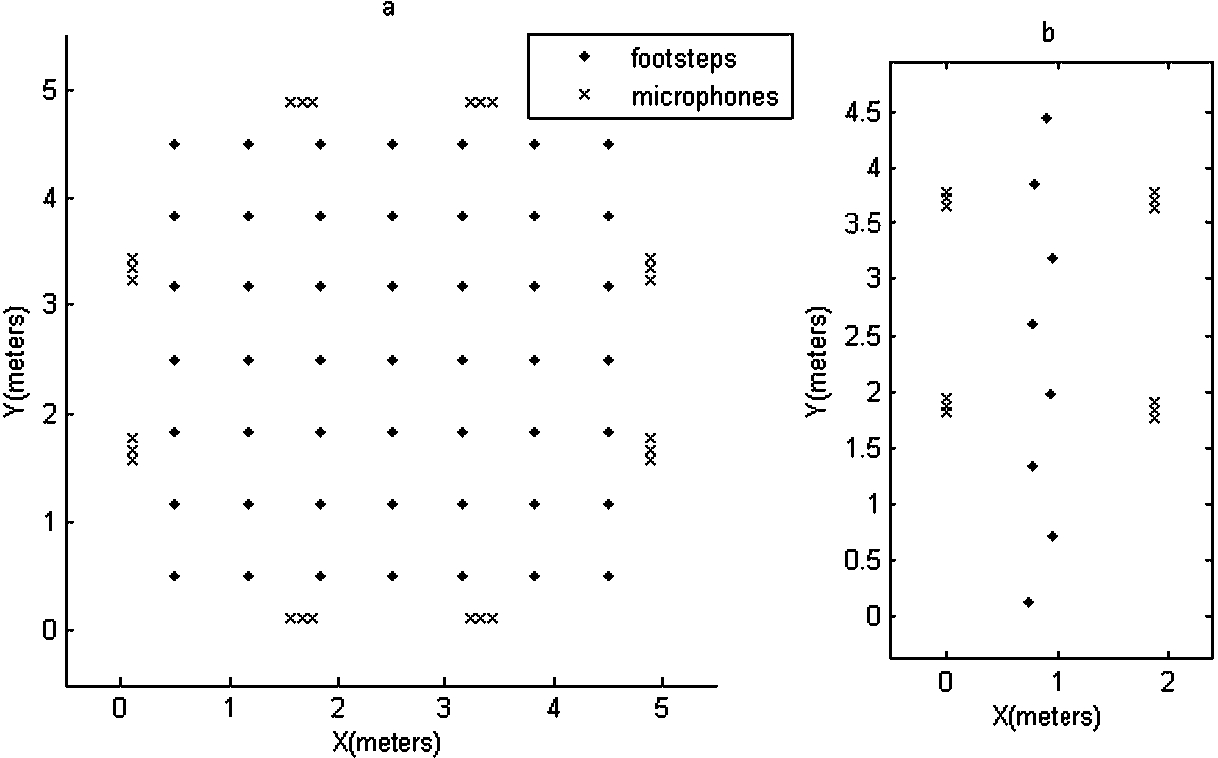
Ground plane of the experimental setups plotted in an X–Y space: (a) the simulated setup and (b) the real-life setup. The markers ‘.’ indicate the footstep locations. The markers ‘x’ indicate the microphones grouped per 3 to form the nodes.
First a set of 21 (1 used as template, 20 used for the simulation) footstep sounds was recorded at a sampling rate of 32 kHz. The subject was asked to walk 21 times in a natural way taking one step directly next to a microphone (yielding a large SNR and low reverberation impact). Only these steps close to the microphone were further used. Since all 21 steps were recorded during another walking sequence the differences are within the natural variations of that person walking. Then these footstep sounds were simulated to come from predefined footstep locations using room impulse responses (RIRs) obtained by the Image Source Method (ISM) [2,17]. Figure 6a shows the experimental setup. In a
Real-life data
Next to the simulated data also real-life data was recorded in order to validate the performance of the proposed system. Figure 6(b) shows the recording setup in an office environment. The T60 measured in this room was 0.24 s and the average SNR (over all microphones and all recordings) was measured to be
Results and discussion
Footstep detection on simulated data
Accuracy of the footstep detection algorithms on the simulated dataset in terms of accuracy
Accuracy of the footstep detection algorithms on the simulated dataset in terms of accuracy
All of the footstep detection algorithms (described in Section 4.3) are tested on the simulated data and each sample was labeled either true positive, true negative, false positive or false negative. Then all the algorithms are compared by means of accuracy. Accuracy is defined as:

(A) Average estimation errors in meters of all footsteps of all Monte Carlos runs in meters on the simulated dataset. The markers “O” indicates the use of a MWF. Dashed lines indicate the use of average subtraction (AV). The names in the legend indicates the algorithms used: SRP stands for Steered Response Power, MWF for Multi-channel Wiener Filter and AV for average subtraction. (B) The ANOVA significance tests, indicating whether or not the difference of results between a modification and the baseline is significant at a certain SNR value.
The results are shown in Table 1. Here it is clear that the GMM approach yields bad results. A possible explanation could be that features extracted from microphone signals corrupted by noise and reverberation are compared with a model trained on clean data. The accuracies for the cross-correlation and similarity signal approach are very similar and nearly perfect. It is also seen that this accuracy is almost independent of the SNR, which can be explained as follows: the white noise affects all frequencies so that the position of the first harmonic in the estimate of
Both the cross-correlation and similarity signal approach perform best in this experiment. However, the similarity signal approach has 2 disadvantages:
Since the similarity signal does not uses any footstep information (i.e. the footstep template) it finds the periods of all reoccurring sounds. This way periodic noises (not encountered here) will definitely deteriorate the performance. The cross correlation approach should not be affected by this since it does not rely on finding reoccurring sounds. The computation of the similarity demands quite a lot of CPU power, while the cross correlation can be computed efficiently.
Considering these facts the cross correlation approach was used for further experiments.
The original system as in [31] (where no precautions are taken against noise, which will serve as baseline) along with all modifications against noise are tested on the simulated dataset with stationary noise (Section 5.1) in 40 Monte Carlos runs, each run randomly changing the noise track and noise source position. Figure 7(A) shows the average errors in meter as a function of the SNR.
Looking at large negative SNRs it is seen that the errors tend to the reference value of 2.61 meter (derived in Appendix). This means that the estimation process failed (a random guess would have been equally good) due to the too harsh noise conditions. For higher SNR levels the errors decrease as expected.
The errors obtained using the original system are only reduced at positive SNR levels (when the footstep sounds are dominant). Since this system has no protection against noise this was the expected outcome.
When a MWF is added to the original system the results improve drastically. The system now starts improving from much lower SNR levels. The additional MWF cleans up the signals before they are fed to the rest of the system. Therefore the rest of the system works with signals with higher SNR levels than the actual SNR of the environment. MWF seems to perform best at higher SNR levels at best reducing the average error by about 70% compared to the original system.
At low SNR levels even greater improvements are obtained when average subtraction is added to the original system. At higher SNR levels average subtraction achieves comparable enhancements as the MWF. At best average subtraction reduces the average error by about 55% compared tot the original system.
Along the individual modifications (MWF and average subtraction) also their combination is tested. This combination (MWF-SRP-AV) yielded the best results reducing the error with 12% and 70% compared to the original system at SNR levels of resp.
Lastly, the significance of these results is tested by means of an ANalyse Of VAriance test (ANOVA test) [15]2
All data points presented in Fig. 7(A) are averages of a finite set of samples. So a difference between two algorithms seen in Fig. 7(A) is possibly due to the specific samples used. Roughly speaking, ANOVA calculates the p-value representing the probability that no difference would have been observed if sets of infinite samples would have been used. When this value is low, the difference of average values between the two sets is said to be significant. More specifically for these results, a low p-value for two data points indicates a reliable conclusion that the algorithm having the lowest average error performs better. In practice, this p-value will be thresholded. When the p-value is
Table 2 shows the averaged estimation errors in meters obtained for the real-life dataset described in Section 5.2. First it is seen that all errors are below the reference value of 1.68 meter (derived in Appendix), meaning that the estimations didn’t fail (a random guess wouldn’t have been better). As similar stationary noise conditions are observed as in the simulated environment, similar conclusions can be drawn. Both MWF and average subtraction achieve improvements over the original system and their combination achieves the best results, reducing the average error by about 60% compared to the original system.
Lastly, the significance of these results is tested by means of an ANOVA test. This shows that all differences of average absolute errors compared to the baseline are strongly significant (p-value < 1%).
Average estimation errors in meters on the real life dataset. SRP stands for Steered Response Power, MWF for Multi-channel Wiener Filter and AV for average subtraction
Average estimation errors in meters on the real life dataset. SRP stands for Steered Response Power, MWF for Multi-channel Wiener Filter and AV for average subtraction
Accuracy of the footstep detection algorithms on the simulated dataset using non-stationary noise in terms of accuracy

(A) Average estimation errors in meters of all footsteps of all Monte Carlos runs in meters on the simulated dataset using non-stationary noise. The markers “O” indicates the use of a MWF. Dashed lines indicate the use of average subtraction (AV). The names in the legend indicates the algorithms used: SRP stands for Steered Response Power, MWF for Multi-channel Wiener Filter and AV for average subtraction. (B) The ANOVA significance tests, indicating whether or not the difference of results between a modification and the baseline is significant at a certain SNR value.
To further examine the limits of these modifications another experiment is performed. The simulated environment (as described in Section 5.1) is repeated, now using highly non stationary noise. The stationary noise (Gaussian white) as described in Section 5.1 is now replaced with non-stationary noise randomly selected from the CHIME database (the lounge data part) ([10]). This noise file is originally intended to test speech recognizers under low SNR conditions and contains background noise collected in a living room in a real-life situation, i.e. including speech, doors opening and closing and TV playing. This noise is highly non-stationary in terms of fast time-varying spectral content and energy.
First the footstep detection is tested on this data and the results are reported in Table 3. Again the cross correlation and similarity signal methods perform the best. In contrast with the results obtained on the stationary noise dataset, the results now are dependent on the SNR level. In worst situation still an accuracy of 62% can be achieved using the cross correlation method.
Next the performance of the footstep location estimation is tested. The results obtained are shown in Fig. 8(A). Using average subtraction still improves the results. At best average subtraction reduced the error by 33% compared to the original system. But in contrast to Sections 6.2 and 6.3 adding a MWF now doesn’t always improve the results. The calculation of the MWF depends on noise characteristics estimated before the footstep to match these during the footstep (Eq. (15)). Since the noise characteristics are now constantly changing over time the estimated noise characteristics become inaccurate and thereby the MWF becomes inaccurate [11]. Only at the worst SNR levels this inaccurate MWF seems to be an improvement. Further research should be performed on better estimations of the noise characteristics in these scenario’s.
Lastly, the significance of these results is tested by means of an ANOVA test and the results are shown in Fig. 8(B). This test shows that all improvements/deteriorations compared to the baseline >17 cm are strongly significant, confirming the observed trends.
This paper focuses on estimating footstep locations for gathering of clinical information. Here acoustic signals acquired by a WASN are considered. A basic footstep location estimation system that is described in [31] is reviewed and it is discussed that it would have difficulties in noisy environments. This paper proceeds by describing a number of modifications (noise robust footstep detection, MWF and average subtraction) in order to improve the noise robustness. Different acoustic scenarios were simulated and real-life recordings were made. The simulated scenarios were used to validate the footstep detection algorithms and both simulated and real-life scenarios were used to validate the footstep location estimation algorithms.
First experiments were performed on simulated scenario’s with stationary noise which was selected to match a real-life dataset, with an SNR range from −16 dB to 8 dB. On this dataset the footstep detector yielded accuracies of about 95% almost independent of the SNR level using the cross correlation or similarity signal method. The GMM method seemed to be unsuited in this application. It is discussed that the cross correlation method is preferred due too, amongst others accuracy and computational costs. Then the footstep location estimation was tested on this simulated dataset, using the original system as in [31] and all modifications. It is seen there that both MWF and average subtraction achieve improvements over the original system. In fact using the combination of MWF and average subtraction yielded the best results with improvements over the whole tested SNR range (in the best case the error was reduced by 70% compared to the original system). A similar experiment is performed on a recorded real-life dataset with similar stationary noise characteristics confirming the improvements seen in the simulated experiment. Both MWF and average subtraction improved the results and their combination performed the best (at best the error was reduced by about 60% compared to the original system).
Finally, the experiment using the simulated environment is repeated using more difficult, highly non-stationary, noise sources to test the limits of the noise robustness modifications. The footstep detector showed a decrease in accuracy. However the accuracy remained resp. 85% and 62% at SNR levels of resp. 0 dB and −6 dB. Footstep location estimation on this dataset revealed that the MWF modification does not always perform well. It is suspected that noise estimates were inaccurate since the noise characteristics change quickly making the calculation of the MWF inaccurate. This inaccurate MWF only achieves improvements when the SNR level was very low, at higher SNR levels MWF did not improve the performance. Further research should be performed to get better noise estimates in these non-stationary conditions. Average subtraction however still achieved improvement over the whole SNR range (in the best case the error was reduced by 33% compared to the original system).
Footnotes
Acknowledgements
B. Van Den Broeck was funded by a IWT doctoral scholarship (contract 111433). Furthermore, this work was performed in context of following projects: “Adaptation and Learning for Assistive Domestic Vocal Interfaces” (ALADIN) (IWT-SBO project, contract 100049), “Sound INterfacing through the Swarm” (SINS) (IWT-SBO project, contract 130006), “Prevention of Falls Network for Dissemination” (ProFouND) (EC ICT PSP Grant Agreement 325087 This project is funded under the ICT Policy Support Programme (ICT PSP) as part of the Competitiveness and Innovation Framework Programme of the European Union), “Algorithms, Architectures and Platforms for Enhanced Living Environments” (AAPELE) (ICT COST Action IC1303, COST is supported by the EU Framework Programme Horizon 2020), “Dynamical systems, control and optimization” (IAP-DYSCO) (Belgian Science Policy Office IUAP P7/19), “Optimization in Engineering Center” (OPTEC) (KU Leuven Research Council CoE PFV/10/002), Marie Curie INT “Dereverberation and Reverberation of Audio, Music, and Speech” (DREAMS) (funded by the European Commission under Grant Agreement no. 316969) and “FallRisk”. The iMinds FallRisk project is cofunded by iMinds (Interdisciplinary Institute for Technology), a research institute founded by the Flemish Government. Companies and organizations involved in the project are COMmeto, Televic Healthcare, TP Vision, Verhaert and Wit-Gele Kruis Limburg, with project support of IWT.
Reference value for estimation errors
In order to verify the results of the footstep location estimation experiments a reference is needed for the different environments because the expected error will of course scale along with the room size. I.e. in the simulated
Let’s consider a
This value can serve as a reference representing an upper bound for the estimation error in a particular room. When an estimation error comes near this reference the process failed because a random guess would have been equally good. Only when the estimation error is below the reference an improvement is made.
When combining Eq. (23) and Eq. (24) a difficult quadruple integral is formed. However numerical approximations can easily be made with high resolution (here