
Abstract
An increasing number of sensors are being deployed in business-critical environments, systems, and equipment; and stream a vast amount of data. The operational efficiency and effectiveness of business processes rely on domain experts’ agility in interpreting data into actionable business information. A domain expert has extensive domain knowledge but not necessarily skills and knowledge on databases and formal query languages. Therefore, centralised approaches are often preferred. These require IT experts to translate the information needs of domain experts into extract-transform-load (ETL) processes in order to extract and integrate data and then let domain experts apply predefined analytics. Since such a workflow is too time intensive, heavy-weight and inflexible given the high volume and velocity of data, domain experts need to extract and analyse the data of interest directly. Ontologies, i.e., semantically rich conceptual domain models, present an intelligible solution by describing the domain of interest on a higher level of abstraction closer to the reality. Moreover, recent ontology-based data access (OBDA) technologies enable end users to formulate their information needs into queries using a set of terms defined in an ontology. Ontological queries could then be translated into SQL or some other database query languages, and executed over the data in its original place and format automatically. To this end, this article reports an ontology-based visual query system (VQS), namely OptiqueVQS, how it is extended for a stream-temporal query language called STARQL, a user experiment with the domain experts at Siemens AG, and STARQL’s query answering performance over a proof of concept implementation for PostgreSQL.
Keywords
Introduction

OptiqueVQS in an OBDA scenario over relational databases.
The advances in pervasive computing and the emergence of low cost wireless and non-intrusive sensors open up new possibilities for industries such as oil and gas, power, mining, and agriculture [26,41,42,45]. For example, operators can recognise hazardous conditions by actively monitoring stream sensor data coming from plant equipment such as pumps, motors, and turbines, or analyse historical sensor data in the event of a problem for a proper diagnosis. The operational efficiency and effectiveness of business processes rely on domain experts’ agility in interpreting data into actionable business information, so as to give reactive and proactive responses with respect to important data patterns appearing in data streams [62]. However, domain experts, who have extensive domain knowledge, may or may not have technical skills and knowledge on databases and formal textual query languages for stream-temporal data sources, such as CQL [3], C-SPARQL [6] and STARQL [36], to specify and extract data of interest [47]. Therefore, centralised approaches are often preferred. These require IT experts to translate the information needs of domain experts into extract-transform-load (ETL) [16] processes in order to extract and integrate data possibly from disperse data sources. Domain experts then apply predefined analytics over the delivered data. However, such a workflow is too time intensive, heavy-weight and inflexible given the high volume and velocity of data.
Turnaround time between an important event and a possible reaction could be reduced drastically, if domain experts could directly specify and isolate important data fragments rather than having IT experts in the middle. A simple example could be shutting down an overheated turbine; however, an event could also be of a more complex nature involving more than one sensory source and static data. Visual query formulation [12] is a viable approach as it aims to lower the knowledge and skill barriers to a minimum. In this context, ontology-based visual query formulation is gaining attention as ontologies come with certain benefits compared to visual query formulation over database schemas (cf. [50]). Firstly, ontologies, i.e., semantically rich conceptual domain models, present an intelligible solution by describing the domain of interest on a higher level of abstraction closer to the reality. Secondly, the federation and reasoning power of ontologies are very valuable (cf. [18]) for addressing scenarios where data is distributed, incomplete or conflicting. Finally, ontology-based data access (OBDA) approach extends the reach of ontology-based querying from triple stores to relational databases [27,38,57]. In OBDA, end users formulate their information needs into queries using a set of terms defined in an ontology. Ontological queries could then be translated into SQL or some other database query languages through a set of mappings linking the ontology and the underlying data sources, and executed over the data in its original place and format automatically.
Although a considerable amount of work exists on ontology-based visual query formulation for SPARQL, it is limited for ontology-based visual stream-temporal querying (cf. [50]). Therefore, OptiqueVQS [49,52,53], an ontology-based visual query system (VQS), has been extended for stream-temporal querying upon the requirements provided by Siemens AG2
In what follows, Section 2 introduces the Siemens case and OBDA. Section 3 presents STARQL and OptiqueVQS interface with stream-temporal querying. Section 4 presents a computational experiment with STARQL and a user experiment with Siemens’ domain experts. Finally, Section 5 presents the related work and Section 6 concludes the article.
Siemens presents a real and large-scale industrial use case, which drives the research presented in this article on ontology-based visual query formulation for stream-temporal data sources. The use case is also important to demonstrate that OBDA over legacy relational databases plays a pivotal role for the integral and wide-ranging proliferation ontologies and ontology-based approaches in the industry.
The Siemens use case
Siemens service process for reactive tasks.
Siemens produces a wide range of complex appliances, such as gas and steam turbines, generators, and compressors, which are used in business-critical processes, including power generation, in energy sector. Therefore, in order to prevent high downtime costs, Siemens runs several service centres, each responsible for remote monitoring and diagnostics of such many thousands of appliances. Data is stored in several thousand databases with varied schemas and the size of the data is in the order of hundreds of terabytes, e.g., there is about 15 GB of data associated to a single turbine, and it currently grows with the average rate of 30 GB per day [26]. Service centres have two main categories of tasks:
reactive tasks: engineers become active once a problem is reported by customers, and then query and analyse time-stamped sensor data distributed across multiple sources;
and predictive tasks: data received from the appliances is actively monitored, and pre-defined patterns are detected in the incoming sensor and event data for early diagnosis.
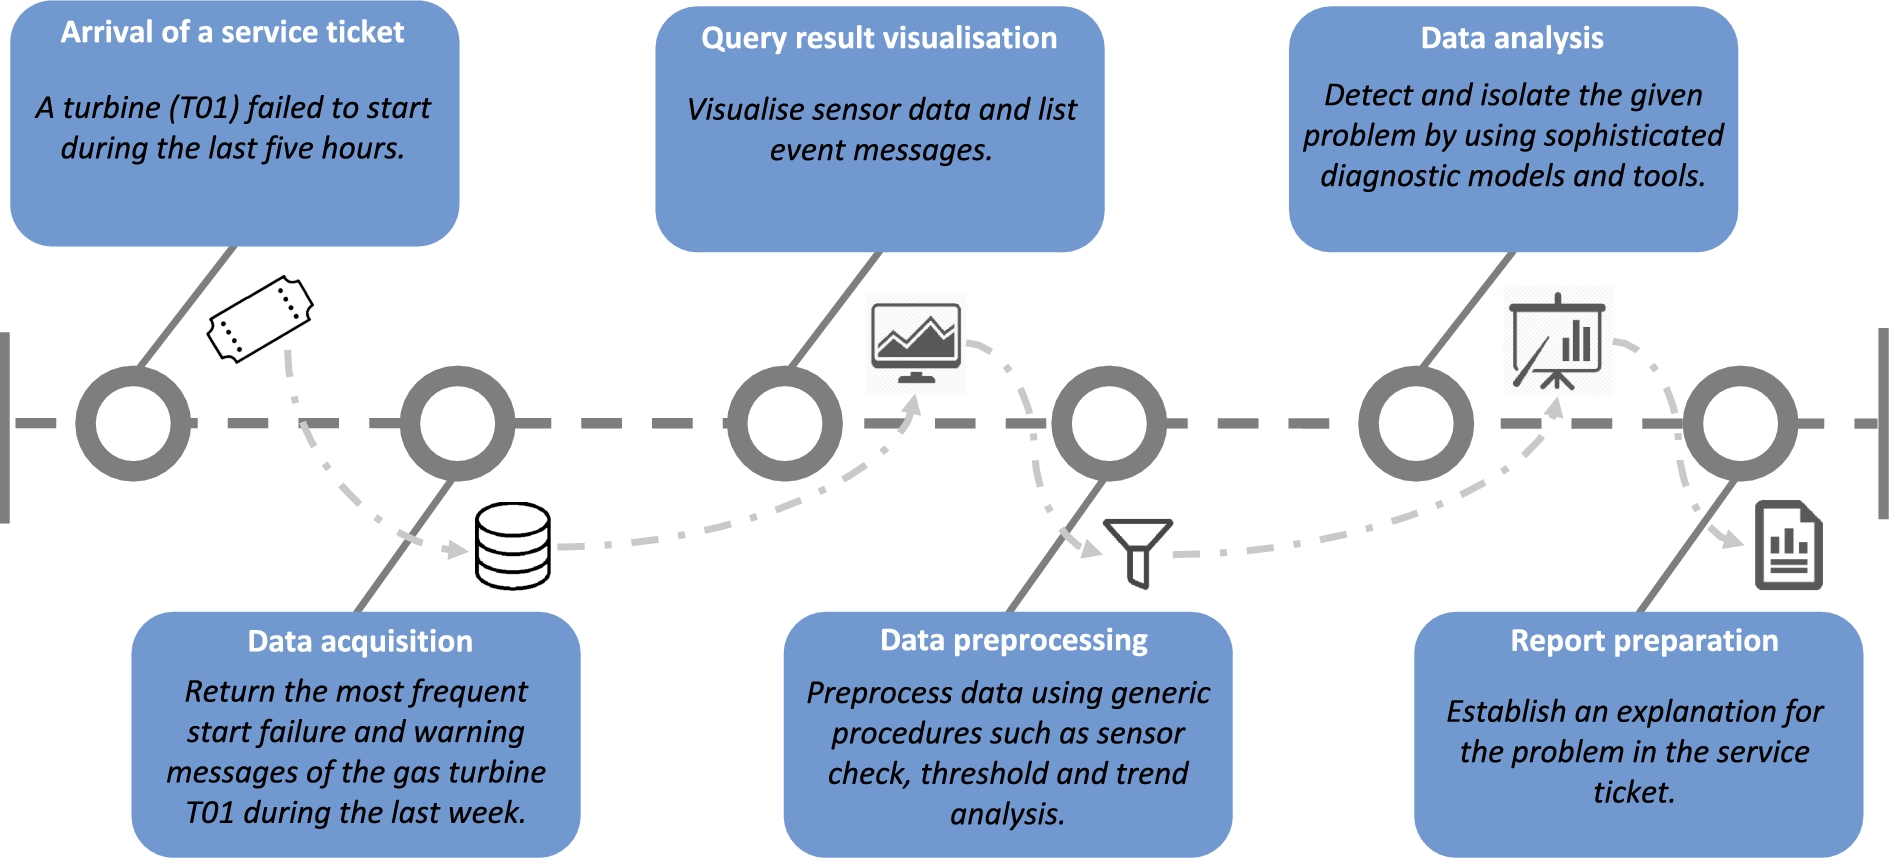
Figure 2 presents the service process triggered after a malfunction of a unit (i.e., reactive scenario) [26]. In this case, a service ticket requesting assistance is created either manually or automatically by a diagnostic system. The ticket often has very limited information concerning the location and cause of the problem. Service engineers query databases containing sensor and event data (i.e., data acquisition) through manipulating 4.000 predefined queries and query patterns. In case these are not sufficient, an IT expert has to be involved to create a new query or query pattern. Standard diagrams are used to visualise sensor data and event messages are listed in excel spreadsheet with timestamps and other attributes. Data then is pre-processed manually using generic procedures in order to, for example, see whether the sensor data quality is appropriate or not. The engineer uses sophisticated diagnostic models and tools, such as principal component analysis or other statistical methods, to analyse and detect the given problem based on the pre-processed data. Finally, the process is terminated when an explanation for the problem is found. The process for predictive analysis is similar, but have to be applied online to streaming data with minimal user intervention.
For situations not initially anticipated, new queries are required, and an IT expert familiar with both the power plant system and the data sources in question (e.g., up to 2.000 sensors in a part of appliance and static data sources) has to be involved to formulate these queries. Thus, unforeseen situations may lead to significant delays of up to several hours or even days due to miscommunication, high workload of IT personnel, complexity of query formulation, and long query execution times. In average, up to 35 queries require modification every month, up to 10% of queries are changed throughout a year, and several new queries are developed monthly [26].
With few built-in features for manipulating time intervals, traditional database systems often offer insufficient support for querying time series data, and it is highly non-trivial to combine querying techniques with the statistics-based methods for trend analysis that are typically in use in such cases. By enabling engineers to formulate complex stream-temporal queries on their own with respect to an expressive domain vocabulary, IT experts will not be required anymore for adding new queries, and manual pre-processing steps can be avoided. This would lead to (i) timely-decision making, (ii) augmented value creation by redeploying freed-up time, and (iii) previously unforeseen uses of data through ad-hoc querying.
A significant amount of world’s enterprise data resides in relational databases rather than triple stores. Therefore, ontology-based visual query formulation would not be a pragmatic solution for industry without technologies for ontology-based data access over relational databases. OBDA technologies, such as Ontop [9], Mastro [14], and Ultrawrap [43], make it possible to virtualise RDF graphs from relational databases and enable in-place access to relational data over ontologies without migrating or duplicating any data. Moreover, thanks to OBDA, while using well-established query optimisation and evaluation support available for traditional database systems, one could also (i) integrate data from multiple databases with different schemas by relating each to a common ontology, and (ii) utilise implicit information in query the answering process by relating the whole set of implied information with logical reasoning.
OBDA over relational databases is based on two key mechanisms:
mappings to describe the relationships between the terms in the ontology and their representations in the data sources (i.e., data and database schema);
and query transformation to expand and translate the posed queries (e.g., in SPARQL) into the language of the underlying relational database system (e.g., to SQL).
An example OBDA scenario.
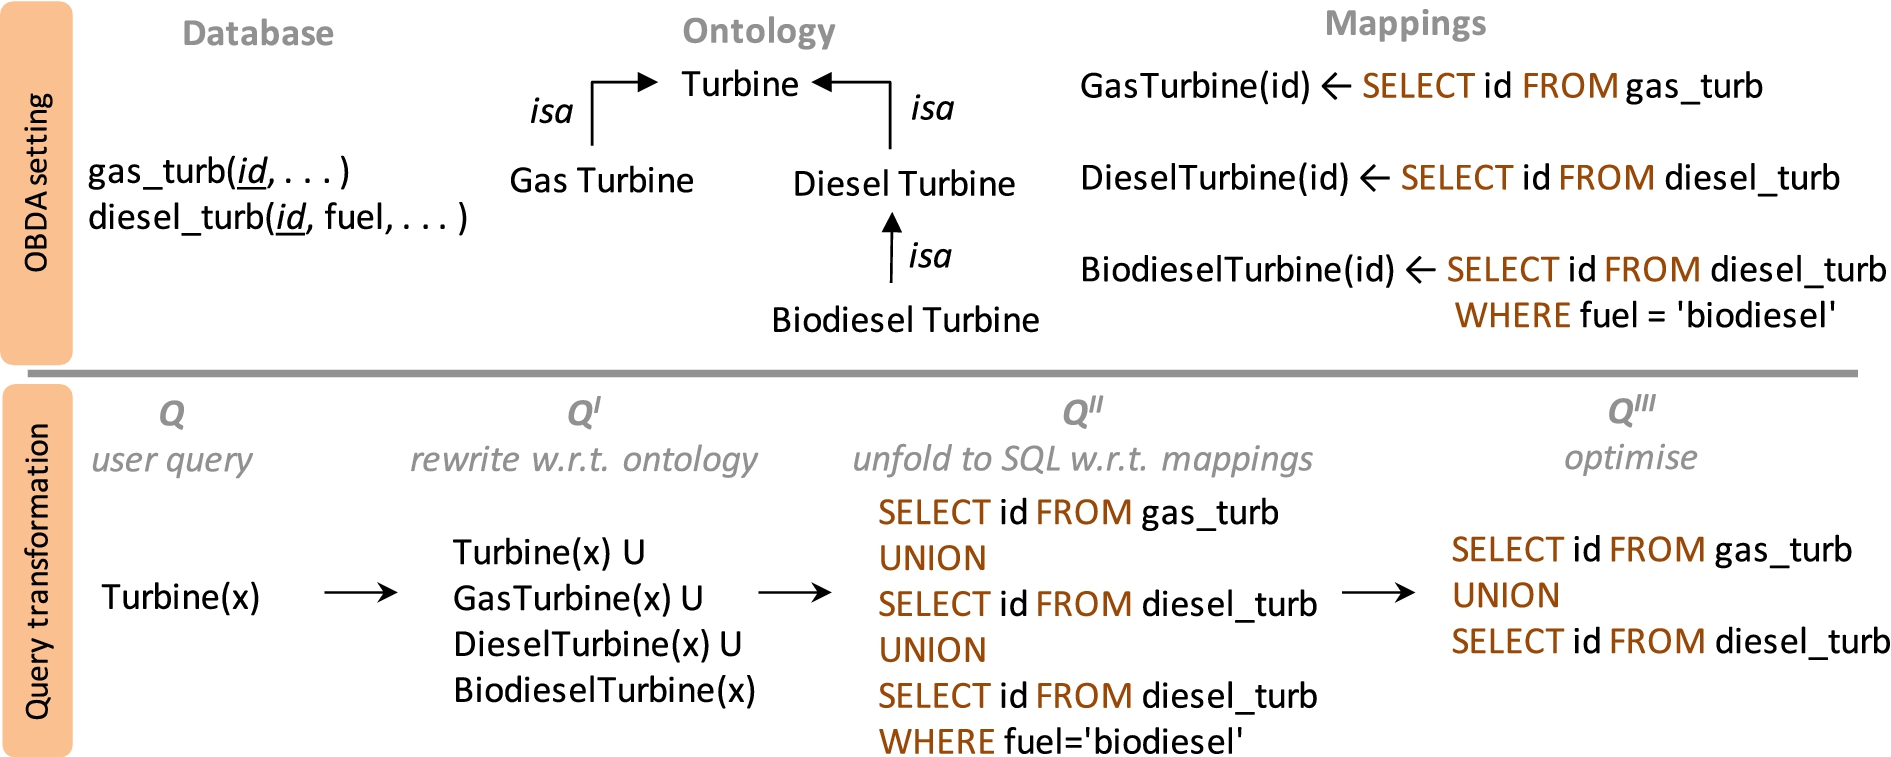
Figure 3 presents a simplified OBDA scenario. The example involves an ontology, in which a turbine could be either gas or diesel turbine. A diesel turbine could have different types depending on the fuel type, such as biodiesel turbine. The corresponding relational database includes two tables, one for gas turbines and other for diesel turbines. The latter has fuel attribute to differentiate between different diesel turbine types. There are three mappings indicating how to construct RDF triples given the data that comes from an SQL query over the data source. A user submits a SPARQL query Q asking for all Turbines. At this point, several query transformations take place (cf. [10]). First, the query is rewritten into Q I taking ontological constrains into account in order to retrieve both explicit and implicit answers. Second, by using mappings, Q I is unfolded into Q II , which is the query in the language of the underlying database system. Finally, the Q II is optimised and transformed into Q III . The example is described considering the Ontop6
In order to ensure that these transformation steps preserve the right semantics of query answering, one should ensure the right combination of ontology and mapping languages. In particular, it has been shown that the combination of the DL-Lite as the ontology language (e.g., OWL 2 QL7
A key benefit of the mapping and query transformation approach is avoiding the representation controversy [33] between ontologies and relational databases (i.e., impedance mismatch) due to their semantic and syntactic differences [46]. By separating transactional and domain perspectives, end users can formulate their information needs into queries in an intelligible manner using the terms coming from an ontology, and get their queries answered efficiently and effectively with OBDA and traditional mature database technologies. Another advantage is that there is no need to chase GBs of data for reasoning to generate all the implicit facts derived by the ontology, since this problem is handled by embedding the consequences of the ontology into the mappings (cf. [19]) – see Fig. 3 for an example.
In an industrial context, OptiqueVQS is meant for domain experts who may or may not have technical skills and knowledge, for example on databases, query languages, programming languages, and semantic web technologies, and usually have frequent, varied, and sophisticated information needs.
Catarci et al. [12] in their review point out that query interfaces combining multiple presentation and integration paradigms have a better potential to address broader user and task types. Therefore, a multi-paradigm approach is in the core of OptiqueVQS’ design and implementation. OptiqueVQS is not concerned with reflecting the underlying formality (i.e., query language and ontology) per se, as this would demand considerable technical background from end users. Full expressivity is also not a goal, as simpler interfaces covering the majority or the essential fragments of end-user information needs are more likely to succeed [11]. Expressivity is intentionally compromised for the sake of usability by targeting frequently needed query fragments with less perceived complexity for the user [54]. Therefore, OptiqueVQS primarily targets tree-shaped conjunctive queries and the essential fragments of STARQL.
STARQL has been selected as an underlying query language for querying temporal-stream data primarily due to its support for OBDA; otherwise, OptiqueVQS could potentially generate queries in any other language. STARQL offers a query framework dealing with streams of timestamped RDF triples with respect to a set of mappings and an ontology. The development of STARQL was inspired by the Siemens use case requirements. STARQL allows expressing typical mathematical, statistical, and event pattern features needed in real-time monitoring scenarios (i.e., expressivity); comes with a formal syntax and semantics (i.e., neat semantics); takes streams of timestamped assertions as input and produces streams of timestamped assertions (i.e., orthogonality); allows selecting an ontology and streams over which the query will be evaluated (i.e., scope locality); allows storing and re-using often-used query patterns (i.e., library functions); and uses roughly same STARQL queries to query historic data or to query real-time streams (i.e., common interface) [36].
STARQL
STARQL [34–36] provides an expressive declarative interface to both historical and streaming data. In STARQL, querying historical and streaming data proceeds in an analogous way and in both cases the query may refer to static data, i.e., data that do not have a timestamp and hence are considered to hold at every time point. The answers coming from the static sub-query are used for the stream processing in the remainder of the query. This separation between the static and dynamic aspects provides a useful abstraction which eases the query building process.
An example diagnostic task in STARQL.
The relevant slices of the temporal data are specified with a window, a sliding parameter that determines the rate at which snapshots of the data are taken, and a window width. The window, both in the case of historical data and in the case of streaming data, is a moving window containing a reference to the developing time NOW. The difference is that in the case of historical data, the data is read from an ordinary database (such as a PostgreSQL database), whereas in the real-time case the data is coming from a real-time stream source. Moreover, in the historical case, it may make sense to specify windows with a right end-point bigger than the running time NOW (as the data is available) whereas in the stream case this is not possible.
The contents of the temporal data are grouped according to a sequencing strategy into a sequence of small graphs that represent different states. For each state i, (referenced by the keyword
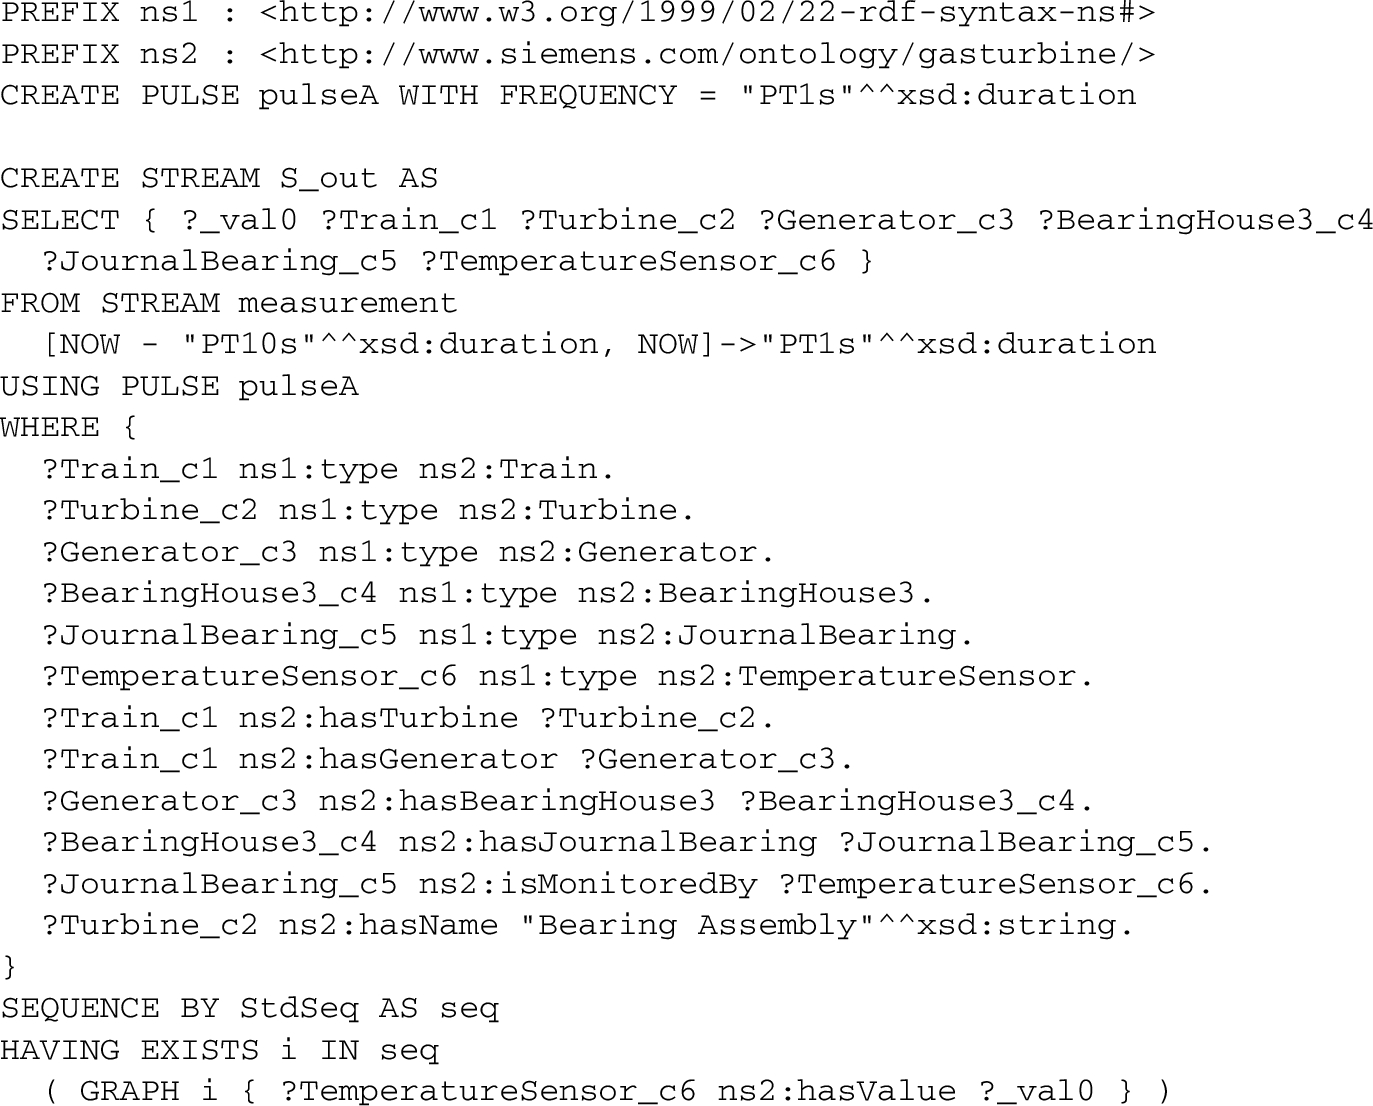
OptiqueVQS (and its underlying engine) follows the OBDA paradigm. Hence, it has to be configured with data sources, an ontology, and last but not least with mappings. The followings illustrate these components and how they are actually used w.r.t. the STARQL query in Fig. 4. The focus is on the historical-data scenario, that is, it is assumed that the stream measurement referenced in the STARQL query is read from an ordinary relational table such as a PostgreSQL table.
The source data is assumed to be stored in relational tables. For example, historical measurement data are stored in a table measurement containing an ID, an attribute for the time of the measurement, the source sensor of the measurement, and the measured value. The structure of trains, turbines, and sensors are stored in various tables containing information regarding which component is attached to which component.
For example, there is a ternary relation for sensors including an identifier, the assembly at which they are attached and a human-readable name, and a similar relation exist for measurements:
These tables and schemata may be quite complex and should be hidden from the user of the VQS. The user should access data via an ontology, a conceptual model containing relevant concepts (such as Sensor, Turbine, Train etc.) and properties/roles (such as hasValue) interrelated via constraints. For example, one constraint of the ontology is invoked in Fig. 4 and it states that all temperature sensors are sensors. Bridging the conceptual (ontology) level with the real-world data (relational databases) is handled by mappings that roughly say how the concepts and properties are populated by objects from the database.
A simple mapping for the static (i.e., non-temporal) concept sensor is given with the following rule:
The right-hand side is an SQL query that selects all sensors identified by an SID and having a name that starts with “TC” (for temperature sensors). The attribute SID is used as a template to generate (virtually) all assertions saying that an object with identifier SID is an instance of the concept TemperatureSensor. The SID is wrapped into a functional term f(SID) in order to overcome the so-called impedance mismatch between the real-world data (such as the values of SID) and that of abstract objects (real temperature sensor, represented by f(SID)).
The mappings for temporal concepts and properties are slightly more complex. In STARQL, temporal concepts and roles (such as hasValue) are used in the HAVING clause in states. One first needs to specify how non-temporal data are mapped in a general mapping schema and then instantiate them with concrete window parameters.
For example, a classical mapping relates the temporal property
The concrete mapping using the window parameters then is the following:
The left-hand side contains a template on a state and the right-hand side extends the mapping for
In classical OBDA, queries are answered by transforming the query according to the ontology and the mappings. This is done automatically by the engines underlying the VQS according to a correct and complete algorithm. The outcome of the transformation may become considerably larger than the more abstract STARQL query. This is illustrated by a simple transformation to PostgreSQL in the evaluation section. For more information on STARQL itself, readers are referred to Özçep et al. [36].
OptiqueVQS is a visual query system rather than a visual query language (VQL), that is, it is based on a system of interactions rather than a formal visual syntax and notation (cf. [17]). This allows OptiqueVQS to offer familiar and informal presentation and interaction styles, while constraining the user interaction so as to enforce the formulation of valid queries.
OptiqueVQS with stream-temporal querying.
OptiqueVQS is designed as a widget-based user-interface mashup (UI mashup) [49,55]. Widgets are standalone, full-fledged, and re-usable applications, which are put together in a common graphical space in order to build a new interface augmenting the user experience [56]. Widgets communicate with each other by broadcasting event messages as a user interacts with them and widgets react automatically to the events depending on their signatures. Such an approach offers flexibility, modularity, and adaptability and enables us to combine multiple representation paradigms, such as forms, diagrams and icons, and interaction paradigms, such as schema navigation, range selection, and matching [12]. A multi-paradigm approach is important to support different user and task types as stated earlier [47,50].

OptiqueVQS with stream-temporal querying – parameter selection.
Since the HAVING clauses of typical STARQL queries are comparatively complex, in OptiqueVQS stream query formulation is separated into two tasks: (i) selecting the exact data stream to query (which values from which sensors, etc.), and (ii) what to do with these values. The second is done by letting the user choose one from a set of templates. Technically, a template computes a HAVING clause, and a list of selected variables for output, based on a variable from the WHERE part, a dynamic property (i.e., whose extension is time dependent) of that variable, and possible parameters instantiated by the user (range intervals, etc.). Some available templates are “echo” for copying values to the result stream, “range” for checking that values are within a given parametrisable interval, and “gradient” for checking that the derivate does not exceed a given value.
OptiqueVQS with stream-temporal querying presents five widgets to a user:
the first widget (W1), see the bottom left side of Fig. 5, is a menu-based widget and allows the user to navigate through concepts of an ontology by selecting relationships between them;
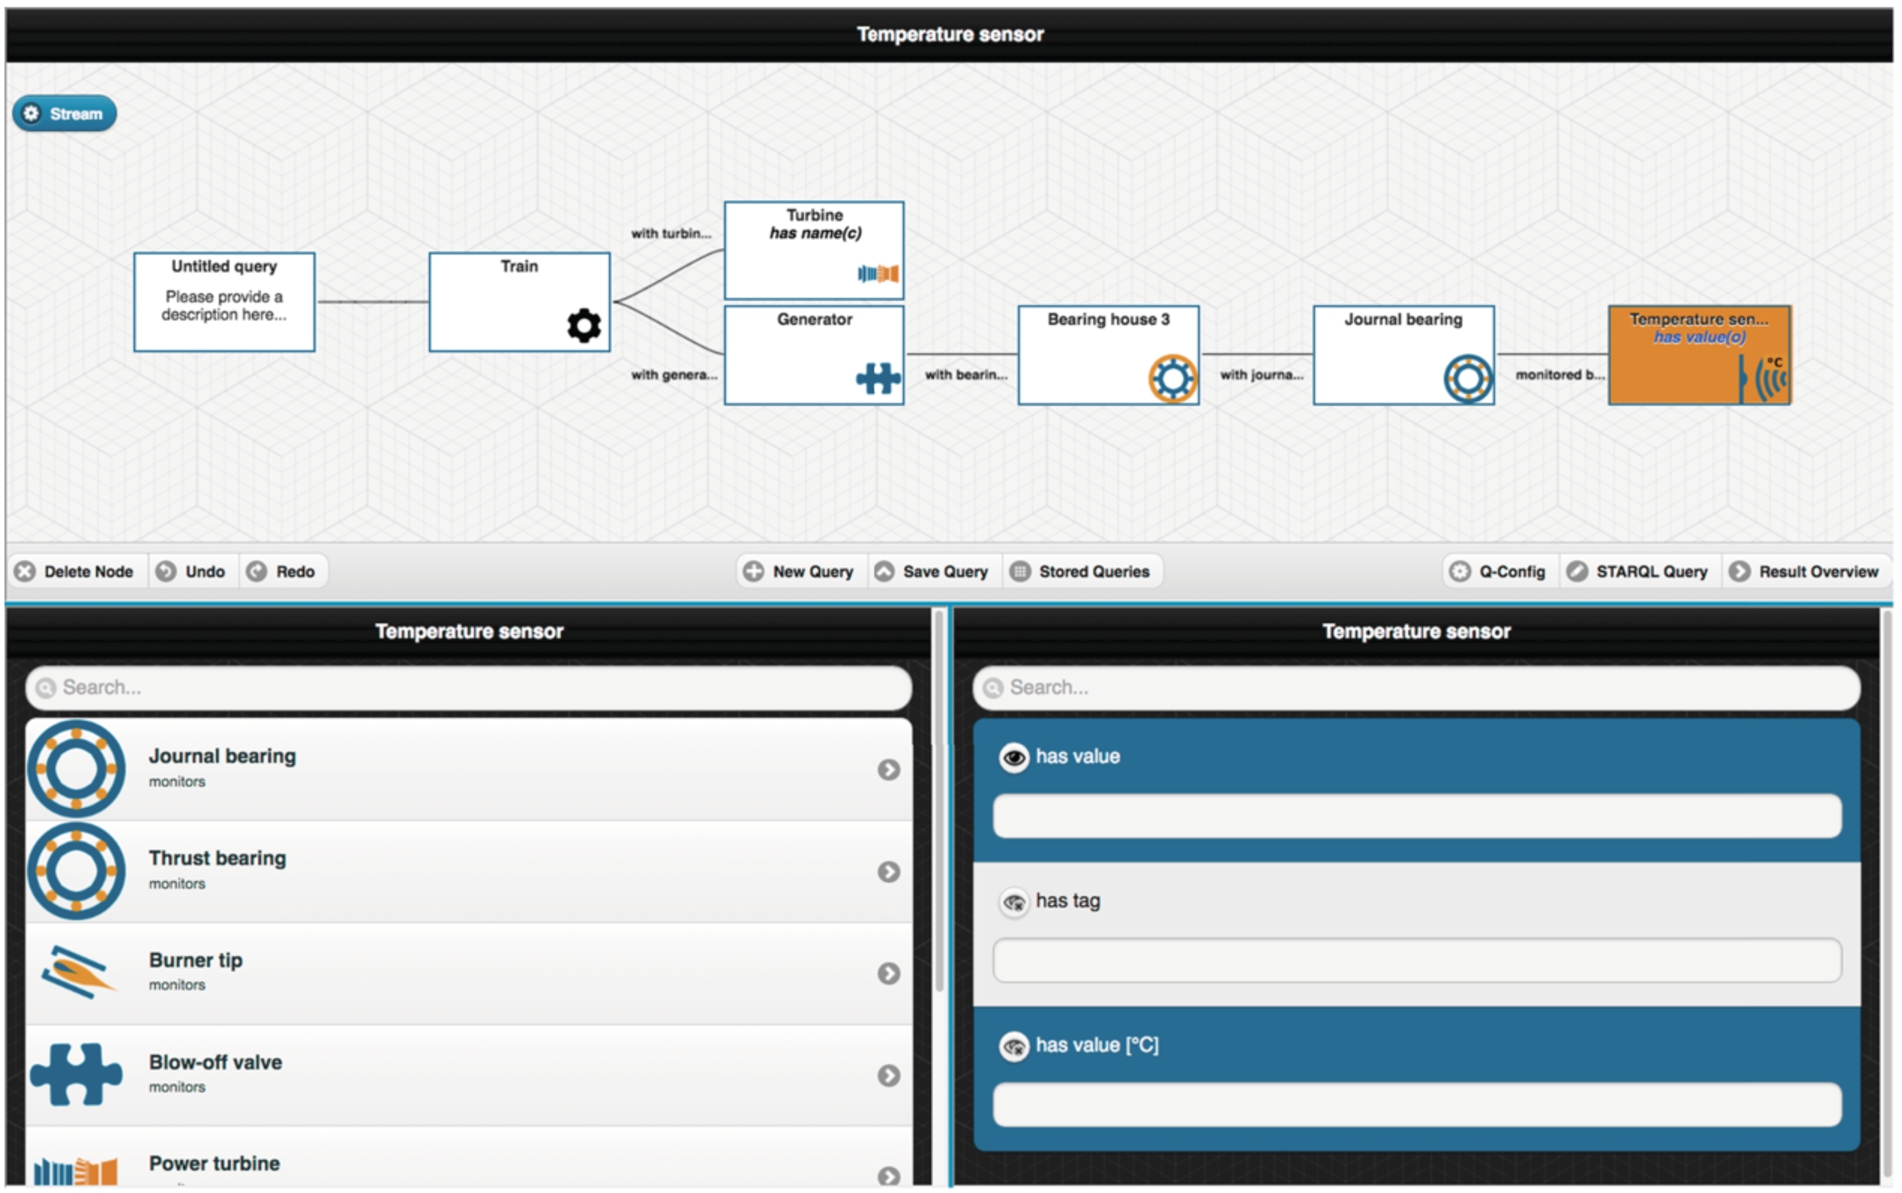
the second widget (W2), see the top part of Fig. 5, is a diagram-based widget presenting typed variables as nodes and object properties as arcs to give an overview of the query formulated so far;
the third widget (W3), see the bottom right side of Fig. 5, is a form-based widget and presents the attributes of a selected concept for selection and projection operations;
the fourth widget (W4), see Fig. 6, is a form-based widget and supports selection of parameters, such as slide (i.e., frequency at which the window content is updated/moves forward) and window width interval, for stream-temporal queries;
the fifth widget is (W5), see Fig. 7, is a tabular widget and allows selecting a template for each stream attribute, which is by default “echo” (this widget is normally used for displaying example results in SPARQL mode).
In a typical scenario8
Demo video:
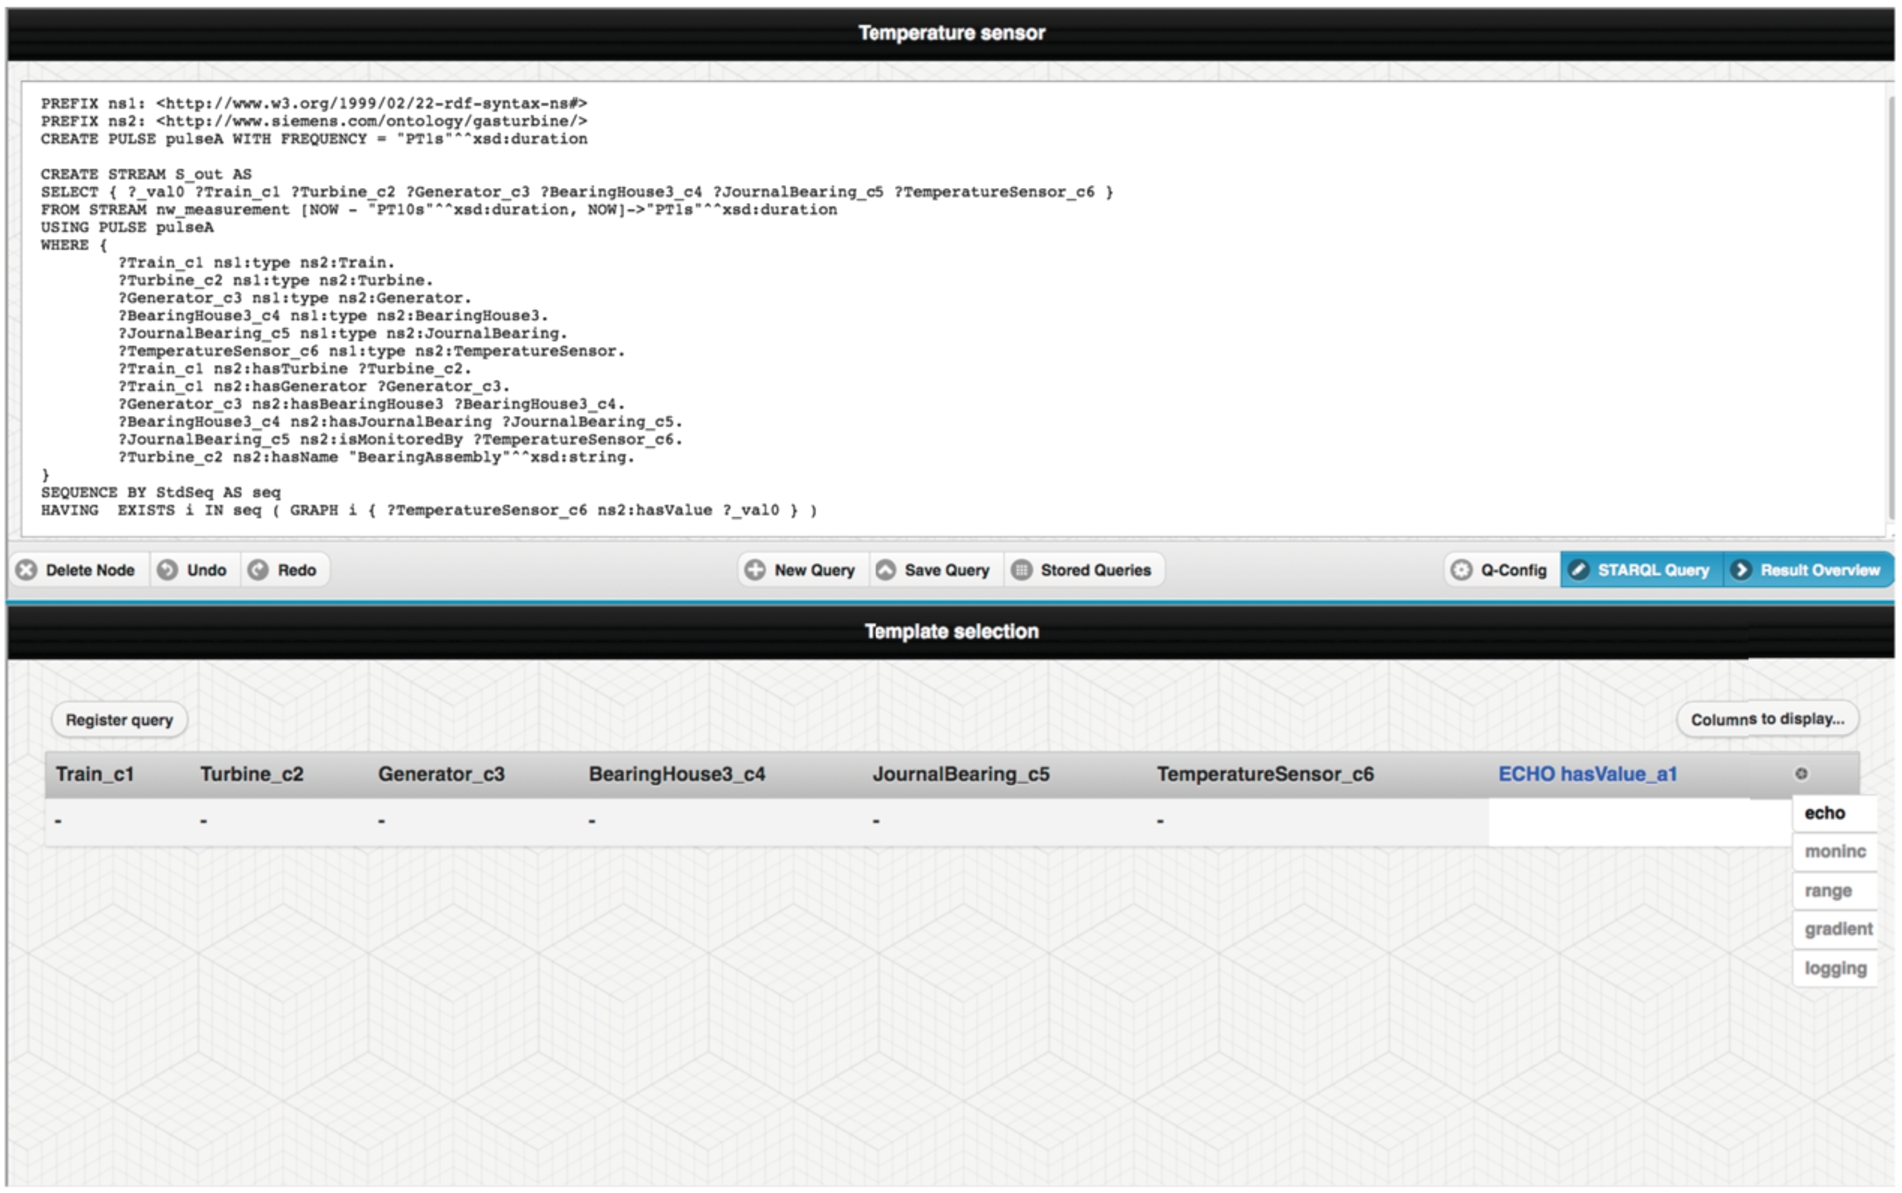
OptiqueVQS with stream-temporal querying – template selection.
In a stream-temporal scenario, dynamic properties are presented in blue by W3. As soon as a dynamic property is selected, OptiqueVQS switches to STARQL mode. A stream button appears on top of the W2 and lets the user to activate W4 for parameter configuration. If the user clicks on the “Result Overview” button, W5 appears for selecting a template for each dynamic attribute. Finally, the user can register the query through W5 by clicking on the “Register query” button. The user can also save and load queries to the query catalogue, that is particularly important since users could use and extend queries written by others as well (i.e., passive collaboration [32]). The example query depicted in Figs 5, 6 and 7 presents the query example given in Fig. 4.
OptiqueVQS has a backend composed of several components [53]. The core component is graph projector [54] enabling a graph-based navigation over an ontology during the query formulation process. It adapts a technique called navigation graph to extract a suitable graph-like structure from a set of OWL 2 axioms [4]. A data sampler component is also a part of the backend and it is used to enrich a given ontology with additional axioms to capture values from data that are frequently used and rarely changed. This includes the list of values and numerical ranges in an OWL data property range. Such an approach allows presenting attributes in different form elements, such as sliders, multi-select boxes, date pickers etc., with respect to the underlying data. Moreover, backend harvests the query log for ranking and suggesting query extensions as the user formulates a query, that is, the W1 and W3 lists concepts and properties adaptively with respect to the partial query the user has formulated so far [48].
OptiqueVQS is free of any SPARQL or OWL jargon and its usability is based on several design choices. W1, W2, and W3 provide a fine combination of ontology exploration (gradual and on-demand) and query formulation. W1 presents valid object property and range concept combinations in pairs for the pivot concept in order to reduce the number of navigational steps. W2 employs a tree-shaped query representation, rather than an arbitrary graph representation, to improve comprehensibility, and inverted object properties to restrict arcs to a single direction (i.e., left to right). Finally, W3 simplifies the type refinement by presenting the subclasses of a pivot in an ordinary form element. Regarding the expressiveness, OptiqueVQS currently supports tree-shaped conjunctive queries (including aggregation and excluding negation) and a restricted fragment of STARQL (e.g., no support for correlating multiple dynamic properties).
A query catalogue involving 40 representative queries for Siemens has been established (non-disclosable). An analysis of the query catalogue shows that 70% of queries are tree-shaped conjunctive queries and 65% are tree-shaped conjunctive queries excluding negation and including aggregation. This means that Siemens’ engineers could potentially formulate 65% of their information needs with OptiqueVQS.
The solution presented in this article has been further evaluated in twofold:
a proof of concept implementation has been realised for the transformation of STARQL queries to PostgreSQL and query execution times have been measured; a user study has been conducted with domain experts from Siemens in order to measure the effectiveness and efficiency of OptiqueVQS.
Transformation of STARQL queries to PostgreSQL
The proof of concept implementation presented in this section is meant to show that the evaluation of STARQL is even possible on standard SQL engines like PostgreSQL. The evaluation strategy is based on the implementation of a system for answering historical queries. This system relies on recorded data and evaluates all temporal windows, which are created by a sliding widow operator, in a single calculation step. Therefore, the implemented transformation process consists of two phases. First, a view is generated that represents the temporal data linked to an additional window identifier (called windowID) that is produced by a window and pulse operator. In the second step the WHERE and HAVING clauses are translated into a second SQL view that evaluates the respective view based on the data aligned to each windowId. In the following, the translation result of the window operator is explained first.
WindowFunction The window operator
As PostgreSQL includes functions for time series generation, the window generation step can be evaluated directly by the PostgreSQL processor (see view Measurement_window in the example of Fig. 8).

A PostgreSQL transformation result for the STARQL window operator.
JoinStream In general, the implementation for a join on different input streams
All input streams are finally joined together based on the pulse frequency pulse_freq (in the example of Fig. 8 from view pulse_pulseA) into the new recalculated joined pulse
DataJoin As soon as the historical window sequence is generated by the function
SequencingFunction The third function (
The schematic transformation result of the transformed window operator for PostgreSQL is shown in Fig. 8.
Transformation of WHERE and HAVING clause The second transformation phase transforms the WHERE and HAVING clauses into a SQL view according to the algorithm presented by Neuenstadt et al. [34]. The resulting view evaluates the calculated windows of the window operator based on the given constraints in the STARQL query. The transformation result of the example from Fig. 4 is given in Fig. 9 (simplified) by the S_out_having view.

A PostgreSQL transformation result for STARQL WHERE and HAVING clauses.
The SQL view consists of two parts: the transformation of the WHERE clause (SUB_WHERE) and the transformation of the HAVING clause (SUB_HAVING) that are both connected by a natural join. Both parts rely on mappings to a database schema of different tables on the PostgreSQL server, e.g., the sensormetadata table, which stores detailed information on all available sensors; while the HAVING clause also evaluates the previous described view of the window operator transformation result by referring to the Measurement_stream view. One can also see how the selection of sensors is restricted in the WHERE clause of the static part to temperature sensors on the BearingAssembly, while the transformed HAVING clause itself does not restrict any sensor types.
This section explained the transformation of historical STARQL queries into SQL that can be directly executed on PostgreSQL servers. The execution times of STARQL queries on a Postgres server are evaluated in the following subsection.
During the evaluation, the STARQL query given in Fig. 4 has been taken and transformed based on the Optique prototype into a SQL based result (see Fig. 9). It has been executed on a reference dataset that includes the signals of 25 sensors. These sensors emit values irregularly over a time of approximately one month. The dataset, which is sampled in seconds, can be seen as a representation of real-world scenarios that also occur in Siemens’ data centres.
Result overview for window operator and query evaluation
Result overview for window operator and query evaluation
Profile information of the participants
Information needs used in the user experiment
The query has been evaluated over a PostgreSQL installation on a machine with a i7 2.4 GHz core and 8 GB of RAM. The standard SQL database executes queries in a process based way, and therefore, cannot distribute its execution directly over cores or machines. The execution time has been measured in two steps. First, the time that is used by the window operator to generate the complete sequence of windows on the whole input data set has been measured and second, the evaluation of all windows with respect to the given queries has been measured.
The results for different window and data sizes can be found in Table 1. They basically show that the query can even be executed on standard SQL engines in the range of one minute, while a larger amount of time is used for the execution of the window operator. That is as expected, because the PostgreSQL engine does not natively support the execution of a window operator.
Furthermore, STARQL has been also tested on distributed and scalable environments having a native window operator like Exareme9
A user experiment has been conducted at Siemens for OptiqueVQS with stream-temporal support [52,54]. The experiment was designed as a think-aloud study, since the goal of the experiment was not purely summative, but to a large extent formative. The experiment was built on a “turbine ontology” with 40 concepts and 65 properties.
Three participants, who cover the relevant occupation profiles, have taken part in the experiment; the profiles of participants are summarised in Table 2. A brief introduction on the topic and tool was delivered to the participants along with a simple example. Then they were asked to fill in a profile survey. The survey asks users about their age, occupation and level of education, and asks them to rate their technical skills, such as on programming and query languages, knowledge on the semantic web technologies, and their familiarity with similar tools on a Likert scale (i.e., 1 for “not familiar at all,” 5 for “very familiar”). Participants were then asked to formulate a series of information needs into actual queries with OptiqueVQS, given at most three attempts for each query. Each participant performed the experiment in a dedicated session, while being observed by a surveyor. Participants were instructed to think aloud, including any difficulties they encountered, while performing the given tasks. Table 3 lists the tasks representing the information needs used in the experiment (tasks 3–5 are stream queries).
The results of the user experiment (c for complete, t for time in seconds, and a for attempt count)
The results of the user experiment (c for complete, t for time in seconds, and a for attempt count)
The results of the exit survey
Once users were done with the tasks, they were asked to fill in an exit survey asking about their experiences with the tool in order to measure user satisfaction. The survey asks users to rate whether the questions were easy to do with the tool (S1), the tool was easy to learn (S2), was easy to use (S3), gave a good feeling of control and awareness (S4), was aesthetically pleasing (S5), was overall satisfactory (S6), and was enjoyable to use (S7) on a Likert scale (again, 1 for “strongly disagree” and 5 for “strongly agree”). Users were also asked to comment on what they did like and dislike about the tool and to provide any feedback which they deem important.
Since OptiqueVQS is a data retrieval (DR) tool, where a single missing or irrelevant object implies a total failure contrary to information retrieval (IR) [5,61], effectiveness is measured in terms of a binary measure of success (i.e., correct/incorrect query) and efficiency is measured in terms of total time taken to formulate a query [47,50]. The results of the experiment are presented in Table 4. In total, 15 tasks were completed by the participants with 100 percent correct completion rate and 66 percent first-attempt correct completion rate; and, on average, a task took 143 seconds to complete in 1.3 attempts. First-attempt correct completion refers to the cases where a user formulates a correct query for a given task at his/her first attempt. One should be aware that query formulation is an iterative process [32,60]; therefore, query reformulation is a natural step. Nevertheless, the results indicate that domain experts could formulate queries with high efficiency and effectiveness by using OptiqueVQS. The feedback provided by the participants through the exit survey is presented in Tables 5 and 6. The usability scores given by participants are quite high and their comments suggest that they did like the design of interface. Users generally praised the capabilities and the design of OptiqueVQS.
The feedback given by the participants
R&D engineers asked for advanced operators such as “OR” and negation, since they, compared to diagnosis engineers, often need to formulate more complex queries. The participants wished for the ability to combine multiple queries and connect concepts that are not directly linked (i.e., non-local navigation [39,50]). Participants also wanted attributes and attribute values in W3 to be filtered automatically with respect to previously selected constraints (including type refinement) – i.e., similar to faceted-search (cf. [59]). Non-local navigation and faceted-search like filtering are challenging with large ontologies and data sources. This is because, for the former, most relevant connections between two concepts must be found, and for the latter, selected constraints must be checked against data to filter out attributes and attribute values.
Overall, the high completion and satisfaction rates suggest that domain experts are quite comfortable with OptiqueVQS’s stream-temporal capabilities. The study also shows that the learnability of OptiqueVQS is high as participants did not receive any substantial training. Earlier, three other user experiments were conducted: one with casual users [49] and two others with domain experts at Statoil and Siemens on non-streaming scenarios [26,53]. These studies revealed similar results and confirmed that OptiqueVQS could address various user types and different scenarios with high efficiency, effectiveness and user satisfaction.
A high majority of work on stream processing is realised in the context of data stream management systems (DSMSs). They mainly extend relational model to support continuous queries with declarative languages analogous to SQL such as CQL [3], TelegraphCQ [13], Aurora/Borealis [24], and PIPES [28]. Notable examples of stream query languages in the Semantic Web are Streaming SPARQL [7], C-SPARQL [6], SPARQLstream [8], RSP-QL [15], CQELS [30], and EP-SPARQL [2]. However, they either have no implemented and/or optimised engine or the engine is still not fully developed [63]. These approaches usually extend SPARQL with a window operator whose content is a multi-set of variable bindings for the open variables in the query. Among them, only SPARQLstream and STARQL support ontology based data access approach. However, SPARQLstream query language does not support historic data and its engine provides no reasoning support, while STARQL does. STARQL also offers more advanced user-defined functions from the Optique backend system like Pearson correlation [25]. Özcep et al. [36] compare and discuss advantages and disadvantages of different approaches.
Visual query formulation is a long-standing endeavour, and as such it has accumulated a considerable number of studies over years. Majority of these studies are within the relational database community (cf. [12]), for instance, query by example (QBE) [64]. Attempts in the semantic web community is quite recent; however, several visual tools exist for SPARQL (cf. [50]). A variety of such approaches could be classified as VQLs, such as RDF-GL [23], Nitelight [44], and QueryVOWL [21]. However, VQLs are still comparable to formal textual query languages as users need to have knowledge and skills to understand the underlying visual notation and syntax. VQSs offer a good balance between usability and expressiveness; examples include OZONE [58], Konduit VQB [1], and gFacet [22]. However, none of these approaches support querying stream-temporal data sources. Only example supporting stream-temporal querying is SPARQL/CQELS visual editor designed for Super Stream Collider framework [40]. The tool follows the jargon of the underlying language closely and; therefore, it is not appropriate for end users without technical skills.
OptiqueVQS is valuable also conceptually as an instance of the end-user programming [31] paradigm in pervasive environments, which aims to empower end users to orchestrate data and objects (e.g., sensors, actuators, and appliances) distributed across the digital ecosystem on their own, such as for activity recognition [29] and self-monitoring [37]. This is because the abundance of data and internet-connected objects render it difficult for IT experts to consider all possible eventualities and develop solutions addressing broader contexts. The OBDA platform underlying OptiqueVQS [18,19] presents an example where ontologies could help building scalable and efficient architectures for data retrieval, integration, and access in pervasive environments.
Conclusion
OptiqueVQS with stream-temporal querying has been developed in an industrial context with real requirements. Its main design goal is to provide a fine balance between usability and expressiveness. Domain experts at Siemens have used OptiqueVQS for querying streaming sensor data with high efficiency and effectiveness. The underlying formal textual query language, STARQL, and OBDA platform, Optique, are mature enough to promote ontologies and OptiqueVQS as a realistic solution for querying dynamic industrial scale data sources.
The future work involves extending the functionality of OptiqueVQS to cover a larger fragment of STARQL, while maintaining its high usability. This includes stream-temporal specific functionalities, such as ability to correlate multiple dynamic properties; and generic functionalities, such as simpler forms of negation and disjunction (e.g., only over data properties). The current widget-based architecture and design of OptiqueVQS provide us with a sufficient room for a sustainable evolution, where new functionality could be distributed to different widgets and complex functionality could be hidden behind layers.