



Abstract
This paper presents results from comparing different Wi-Fi fingerprinting algorithms on the same private dataset. The algorithms where realized by independent teams in the frame of the off-site track of the EvAAL–ETRI Indoor Localization Competition which was part of the Sixth International Conference on Indoor Positioning and Indoor Navigation (IPIN 2015). Competitors designed and validated their algorithms against the publicly available UJIIndoorLoc database which contains a huge reference- and validation data set. All competing systems were evaluated using the mean error in positioning, with penalties, using a private test dataset. The authors believe that this is the first work in which Wi-Fi fingerprinting algorithm results delivered by several independent and competing teams are fairly compared under the same evaluation conditions. The analysis also comprises a combined approach: Results indicate that the competing systems where complementary, since an ensemble that combines three competing methods reported the overall best results.
Introduction
Localization, with an expected 4.4 billion market in 2019 [47], is one of the main pillars for indoor services. Most of the newest applications need to know the user’s location to customize their services [17,20,60], monitor people [9], or track Internet-of-Things objects [41], among others. Moreover, the location can also be used for detecting the user’s activities and to provide services based on them. Accurate positioning is also considered as a fundamental enabling technology for future 5G mobile networks [16,57]
Although the Global Navigation Satellite Systems (GPS, GLONASS, Galileo or Beidou) support location, they cannot operate satisfactory in indoor scenarios due to numerous factors. Many different technologies and Indoor Positioning Systems (IPS) have been proposed to deal with location indoors. In fact, a spectacular growth of studies about indoor location has been witnessed since RADAR [3] was proposed in 2000. The ubiquity of Wi-Fi Internet connectivity and smartphones make Wi-Fi-based positioning very popular [3,11,18,23,38,40,41,46,48,58], despite the diversity of the technologies available for indoor positioning: Radio-Frequency Identification (RFID) [9,33,50], Bluetooth [21,43], ZigBee [49], Ultrasound [27,30,53], Magnetic field variations[14,28], LED light [34,37], Ultra Wide Band [24,26], and Hybrid solutions [32], among others. The IPSs based on Wi-Fi fingerprinting techniques are preferred to those based on the propagation model, angle of arrival, time of arrival and time difference of arrival because they do not require any very specialized hardware, line-of-sight to the emitter, or knowledge about the precise location of radio emitters to operate [69,70].
Wi-Fi fingerprinting is based on the Received Signal Strength Indicator (RSSI) associated to each of the Wireless Access Points (WAPs) that are available and on comparisons to a reference database (or radio-map). This reference database contains a set of previously recorded fingerprints at well-known reference points. The location of a device is commonly determined by computing the distance or the similarity between a fingerprint collected by the device and the fingerprints contained in the reference database [48]. Wi-Fi fingerprinting is a complex subject which can profit from well-established Expert System techniques by implementing advanced machine learning techniques (Bayesian Inference [71], Neural Networks [10,36], Decision Trees [68], and Random Forest [9], among others).
However, there still exists one important drawback which is the lack of a common framework for evaluation and comparison purposes. Appropriate, comparable and reproducible ways of evaluating IPSs is crucial, from research and commercial points of view. Otherwise the scientific advantages on the state-of-art proposals may remain unclear since data, experimental setup and evaluation metrics may be different.
Driven by this objective, the private databases for Indoor Positioning based on Wi-Fi1
Furthermore, it is well-known that the Wi-Fi signal is affected by some factors, including the presence of human bodies [25]. In the previous on-site competitions (see Section 2.3), the participants had to profile the competition environment by themselves the day before competition. So, a simultaneous profiling, where two or more competing teams are profiling the same scenario at the same time, may occur. This simultaneous profiling might have different side-effects on the Wi-Fi signals because the interferences caused by people attending the conferences and competitions might not equally affect all competition teams. For instance, team A employed only one person to profile the scenario and nobody else was present during its profiling, but team B profiled the scenario when it was crowded. If the actor who holds the device is not surrounded by anybody during the evaluation, team A may have higher chances to win because the people distribution is very similar to the one used in the profiling. So the team, which has a people distribution similar to the one in the evaluation, may have a higher chance to win the competition. Moreover, the results presented in these on-site competitions also depends on external factors such as the device used for profiling & positioning or the strategy used for profiling. In summary, the competitors relied on Wi-Fi fingerprinting generated radio maps with different data. Thus, the previous on-line competitions were not only evaluating the accuracy of the proposed IPSs, but also the mapping strategies and the “luck” during profiling. In the EvAAL–ETRI off-site competition, these external factors were not considered, since competitors had the same reference dataset to generate the radio map. So, we consider that the comparison we present in this paper is more representative about the IPS accuracy itself.
A description of the main contributions of this paper are:
We describe the evaluation criteria used to test and compare different Indoor Positioning Systems (IPSs) based on Wi-Fi fingerprinting.
A comparative study of the competing systems under equal conditions. Competitors had the same data, a public database, for fine-tuning and training and they had the same time to provide their estimations on a private unlabeled test set. It is worth mentioning that the competitors had no “inside information” about the private test set and they were not able to over-tune their systems for the competition.
A simple ensemble is introduced, which combines the strengths of the competing systems in a single method. Combining diverse alternatives improves the accuracy of the global system, as for regression and classification systems [19,59,64,65].
The experiences and suggestions reported by the competitors to enhance a common framework to compare IPSs.
The rest of this paper is organized as follows. Section 2 describes the importance of a framework for benchmarking IPSs. Section 3 introduces the off-site Wi-Fi Competition. Section 4 shows the results. Finally, some conclusions are given in Section 5.
This section describes the importance of a common and public available framework for benchmarking IPSs, since open available frameworks allow the meaningful comparative analysis of IPSs. Moreover, it also introduces the current competition details and its relation to previous ones.
Although physical experimentation is used in 77% of indoor positioning research [1], most of these experiments are carried out in areas that are easily accessible to the researcher, such as his own offices [66]. In fact, the typical evaluation scenario covers one, or more, university departments or buildings. This diversity in evaluating IPSs does not allow for comparative analysis, because the situations can be very different. For instance, the experiments carried at the Tampere University of Technology covered part of the Tietotalo building (10000 m2 approx.) [46]. In this work, they collected fingerprints at 96 reference points with a Nokia N900. Their reference dataset contained a total of 206 different WAPs. In contrast, the experimental setup done in [48] covered two three-storey buildings of the University of Minho. In this work, they collected fingerprints at 392 reference points with a laptop computer equipped with three similar USB Wi-FI adapters. Their reference dataset contained data from a total of 101 different WAPs. Although the research, results and conclusions shown in works where experiments are done at the own university are valid, we cannot directly compare them because the scenario, the mapping strategy, the equipment and the Wi-Fi environment radically differ. To make meaningful comparisons between IPSs, they must be tested in the same situation(s).
When IPSs are tested in the same situation, we can rank them given certain criteria. In the vast majority of works present in the literature, the evaluation metric is based on the two-dimensional Euclidean distance between the estimated location and the current one. Although the mean error is the typical choice to evaluate IPSs, it can be very dependent on outliers. Some works alternatively use a certain percentile score, which indicates how likely the system will perform below a given error. The hit or miss rate of an identification of a building, floor, or room can be introduced in the error functions through penalty terms. These rates may be selected as the main ranking criteria in some situations, where spatial error is less important, such as in-home monitoring. In other situation, the computation speed may be crucial.
The performance of the IPSs on these aspects can only be fairly compared if the IPSs are deployed in the same situation.
Open access datasets
In order to compare different IPSs, we must find a common input. Jain [31] calls the workload selection the most crucial part of a system analysis. Particularly, it must be representative of the real application, it must include the impact of external components, and it must allow for repeatability. Open access datasets are ideal for comparing different IPSs, given that they are collected in a way that would also happen in a real application. Since the datasets are static, they allow different researchers to apply their or others’ systems to the same data without much effort.
Two important open access datasets were contributed by the competition organizers. The first one was used in the competition [61] and is discussed in detail in Section 3.2. The other was published recently [63] and covers a single large room, where magnetometer data was collected, in addition to acceleration and orientation. This dataset features trajectories through the room, so that also tracking algorithms can be tested. Another important source of common data is the EVARILOS project [66]. From here, samples can be obtained from different locations, including offices and an industrial-like environment. Finally, some datasets available at Crawdad,5
The EvAAL–ETRI Indoor Location Competition aimed at establishing benchmarks and evaluation metrics for comparing AAL solutions.6
Track 1: “Smartphone based positioning” supported by ETRI;
Track 2: “Foot-mounted pedestrian dead reckoning positioning” supported by ETRI;
Track 3: “Wi-Fi fingerprinting in large environments” supported by UJI-INIT.
Tracks 1 and 2 were on-site and they took place at the IPIN conference venue in parallel to the conference. Competitors were allowed to survey the area the day before the day of the competition, but they could not deploy any external element to support positioning. At the competition, an external actor had to follow a pre-defined competition path, which reproduces the way people move within a big indoor environment. This path was disclosed 30 minutes before the competition. For Track 1 “Smartphone based positioning”, the competitors could use any sensor available on their smartphones. For Track 2, “Foot-mounted pedestrian dead reckoning positioning”, the competitors could use Micro-Electro-Mechanical Systems (MEMS) sensors (inertial, compass, and pressure sensors) for positioning, and external electronic devices, such as tablets or notebooks, for control and monitoring.
Track 3 “Wi-Fi fingerprinting in large environments” was off-site, the competitors had access to a large Wi-Fi fingerprint database, the UJIIndoorLoc database [61], to which they had to apply their algorithms off-line. Competitors only had to implement and set up their localization systems with the open access database. For the competition, a private testing data without labels (ground-truth locations) was provided to the competitors. Competitors had 6 weeks to provide their predictions about indoor location private testing fingerprint. This track is detailed in Sections 3.1 and 3.2.
Evaluating AAL Systems Through Competitive Benchmarking (EvAAL) was the first international competition aimed at comparing indoor localization systems, with its first edition organized in 2011. In 2014, two new competitions were born: the IPIN competition and the Microsoft Indoor Localization Competition – ISPN. The current EvAAL–ETRI competition is the continuation of the previous editions of EvAAL and IPIN competitions.
Previous editions of the EvAAL competition
Evaluating AAL Systems Through Competitive Benchmarking is an international competition aimed at benchmarking both advanced prototypes and commercial products for the Ambient Assisted Living domain with particular attention to Indoor Positioning Systems. The EvAAL Indoor Location Competition was launched in 2011 as an initiative proposed by the universAAL FP77
In the first edition (2011) [12], seven competitors demonstrated their systems at the CIAmI Living Lab in Valencia, Spain in July 2011 [4,5,56]. Each competitor had three hours to install their system, calibrate it, log the measurements and lastly to unmount it and answer a short interview on the system’s details. The second edition (2012) [2] was organized in two tracks. Eight competing systems participated in the first track, which was focused on Indoor Localization and Tracking for AAL, and it was held in July 2012 at the Smart House Living Lab of the Polytechnic University of Madrid, Spain. The second track, with five competitors, focused on Activity Recognition for AAL, and it was held the next week at the CIAmI Living Lab in Valencia, Spain. The third edition (2013) [8] had the same formula as the previous one. Seven competitors participated in the first track, and five competitors in the second track.
This edition also included a demo on Companion Robots for AAL, held on July 2013 at the Peccioli Living Lab in Pisa, Italy.
In general, the competing systems were evaluated by the Evaluation Committee members and staff members who were present during the competition. They gather all the information (accuracy, availability, installation complexity, user’s acceptance and integrability [5]) that was going to be used to compute the final scores. Each edition was officially closed at the annual AAL forum. The forums included a session of short presentations by the competitors and the organizers, followed by a round table for freely discussing localization issues from both theoretical and implementation points of view.
The on-site Indoor Positioning and Navigation Competition was held during the IPIN 2014 Conference at the BEXCO Exhibition Center in Busan, Korea. Similarly to the first three editions of the EvAAL competition, the IPIN competition wanted to establish a well-agreed performance evaluation method for Indoor Positioning Systems as well as to provide opportunities for the participants to learn about the evaluating methods of positioning systems. This competition consisted of two well-differentiated tracks, Smartphone Based Positioning and Foot-mounted Pedestrian Dead Reckoning Positioning, where ten competitors had to use their solutions, making use of the existing environment. During the first day of the competition, competitors set up their IPSs. In the second day, the competition took place with the participants carrying their device along a predefined path marked in the corridors and rooms available in the BEXCO exhibition centre.
Although the previous EvAAL editions and the IPIN 2014 competition have some common features, the IPIN competition was restricted to Smartphone and Pedestrian Dead-Reckoning (PDR) systems. Therefore, the evaluation criteria was based only on the accuracy.
The Microsoft indoor localization competition
The Microsoft Indoor Localization Competition is done in conjunction with the International Conference on Information Processing in Sensor Networks (IPSN). It aims to compare IPSs in the same environment since 2014.
The first edition (2014) [44] took place during the IPSN conference in Berlin, Germany. The evaluation scenario consisted of two 90 m2 attached rooms and a hallway. In the second edition (2015) [45], they repeated the same formula and the competition was held at IPSN 2015 in Seattle, USA. However, the evaluation scenario was larger and covered an area of 1250 m2, it consisted of one exhibition room and an open challenging area (open space with automatic stairs, structural columns & beams, elevator shaft, among other structural elements).
In both editions, the competitors were divided into two main categories: Infrastructure-based and Infrastructure-less technologies. During the first day of the competition, competitors set up their IPSs and deployed their custom hardware if required. Some particular restrictions and conditions were applied for those competitors using custom Wi-Fi in the Infrastructure-free category. Moreover, the valid WAPs for Infrastructure-less category were provided by organizers. During the second day, the organizers evaluated the devices by carrying the device (phone, tablet or laptop) above 20 evaluation points whose position were disclosed the day before. The evaluation criteria adopted was based on the mean error, computed as the Euclidean distance between estimated and real positions over the 20 testing points.
For the 2016 edition, the organizers have introduced some interesting changes. Firstly, the upcoming edition will divide systems into three main categories: Commercial off-the-shelf Technologies, Commercial off-the-shelf Technologies with initialization and Modified Commercial off-the-shelf Technologies. Secondly, the evaluation area will include different elevation characteristics so competitors will be required to report the estimated position in three dimensions.
Off-site Wi-Fi fingerprinting competition
This section introduces the details of the Off-site Wi-Fi fingerprint competition, the datasets used in the competition, the competing teams, the description of the competing IPS, and the description of a simple ensemble that tries to effectively combine the different competing approaches.
Competition details
In contrast to earlier EvAAL, IPIN and MS competitions, the 2015 EvAAL–ETRI competition featured an off-site track. Participants in this off-site track applied their IPSs to a large scale database containing Wi-Fi fingerprints (see Section 3.2). This allowed participants to prepare their systems, off-line and off-site, in advance. Moreover, the competitors had the same data to generate, configure and tune their IPSs. The idea was to estimate the locations of a private set of Wi-Fi fingerprints, whose ground truth was unknown for competition participants. The competition main aim was to fairly compare different approaches for multi-building, multi-floor positioning using a common reference database.
Each competing team had to register by submitting a short description of their IPS. This abstract was evaluated by the independent Technical Program Committee to asses its feasibility. The private test set (see Section 3.2) was released to all competitors in August 7th 2015 and the organizers scheduled the submission of the results (estimated positions) to September 20th 2015. All competitors had one month and a half to prepare their IPSs and submit up to five different sets of estimations. These estimations were evaluated by the competition organizers, who selected the best performing approach according to the mean positioning error for each team. We define the positioning error as the Euclidean distance between the real position where the fingerprint was taken and the estimated position provided by the competing IPS. Although this distance is computed in two dimensions, penalties are added for floor error and building error. In particular, we add 4 m for each wrong floor (absolute difference between the real and estimated floors) and 50 m if the building was not correctly estimated. The results were presented at the IPIN 2015 conference.
The four finalist teams that participated in the off-site competition were:
The
The
The
The
The
The datasets for the off-site competition
The off-site competition’s datasets were collected at the Jaume I University [61]. Researchers of the INIT research group collected fingerprints in three buildings: two buildings with four floors, and one building with five floors. The total covered area is almost 110000 m2, with 520 WAPs scattered through the environment. The fingerprints were stored in three datasets, two of which are publicly available for training and validation purposes, while the third dataset was provided as input data for the competitors’ systems. Ground truth and some information about the user was omitted to perform a realistic evaluation of the competing positioning systems.
The first dataset is the training dataset. It contains 19937 fingerprints, collected at 933 distinct locations. Each fingerprint includes its location. On average, 18 access points are visible in any fingerprint. At 71% of the locations there are 20 fingerprints or more, with up to 80 fingerprints at a single location. At only 2.36% of the locations there are less than 9 fingerprints. The average received signal strength for an access point is
The second dataset is the validation dataset. It contains 1111 fingerprints, collected at 1074 distinct locations, where these locations do not exactly correspond to the locations of the training dataset. Each fingerprint includes its location. On average, 16 access points are visible in any fingerprint. At 98% of the locations there is only one fingerprint, with at most 8 fingerprints at a single location. The average received signal strength for an access point is
The third dataset is the one that was private to the competition organizers. It contains 5179 fingerprints, and only the organizers have access to the locations of where the fingerprints were collected. On average, 16 access points are visible in a fingerprint. The average received signal strength for an access point is
Detailed analysis of datasets
As mentioned in [61], the database contains unprocessed data. So “strange” fingerprints, non-conventional WAPs, and samples taken by low cost-devices were not removed from the datasets. Thus the IPSs accuracy may be considered more general and less device-dependent, in contrast to those works and competitions in which the same device is used for profiling an evaluating a single IPS within one day.
The analysis of the three datasets shows that the training dataset included 367 “strange” fingerprints. RSSI values higher than
Moreover, the number of observed WAPs is also different across the three datasets: 465 WAPs in the training dataset, 367 in the validation dataset, and 270 in the private test dataset. The private test dataset includes 24 WAPs that are not observed in the training dataset. The analysis of the training and validation datasets also suggests that some WAPs were relocated during the data collection process, that some observations of mobile hotspots were included in the samples, or that some observations of point-to-point networks were also included in the samples. This suspicion is supported by the fact that some WAPs were observed in locations with large spatial separation. In particular, 13 WAPs were observed in locations more than 200 meters apart.
Furthermore, 30 different devices (considering device model and Android version) were used to collect the fingerprints and to emulate the problem of samples diversity (see Table 1). To generate the private test set, 3 new devices with recent Android Versions (4.4 or 5.0) and 2 devices, that were already used for training and validation, with a higher Android version were used. These 5 devices collected 40% of the private test set samples.
Correspondence between PhoneID and real device. Real device’s information includes the model description and Android version. TR stands for Training dataset; VL for Validation dataset and PT for Private test dataset
Correspondence between PhoneID and real device. Real device’s information includes the model description and Android version. TR stands for Training dataset; VL for Validation dataset and PT for Private test dataset
The previous facts and database features are of special interest because the competiting IPSs have been built up and evaluated with the data collected over a period that extends almost 2 years, and provided by different devices and different people.
The approach adopted by the RTLS@UM team to address the competition challenge comprises the creation of the radio map and the process used to estimate the positions associated to each one of the samples in the private testing dataset [51].
The following names and conventions are used in the next paragraphs:
Since each team was given access to a training (T) and validation (V) datasets, both datasets including the position (building, floor and latitude/longitude coordinates) associated to each sample, joining both datasets (
Since both datasets (T and V) are made from samples collected by a multitude of different devices, an approach inspired on the work of Laoudias et al. [39] was used to normalize the RSSI values. The normalization process first computes
The position estimation process is based on a hierarchical approach designed for large-scale multi-building, multi-floor settings where computational effort is to be minimized. Given a fingerprint Take Build If Count the number of samples in
This process resulted in a 100% hit rate in estimating the correct building. One advantage of this solution is that it can be implemented by a single SQL query over the radio map database, thus avoiding the effort of computing the similarity between the given fingerprint and all the samples in the radio map. The SQL query that implements steps 1, 2 and 4 above is simply:
and requires that each entry in the radio map be appended with the index of its strongest WAPs (
Floor (f) estimation is achieved by a combination of filtering, k-NN classification, and majority rule-based selection operations, as described by the following procedure:
Build Build If Compute the similarity, Take the Count the number of samples, from within the
In step 2, the idea is to use only the samples in the radio map where the RSSI value is somehow similar (within
After estimating the floor, the geometric coordinates are estimated based on a simple k-NN classification procedure as follows:
Build Compute the similarity, Take the Compute the estimated coordinates as the centroid of the
Note that
The HFTS team competing system
The HFT Team competed with two algorithms: The “Fingerprint Calibrated Weighted Centroid” (FCWC) method and the “Scalar Product Correlation Fingerprinting” (SPCF) algorithm.
The first approach uses weighted centroid to calculate the rover position. For this approach, the position of the WAPs are needed. Since these WAP positions were not known, they were estimated using the calibration dataset of the competition: from the existing RSSI readings of a certain WAP at different test points, the position of this WAP was calculated using weighted centroid. This “reverse positioning” is performed once to generate an WAP position database.
The second approach uses processed fingerprints to estimate positions via k-NN. The SPCF algorithm performed slightly better in the competition. Therefore all numbers and scores in the paper, which belong to the HTF team, have been obeyed with the SPCF algorithm.
Both algorithms are model based: The Frijs equation [22] with modified propagation exponent n (see for example [29]) is used to translate an RSSI value into an inverse distance estimation:
For the FCWC algorithm, the inverse distance is used as weight for the summing of the WAP positions. For the SPCF algorithm, inverse distance vectors are compared using the scalar product as comparison norm:
Where nsp values vary between
The position estimate is obtained by using k-NN with that norm: Those three positions
An important competition task is the building and floor estimation. For both described algorithms, positions are always three dimensional coordinates and comprise
The MOSAIC team competing system
The MOSAIC competition system is based on the Wi-Fi positioning system that was included in the Opportunistic Seamless Localization system [67]. This system defines weights for three distinct situations in Wi-Fi fingerprint comparison. The comparison is between a fingerprint collection that describes the radio map, and a fingerprint that is measured for localization. Each access point in the measured fingerprint is compared with the corresponding access point of a fingerprint in the collection that describes the radio map, for each fingerprint in this collection. The fingerprints in the collection are the mean values of all fingerprints measured at that location during the training phase. In the competition, the team used only the training dataset values.
The three situations are: first, the access point in the measured fingerprint was also measured with some received signal strength in the collection’s fingerprint – defined as a hit; second, an access point in the collection’s fingerprint does not occur in the measured fingerprint – defined as a miss; third, an access point in the measured fingerprint does not occur in the collection’s fingerprint – defined as an extra. The MOSAIC team additionally defined the situation where an access point does not occur in both the measured fingerprint and the collection’s fingerprint – we call this a none.
The MOSAIC system calculates the likelihood of the given situation for each access point in the measured fingerprint. To compute the likelihood of the measured fingerprint, the algorithm multiplies the likelihoods of the access points, assuming that they are independent [7]. By normalizing the likelihood of the measured fingerprint over all locations in the training dataset, the algorithm can calculate the posterior probability distribution of the location given the measured fingerprint. It then selects a location by using k-NN, with
Adapting the MOSAIC system to the competition data representation required little effort. There was a slight difference in location specification: the MOSAIC system uses a relative system without any floors, while the competition data uses an absolute system in different buildings and floors. This only influences the interpretation of the results, it has no influence on the MOSAIC likelihood calculation, which is by design agnostic to the position representation. However, since a k-NN is also implemented, the floors and buildings have to be taken into account. The building and floor identification numbers are weighted by the posterior value, just like the position is, and then rounded to again obtain a building and floor identification number.
The ensemble approach
Ensembles are commonly used in regression and classification tasks to combine a set of individual estimators (classifiers or regressors) [19,59]. The error may be reduced when the individual estimators have a high degree of diversity [64,65].
Here a simple ensemble approach has been developed as a first attempt to fuse the three competing systems in an advanced IPSs. The main idea was to try to combine the strengths of all the competing systems. Although there were four finalists in the competition, only three of them accepted to include their system in the ensemble and participate in the elaboration of this paper. The ensemble works as follows:
Estimate the position with the three competing systems.
Apply a voting procedure to estimate the building. The most often voted building among the three competing systems’ estimations is assigned as the ensemble’s estimated building. The three competing systems’ estimations are equally weighted.
Apply a voting procedure to estimate the floor. The most often voted floor among the competing systems’ estimations is assigned as the ensemble’s estimated floor. Only the competing systems’ estimations which belong to the ensemble’s estimated building are considered in this voting. In case of tie in this second voting procedure, the HFTS system has the highest priority followed by the MOSAIC team.
The ensemble’s estimated coordinates correspond to the RTLS@UM’s IPS if its estimated building and floor correspond to the ensemble’s estimated building and floor. If not, the estimated coordinates correspond to the HFTS’s IPS if its estimated building and floor correspond to the ensemble’s estimated building and floor. If not, the estimated coordinates correspond to the MOSAIC’s IPS.
Return ensemble’s estimated coordinates, floor and building.
The results – error and building&floor hit detection rate – of the three competing IPSs before the competition on the validation set, included in the short description or implemented by the organization committee, have been used to set the priorities in Steps 3 and 4. In particular, the hit rate is used to establish the priorities in Step 3, whereas the error in positioning is used to establish the priorities in Step 4.
Results and discussion
This section introduces the results of a simple baseline method, the competing IPSs and the ensemble approach. Moreover, some discussion about the results and the competition is introduced.
Baseline results
A baseline based on the k-Nearest Neighbor rule (k-NN) [15] is introduced for comparison purposes. In particular, the k-NN algorithm with
Baseline results
Baseline results
According to the results shown in Table 2, the baseline mean error is 8.46 m but the floor hit rare is 85.34%. In all the cases, the building has been correctly estimated.
The results of the competing teams are shown in Table 3. Again, the mean error and the percentile values are based on the positioning error with penalties described in Section 3.1. Moreover, the results of the simple ensemble approach (see Section 3.6) are also included in the table.
Competition and ensemble results
Competition and ensemble results
Contribution of the competing systems on estimating the correct floor
According to the results shown in Table 3, the RTLS@UM IPS provided the best competing results according to the mean positioning error (including the floor and building error penalties) and, therefore, this team was the winner of the off-site track in the 2015 EvAAL–ETRI competition. Moreover, this team also reported the lowest error in most of percentile values. Although the competition metric was the mean error, the EvAAL website reports ranks based on the third percentile for all the tracks. In the off-site track, ranks provided by the mean error and third quartile are identical.
Although the HFTS team reported a mean error similar to the baseline, it provided the overall highest floor hit rate (96.25%). The HFTS’s IPS reduces the wrong-floor errors in a 2.5% with respect to the teams with highest hit rate.
The MOSAIC team provides the third best 25th and 50th (median) percentiles and also the second best Floor hit rate among the competing IPSs. In contrast to the other competing IPSs, it reports a Building hit rate of 98.65% which had a negative impact on the mean error.
The ICSL team reports the second lowest mean error. However, it was the competing team reporting the lowest floor hit rate.
The ensemble approach, which combines the three competing IPSs, provides the best overall results. The three competing systems equally contributed on estimating the building and floor (see Table 4). The coordinates were mainly provided by the RTLS@UM system (96.97% of cases) and the rest were provided by HFTS system (3.03% of the cases). Although the ensemble improvements with respect to the best errors and hit rates are marginal, they are not when the ensemble is compared to
For RTLS@UM system, the ensemble and the individual competing systems. similar errors in positioning but the ensemble provides a hit floor detection rate 3% higher. For HFTS system, both provide similar hit detections rates but the ensemble provides a positioning error about 2.4 m lower. The ensemble takes benefit from the three independent competing systems, it provides the highest floor hit rate and the lowest positioning error.
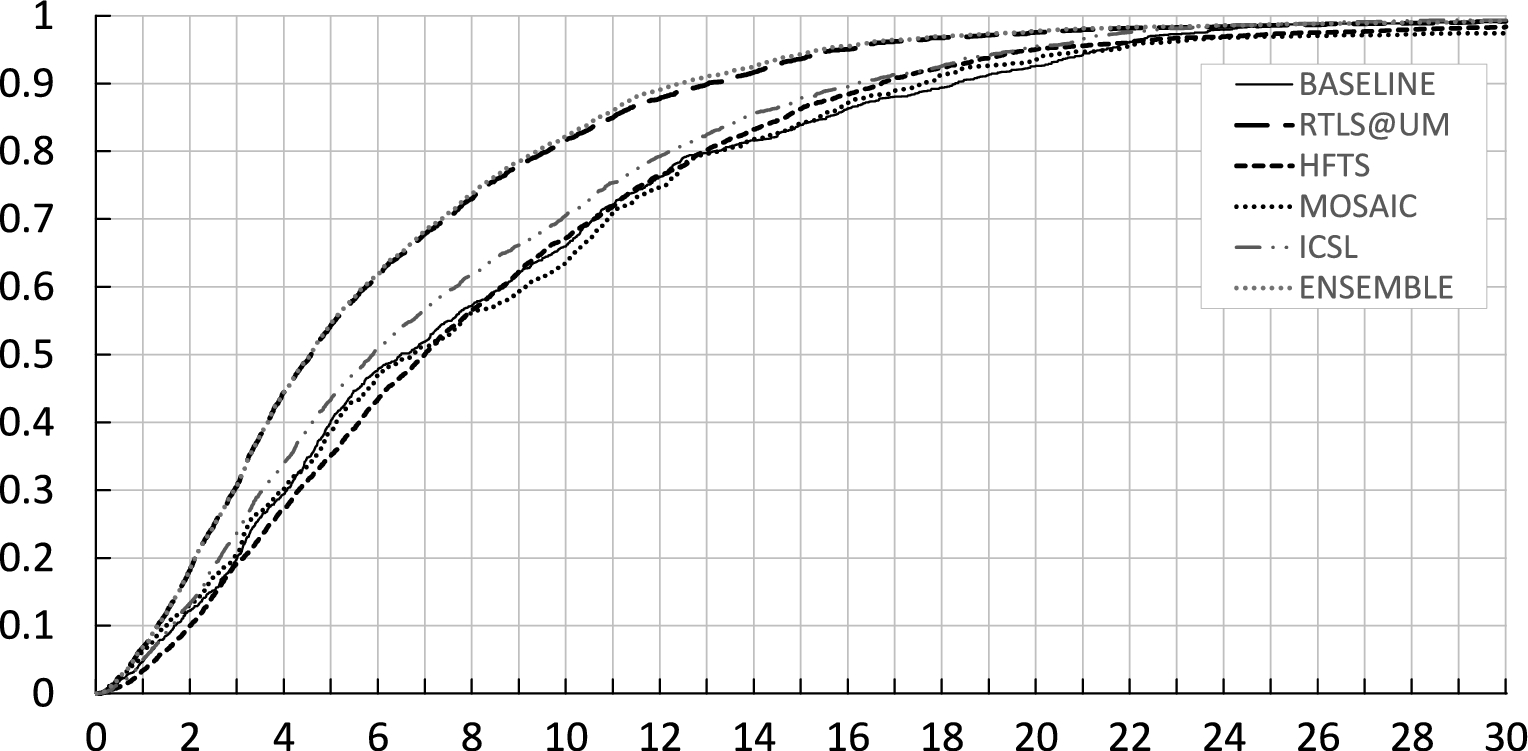
Distribution of the errors in positioning with penalties for the baseline, competing IPSs and ensemble.
Figure 1 shows the Cumulative Distribution Function (error in positioning with penalties) for the baseline, the competing IPSs and the ensemble approach. In the figure, it can be seen that there are two differentiated groups of IPSs. The first group reports the lowest error and it is formed by the IPS developed by RTLS@UM IPS and the ensemble, whereas the baseline and the IPSs developed by MOSAIC and HFTS form the second group. On the second group, the IPS developed by ICSL reports the lowest error. Among the other systems, the IPS developed by MOSAIC tends to be the one until the 35th percentile and the IPS developed by HTFS tends to be the best from 60 to 95 percentile. Although the differences between two IPSs are marginal in some cases, the error function does not explicitly include the floor hit rate. As stated in [10] wrong-floor errors may not be acceptable at all because it is much easier to move within the same floor than among floors. Although the results reported by the ICSL team and the baseline are similar to the IPS provided by HFTS and MOSAIC, they should be discarded due their low floor hit rate.
This section introduces the discussion derived from the competing systems, the results shown and the experiences reported by the competitors.
Improvements on Wi-Fi fingerprinting
This competition has allowed the meaningful comparison of different systems. As pointed out by competitors after the closing session, the results suggested that a hybrid technique might lead to significant improvements in Wi-Fi fingerprinting.
An ensemble approach, which combines three competing systems, has been used and it reports the best overall results according to the positioning error and floor hit rate. Combining diverse systems is useful and tends to reduce the errors provided by the individual systems.
The results of the ensemble approach encourages to develop advanced positioning systems that include different approaches to provide more accurate positioning results.
Metrics used in the competition
The EvAAL–ETRI competition used the mean positioning error with penalties as main performance metric. They also provided information on the cumulative distribution of the positioning error, improving the performance description of the different IPS. Furthermore, the floor and building hit rates were also provided. In practice, these are very relevant metrics, but even more details on the systems could be used to evaluate the performance.
For example, the latency and energy efficiency of the systems could be taken into account, as discussed in [66]. To compare these metrics, they must be deployed on the same or very similar hardware. This increases the complexity of the competition, unless a dedicated testbed is available. However, there is no consensus on what to include when measuring the localization latency.
Additionally, there is research on quantifying the information provided by probabilistic sensor model in localization [6]. The mean mutual information or the conditional entropy can be used as a metric for the performance of the measurement model in a given environment. This separates the measurement model from the ultimate location estimation step. It is necessary, however, that the IPS is probabilistic.
General experiences reported by competitors
In general, the competition was of great interest for the IPIN conference attendees (the session was quite well visited) and the competing teams reported that their experiences at the competition were positive. The RTLS@UM team used the opportunity provided by the competition to evolve their previous estimation algorithms. The MOSAIC team enjoyed joining the EvAAL–ETRI track 3 competition, because of its accessible approach, using the huge fingerprinting database. The HFTS team extended their developments in order to provide the 3D positioning (lat, lot, & floor) with building estimation according the UJIIndoorLoc format. In general, all the teams had to adapt their position estimation systems to the format of the provided datasets, so information and restrictions about other coordintate representations had to be considered.
The competitors suggested some minor improvements for further editions that can be summarized as follows:
All competitors should be more involved in the elaboration and review of the competition technical annex. After registration deadline, all competitors could provide ideas to improve the competition via, for instance, the competition mailing list. The process to join the competition and report the results should be simplified. In the current competition, the competitors had to submit an extended abstract and a short paper before the conference, which introduced some delay in the evaluation process. Submitting an extended abstract detailing the competing IPS and results on the public datasets should be enough to join the competition. Writing a paper reporting the results should be a post-conference optative step. The dates for delivering the datasets should be known in advance. In order to analyze the scenario and IPS fine-tunning with public datasets, they should be released as soon as possible. The private test dataset should include more information about the specific device and the user who collected it. According to the competitors, it would be realistic and enable the use of more advanced estimation techniques, such as Predicted k-Nearest Neighbours [42], which uses recent past information of users to improve the accuracy of the localization algorithm. The public and private datasets should be extended to include more recent data, new buildings, new devices to collect the fingerprints and, even, new sequences of fingerprints emulating user trajectories at different speeds.
Conclusions
This paper introduces the results of the 2015 EvAAL–ETRI competition, Track 3 “Wi-Fi Fingerprinting in large environments”. The data used to train and fine-tune the IPS were open access and they were generated using information provided by different users and devices to emulate the problem of samples diversity. As far as we know, it has been the first off-site competition on Wi-Fi fingerprinting where all the participants competed in equal conditions in such large indoor scenario, which was formed by three multi-storey buildings.
Another advantage of the off-site competition was that the competing teams did not have to deploy and configure their systems on-site. Moreover, competitors had enough time to fine-tune their systems with public datasets. In contrast to other on-site competitions, all the competing teams completed their tasks and none of them had to quit the competition.
To allow meaningful and comprehensive comparisons of IPSs, it is necessary to have a common comparative framework. In fact, the use of common public databases and evaluation metrics made possible the fair comparison of the competing systems and the development of an ensemble, which reported the lowest overall error and the highest overall floor hit rate.
The competition had a winner, the RTLS@UM team, which reported the lowest mean error. Other measures, such as the floor hit rate and the distribution of errors, indicate that the other competing systems also reported interesting results. The competitors employed different approaches to develop their respective positioning systems. In fact, three different competing approaches have been successfully combined in an ensemble, which obtains the best overall mean error and the best overall floor hit rate. A set of diverse classifiers has outperformed any of the individual systems that composes it.
Finally, off-line competitions, such as the current one, are useful according to the experiences reported by the competitors. The competitors had not only the opportunity to compete and rank their systems, but also to analyze and compare different alternative and complementary ways to deal with Wi-Fi fingerprinting.
Footnotes
Acknowledgements
We would like to thank Francesco Potortì, Paolo Barsocchi, Michele Girolami and Kyle O’Keefe for their valuable help in organizing and spread the EvAAL–ETRI competition and the off-site track. We would also like to thank the TPC members Machaj Juraj, Christos Laoudias, Antoni Pérez-Navarro and Robert Piché for their valuable comments, suggestions and reviews.
Parts of this work were funded in the frame of the Spanish Ministry of Economy and Competitiveness through the “Metodologiías avanzadas para el diseño, desarrollo, evaluación e integración de algoritmos de localización en interiores” project (Proyectos I+D Excelencia, código TIN2015-70202-P) and the “Red de Posicionamiento y Navegación en Interiores” network (Redes de Excelencia, código TEC2015-71426- REDT).
Parts of this work were funded in the frame of the German federal Ministry of Education and Research programme “FHprofUnt2013” under contract 03FH035PB3 (Project SPIRIT).