
Abstract
WiFi-enabled buses of the Public Transportation System (PTS) may be employed as the backbone of a metropolitan delay tolerant network that exploits ad hoc connectivity and predictable bus mobility to deliver non-real time information. In this paper, we discuss and study the feasibility of a Mobile Delay Tolerant Networking (MDTN) solution deployed over an actual PTS to provide service opportunistic connectivity. Our solution follows an opportunistic carrier-based approach where buses act as data collectors for users’ requests involving Internet access. Obtained results demonstrate that MDTN represents a viable approach able to provide delay-tolerant service access. To support our claim, we have carried out a set of simulations considering MDTN coupled with state of the art routing protocols deployed over a near-to-real scenario: the PTS of Milan, Italy.
Introduction
The mobile revolution has boosted user demand for smart mobile services, which are generally offered based on infrastructure connectivity. Yet, infrastructure/based networks like the Internet suffer from the so-called last mile problem; i.e., the lack of a complete coverage area. Alternate access methods like cellular networks present a viable alternative, however the former are under stress, experiencing an ever increasing mobile data traffic growth [9]. To this end, a lot of research efforts have been devoted to find new and decentralized solutions bridging current demand while alleviating the burden from the infrastructure [5,11,15,25].
Recently, new opportunities have arisen thanks to the widespread and growing availability of mobile devices equipped with a wireless interface. In particular, Opportunistic Networking (ON [4,6,26,29]), in terms of involving multi-hop delay/disruption tolerant networking (DTN [8]), has proven to be a viable alternative to infrastructure-based connectivity: it can provide service coverage where infrastructure connectivity is not available with no extra charge for the users. Indeed, delay tolerant techniques have gained a lot of popularity in interconnecting mobile users’ in an ad hoc fashion, providing service connectivity by leveraging on node mobility to reach infrastructure end-points [12,29].
Solutions exploiting human mobility to move data between endpoints have been extensively studied; however, the unpredictability of the human behavior poses severe challenges to network management. Instead, opportunistic approaches exploiting a Public Transportation System (PTS) as a routing backbone have proven to be more viable than their human counterpart, mainly due to a higher predictability of nodes mobility. Indeed, buses move along pre-determined paths and follow an a priori known schedule. In these settings, routing algorithms can be devised on reasonable assumptions and probabilistic predictions of future encounters [2,10].
In this context, it is interesting to study network scalability when deployed on large areas, with a growing number of bus lines and a potentially huge offered load. Moreover, since size and shape of bus lines are limited by human and organizational factors, network delivery delay may ramp up with the covered area due to the increasing number of hops each packet must traverse.
To this end, we discuss and analyze the performance of Mobile Delay Tolerant Networking (MDTN): a delay tolerant service platform built on top of the PTS able to provide opportunistic connectivity, for use in scenarios where Internet connectivity is missing or cost-attributed. Once the user gets on-board the carrier (e.g., a bus), it establishes a connection with the on-board Base Station (BS) hosting the MDTN server and issues a request. The request consists of a content identifier, e.g., an Uniform Resource Identifier (URI) and a destination bus line where the user is going to pick up the response later on. The goal of MDTN is to provide the user with the desired content at the specified line.
Our proposal involves multi-hop routing of both user request(s) and response(s) to/from infrastructure endpoints (Internet-enabled) and end-users leveraging our platform. This is achieved by implementing a delay tolerant, store-carry-and-forward, communication model where a mobile user can delegate a request for a service involving Internet access to a carrier entity embodied by a BS on a bus.
We study the performance trend of our MDTN through a simulation analysis. To this end, we have implemented a near-to-real deployment scenario where carriers are public buses with routes corresponding to the actual PTS lines in the city of Milan, Italy. The end-users of our platform are mobile entities operating handheld wireless devices or wireless sensors and actuators of a city utility network to be connected to the Internet.
The rest of this paper is organized as follows. Section 2 provides some background information related to the opportunistic networking paradigm. Next, in Section 3 we discuss related work pertinent to the domain of interest, pointing out similarities and pitfalls of existing solutions. Section 4 provides insights about MDTN, describing some representative case studies exemplifying the targeted scenarios and discussing its modus operandi and protocol design. In Section 5 the simulation environment is described and in Section 6 simulation results are discussed. Finally, Section 7 concludes the paper.
Background
ON can be considered as a special case of DTNs where an end-to-end path between the source and the destination may not exist and unplanned contact opportunities are exploited to implement routing/forwarding [27]. Differently from the original outer space DTNs, where an estimation of delivery delays can be computed in advance due to some degree of determinism of system variables, opportunistic networks are characterized by unpredictable delays [29].
While medium access and data transmission techniques can be addressed by means of existing solutions, routing in such environments is still an open issue. Solutions proposed in the literature vary depending on whether some form of infrastructure support is present or not. However, both approaches adopt the same basic strategy whereby node mobility is exploited in order to transfer data. Indeed, data can be stored and carried by taking advantage of node mobility and then forwarded during opportunistic contacts. During these contacts, entire chunks of messages are transferred from one storage place to another along a path that is expected to eventually reach the destination. Clearly, there is no guarantee that a path toward destination will be actually found.
A data dissemination-based strategy spreads the message over the entire network, that is the message is forwarded at each opportunistic encounter [29]. The heuristic behind this policy is that, since there is no knowledge of a possible path toward the destination, nor an appropriate next-hop node, a message should be sent everywhere, and eventually it will reach the destination. Although this routing strategy increases the delivery probability as the message is propagated onto all possible paths, unfortunately, it also wastes considerable bandwidth and storage space.
Other strategies employ a controlled data dissemination technique whereby nodes maintain a local state, e.g., the history of past encounters, and the next hop routing/forwarding decision is made based on some utility metric [18,20,22]. In this way the system redundancy is limited at the cost of a lower delivery probability and potentially higher delivery delays. Despite all efforts, data dissemination techniques are undermined by the unpredictability of human behavior. More viable solutions can be classified under the infrastructure-based approach, where mobile infrastructure entities are involved in data forwarding.
Carrier-based solutions employ mobile infrastructure nodes acting as data collectors. These nodes move around in the network area, following either predetermined or arbitrary routes, gathering messages from other nodes they pass by. In this context, the deployment of an ON on top of a PTS has drawn the attention of researchers because it inherently helps to mitigate well-known criticalities of ON while at the same time is taking advantage of some peculiar behaviors. First, the carriers that constitute the nodes of a MDTN (e.g. buses) are powered nodes whose lifetime cannot be affected by routing operations. Second, nodes mobility is governed by a partially deterministic schedule. Last, a PTS involves a relatively large number of buses to ensure a pervasive coverage of the urban area. Taken all together, the above points promise a packet delivery platform which may lead to the deployment of a robust, urban wide, infrastructure-free, and provider-less wireless network platform.
In the next section, we discuss related work employing the PTS as a service delivery platform. We contrast existing solutions with MDTN, pointing out their differences and potential synergies.
Related work
Many research efforts have been devoted to devise efficient and reliable data distribution schemes [23,34]. In particular, Bus Switched Networks (BSN [13]), which embody ON deployed on top of PTSs, are gaining interest due to their practical use.
The first contributions in this domain propose a carrier-based approach aimed at interconnecting rural villages of developing areas [20,30]. Their common goal is to provide network access for elastic non real-time applications so that the local population may enjoy basic Internet services (e.g., e-mail and non-real time web browsing). The deployment context these projects apply is characterized by a small number of nodes with fewer contacts when compared to the urban environment. Moreover, [30] does not involve any routing of neither the request nor the response. Both the request and the response are locally stored at an infrastructure entity, acting as proxy server between end-users and the Internet, and it is up to the carrier to download the queued requests and upload the responses.
Campus bus networks are designed to serve students and faculties who commute between colleges or from/to nearby towns [7,35]. These kinds of services are usually characterized by a relatively small number of nodes when compared to a fully fledged urban environment. The main contribution in this direction is represented by [35] and [7], where five colleges are linked with nearby towns and to one another over an area of 150 square miles. On this same bus network, a system of throwbox nodes was deployed to enhance the capacity of the DTN [3].
Scaling up in terms of number of nodes, we find urban environments where a considerable number of lines are densely deployed to enable people to commute within a city. Bus networks in urban environment are usually characterized by frequent and many contact opportunities [1,19,21]. Jetcheva et al. [19] propose a multi-tier wireless ad hoc network routing architecture which provides elastic Internet access by means of Access Points (APs). In the proposed system, each AP is responsible for a geographical area and messages from mobile devices are carried to the AP and back using an ad hoc backbone that leverages buses. Ahmed and Kanhere [1] have devised an efficient large-scale clustering methodology: nodes are clustered based on encounter frequency while multi-copy forwarding takes place between members of the same cluster hosting the destination node. Liu and Wu [21] provide a more refined model of message forwarding, modeling the forwarding process as an optimal stopping rule problem. Their approach seems to effectively address the issue of having multiple copies in the network, factually reducing network overhead as a whole.
The authors in [17] propose ICOW, an HTTP proxy server deployed on top of carriers of the public transportation system. The solution exploits an intelligent caching and request scheduling mechanism in order to enhance system delivery performance. Through simulation analysis the authors show that their proposal does perform better when compared to a direct access method whereby users directly fetch the data when in direct contact with an AP. In contrast to MDTN, ICOW does not employ any routing and relies on dense AP presence deployed at each bus stop. As we later argue, we assume Internet Gateways (IGs) positioned at bus terminals since these are joint points between different bus lines and because the bus company may already have an infrastructure-based end point there (e.g., offices). While we study our solution in a modern urban environment like that of Milan (Italy) it is not confined to it. Indeed, MDTN could be adopted in any environment being it rural or urban. This said, ICOW introduces a caching mechanism which could be of benefit to MDTN and we leave this investigation as a future work.
Other research in this context, e.g., [28], adopts a geographic routing approach to forward packets between a mobile source and a static destination(s). However, traditional geographic routing approaches cannot be employed as they are within our context. Indeed, routing in MDTN can be decomposed in two major phases: (i) multihop routing from a mobile carrier (e.g., bus) toward a static IG and (ii) multihop routing from the IG toward a mobile destination carrier. While the first phase can be cast with some effort into a geo-routing approach the second one deserves further investigation.
Further contributing in this realm of research, we propose a concrete service architecture and an applicative scenario exploiting the PTS as a service delivery platform. To this end, we have implemented a near-to-real deployment scenario where carriers are public buses with routes corresponding to the actual PTS lines in Milan (Italy) while users ca be mobile entities owning handheld devices issuing data requests, or wireless sensors and actuators of a urban utility network. We study the performance trend of MDTN in a metropolitan-wide deployment under different routing strategies and data distribution schemes.
Mobile Delay Tolerant Networking
We started by analyzing some case studies in order to better understand the main issues MDTN could be deployed to address. In Section 4.1, we provide some example scenarios where MDTN could be deployed and provide service connectivity. Next, in Section 4.2 we discuss the system modus operandi along with its basic features and, in Section 4.3, the related design parameters.
Cases for MDTN
The first ambitious scenario considers a user, Alice, which is living outside the main body of a city and is required to commute every day to her workplace. As sometime happens, villages outside the city are not well covered by 3G/LTE and it might also happen that wireline connection is limited to dial-up due to a low number of potential subscribers. In this situation, Alice cannot get a good data connection from home and must rely on a public service or needs to go in an area with better wireless coverage in order to perform a proper data transfer.
Every day, in the morning, Alice leaves her home and starts a trip to go to the office. The trip is quite long since she lives outside the city. As soon as the closest bus station is reached, LTE coverage is good enough to download all data required for the day; this includes e-mail, some newspapers, and a big digest with favorite social networks. Unfortunately, as it is in many countries around the world, Alice’s data plan is limited or non-existing at all, thus impeding the mentioned transfers through the cellular network. Nevertheless, the access point on the bus – which Alice takes regularly – has already pre-loaded all the newspapers she is subscribed to and the social network digest. This is because Alice requested the data to be here the previous day on her way back home. The bus collected this request and used the broadband connection available at the end of the line to download everything overnight. After retrieving everything from the bus via WiFi, only the e-mail is left for Alice, but that alone is now acceptable to be done over the cellular network.
Now let us consider another example whereby MDTN acts as an integral part of a broader urban networking environment. The proliferation of wireless and sensing technology has brought into life the possibility to automate parts or the entire urban utility infrastructure. These utility networks include roads, street-lights, sanitation, electricity, water supply, waste disposal services etc. This is undoubtedly a challenging task and technical means supporting these solutions are being investigated [15]. In this context, MDTN, due to its inherent benefits of having pervasive coverage of the urban environment, could act as a gateway and employed to sustain delay-tolerant traffic, extending the reach to sensors and actuators to/from the Internet. In essence, public operators could exploit MDTN in order to reach and gather data where otherwise it would not be possible or cost-effective.
While both the envisioned scenarios discussed above could ideally be supported through MDTN, the adopted simulation parameters and, in particular, the traffic load discussed in Section 5.6 are more in tune with a scenario like the last one. Indeed, in absence of a realistic workload for the first scenario, we consider a synthetic workload resembling periodic traffic routed via MDTN.
MDTN system orchestration.
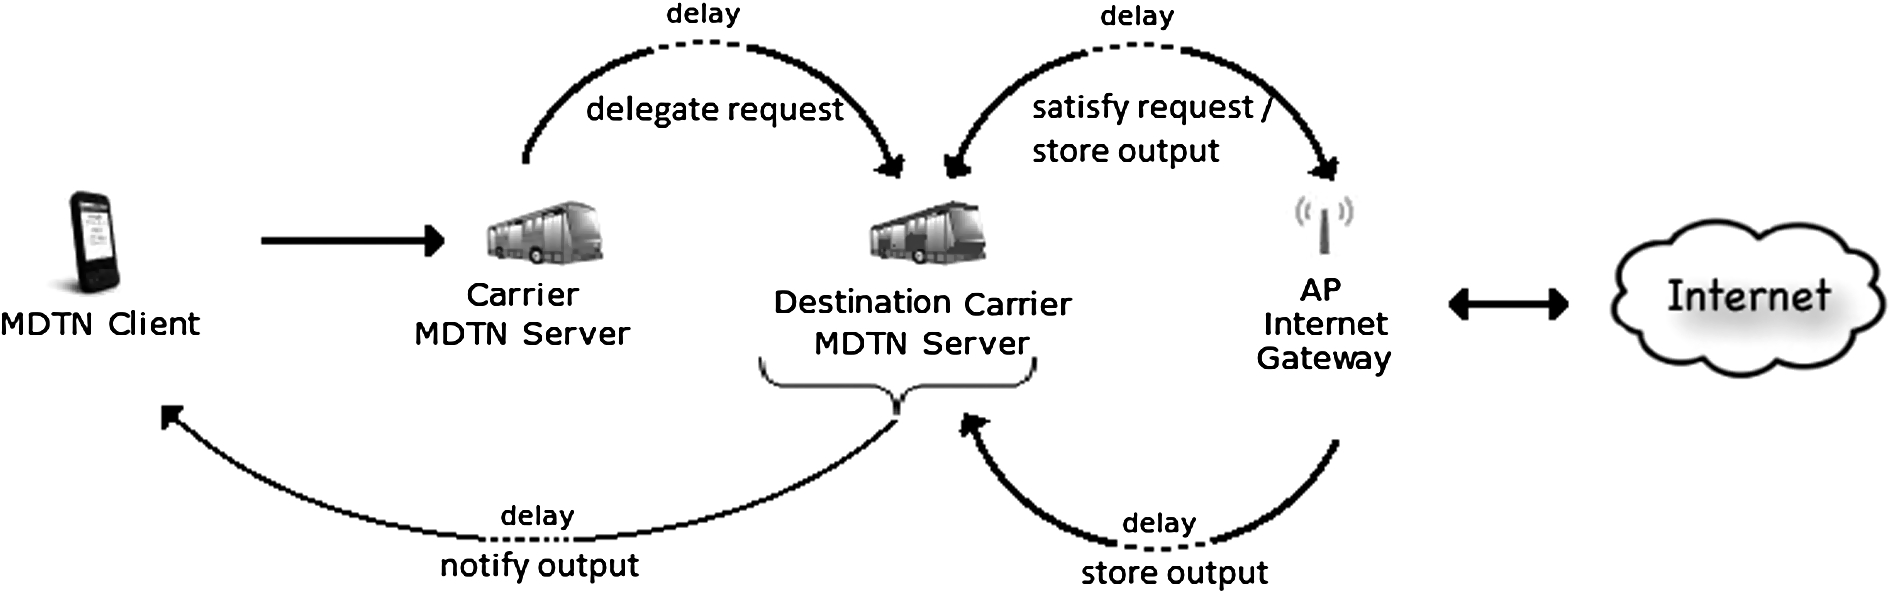
Figure 1 depicts the three main entities involved in the architecture: (i) the MDTN client or a mobile user operating a wireless-equipped handheld device, (ii) the MDTN server or the wireless data carrier which locally stores users’ requests and tries to fulfill them when Internet connectivity is available, and (iii) the Internet gateway which is an Internet-enabled wireless access point deployed at each bus end of line (e.g., bus terminals). As mentioned, we have considered positioning IGs at bus terminals since these are joint points between different bus lines and because the bus company may already have an infrastructure-based end point there (e.g., offices). However, we do not preclude the possibility of a future investigation of IG location in terms of an optimization problem.
The basic functionality of MDTN is as follows. Once the client is in proximity of the carrier (e.g. the user gets on the bus) it establishes a connection with the on-board hosted server (a BS hosting the MDTN server) and issues a request. The request consists of a content identifier (e.g., an URI) and a destination bus line where the user is going to pick up the response later on. The goal of MDTN is to provide the user with the desired content at the specified line. After the request has been issued, it is opportunistically forwarded by the carrier toward one of the IGs located along the line (or at line ends) and finally, the response has to reach the bus line where the content is expected.
The process described above involves a multi-hop opportunistic routing of both requests and results from carriers toward one of the IGs and from the IG toward the destination bus line. The delivery process is independent from the underlying forwarding strategy and occurs as follows:
If the carrier holding the request encounters during its trip a carrier belonging to a valid, according to the adopted forwarding strategy, next-hop line, the request is forwarded. It is now up to the new carrier to further forward the request or satisfy the request if it reaches its end of line.
If the carrier holding the request reaches its terminal, it is able to fulfill the request by itself; the response will be forwarded toward the destination line.
If the response reaches a destination line carrier, response dissemination among carriers of the same line can take place. In this phase, forwarding occurs during opportunistic contacts between destination line carriers (if any).
The rationale behind the last announced step of the delivery process is that there are many carriers traveling on a destination line and response dissemination among carriers of the same line might prove beneficial, speeding up its delivery toward the bus line required by the MDTN client.
Once in proximity with the wireless carrier, the client establishes a connection with the MDTN server to receive the response when/if the request has been accomplished. Obviously, the MDTN client can disconnect/connect from/to the MDTN server at any time and the response will be forwarded the next time they pair with each other.
MDTN design parameters
The design of a MDTN system involves the definition of several parameters, in particular those related to the rules used to store and forward messages among carriers, the definition of IG locations and related interconnection network, dimensioning the bandwidth and storage capacity of on-board BSs etc.
In this paper, we focus on the message forwarding strategy, that can be defined by a routing policy and a distribution scheme. In the following, we will define a routing policy as the set of rules used to identify a feasible next hop, whereas a distribution scheme will be the set of rules used to decide whether a message will be forwarded.
The choice of a specific routing policy and a specific distribution scheme gives raise to the routing algorithm that defines the path(s) followed by requests and responses in the MDTN system.
Simulation environment
In this section we describe the simulation environment and provide the details regarding the specific parameters used for the evaluation of our service architecture.
The URBeS simulation framework
We have chosen the Urban Routing Backbone Simulator (URBeS) for our simulation analysis. URBeS has been proposed and validated in [13] and it is particularly apt for the evaluation of city-wide transportation systems from a networking perspective. The simulator is a discrete event simulation software and the choice to pursue a custom-made implementation of a new simulation environment was to overcome the poor scalability in terms of total traffic and number of nodes from existing products (e.g., GloMoSim [14] and NS-3 [24]). Moreover, URBeS introduces a highly optimized urban canyon model which is missing in current state-of-the-art products (e.g., the ONE simulator [33]). URBeS has been positively evaluated against GloMoSim in scenarios of low traffic levels using the output coming from the Urban Mobility Simulator (UMS), the URBeS module that generates the bus’ mobility traces.
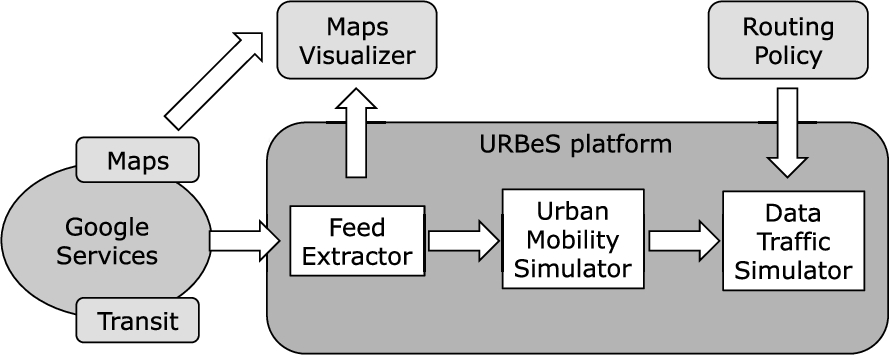
In essence, URBeS acquires real cities topological data as well as the relative PTS timetable and is capable of reproducing accurate bus movements in real urban environments, simulating data forwarding among buses. The experimental platform is able to support any external routing policy and distribution scheme in order to compare the performance of various routing algorithms. Figure 2 shows the functional scheme of the simulator, emphasizing both the modular design of its functionalities and its support for any externally specified routing policy and distribution scheme.
URBeS functional scheme [13].
In order to reproduce accurate topological information for a PTS, URBeS exploits the Google Transit [16] service which is an open database of planned trips. These data are made available by transit authorities and URBeS relies on them in order to extract and devise the movement model of the PTS entities. In specifics, the simulation framework is comprised of three main modules which run sequentially in order to prepare for the simulation scenario. In the first phase, URBeS parses information from the feed and produces a timetable of bus movements together with a topology of the PTS layout. The acquired GPS coordinates of bus stops and corresponding routes are converted to Cartesian coordinates. Buses along the lines move between the coordinates according to a real timetable at a constant speed. Pauses at bus stops are – when planned – included in the data feed and thus simulated accordingly.
The output from this first phase is then fed to a urban mobility simulation module which is in charge of generating the mobility traces for all the buses based on the real PTS timetable. In addition, in this phase, URBeS also produces some statistics related to bus contacts which are useful to predict intra and inter-contact times and for understanding city coverage of the PTS, information that can be used to define heuristic routing algorithms.
In order to produce a complete simulation scenario, data traffic needs to be added into the picture. To achieve this goal, in the last processing phase, data traffic is randomly generated for each bus. Moreover, the framework provides a logging facility which generates detailed information regarding the forwarding process to profile delivery rates, delays, and locations where forwarding takes place.
In the following we report some implementation details relative to the three components of URBeS, useful to provide a deeper insight into our simulation settings (refer to [13] for more details).
A Google Transit feed is a database comprised of tables reporting activities of individual bus lines, classified by a time context (e.g., Monday, Sunday, or “Independence Day”), a route id, and a bus head sign. Importing and converting the data into a more manageable format into URBeS is a task undertaken by the Google Transit Feed Extractor (FE) module.
A first step toward building the PTS topology is the analysis of the list of trips which ends with their classification based on the stops made. Paths are grouped together with reversals and aliases, where reversals are paths making the same stops in reverse order, and aliases are routes having the same end of the line and almost the same intermediate stops (i.e., their difference is below a certain threshold). All the paths in a group are identified as a single – looping – line, as traditionally understood by passengers. All lines must be closed paths as in this way it is possible to assign buses for subsequent departures once they have completed a round trip.
Lines that do not define a closed path are not used for data transportation. We adopt this constraint, since it is not possible for us to make any reasonable assumption about the future activity of buses running along them. As an example, consider the case of shuttles making one-way trips from the train station to the airport where there is no timetable available for the way back. Hence, following the normal procedures, we would be required to discard all transported messages when the bus/shuttle end of line is reached. Needless to say, such a behavior is not useful for routing where encounters are not deterministic and, as a consequence, such lines are not considered to be part of the data distribution system.
The output generated from the FE is a database of routes and timetables from real traces which are then fed to the second module of URBeS.
Urban Mobility Simulator
Once extracted the properties of individual PTS lines, it is the turn of the UMS module which generates the mobility traces for all buses during a given period.
The UMS module manages the PTS entities and ensures scheduled starts and out of service events. When a schedule start is reached, buses leave the line head and make the stops according to the set timetable. Upon path traversal a bus waits at the head of the line, if necessary, for the next scheduled departure. A line is considered over-populated if there are already two buses in line. In this case one of the buses is taken out of service. In case of aliases, the bus waiting in line will select the path of the next aliased line departing from the current head of line.
The location and timetable information extracted from FE are key parameters driving nodes (corresponding to buses) during the simulation. Under these conditions, we have deterministic information about system evolution and there is no need to add parameters coming from any external model. Since timetables are planned beforehand in order to take into account daily traffic conditions, we are not required to predict and simulate extraordinary situations (i.e., traffic jams). Nevertheless, in order to take into account small variations between average traffic and actual street conditions, the UMS module adds a random noise, uniformly distributed between 0 and 10 minutes, on the scheduled departure times. Another important feature regarding the networking aspect, is the adoption of a line-of-sight model. To this end, UMS exploits a urban canyon model which leverages street maps created from the bus routes.
After the completion of this phase, UMS is able to perform a first analysis of the bus network topology and bus movement. This analysis provides the evolution of PTS entities and relative contacts, information about the number of neighbors and distribution of intra and inter-contact times. This information is important for the simulation of MDTN systems, since it can be conveniently exploited by heuristic routing algorithms.
The output of the UMS is a trace of bus movements in a bi-dimensional space.
Data Traffic Simulator
In the successive and last phase, the Data Traffic Simulator (DTS) takes the output of the UMS and introduces data traffic. These data are routed according to the chosen routing algorithm.
Upon its generation, a message is placed in the nodes local buffer until a forwarding opportunity arises. A bus experiencing no contacts will keep accumulating messages. When an encounter happens all the messages are checked for forwarding. The forwarding process may be subject to constraints in terms of transmission bandwidth (i.e., a limited number of messages per second in accordance with the radio interface) and buffer space. Forwarding takes place according to the adopted routing policy and distribution scheme, and if buffer space is available at the destination. In case there are not enough resources to forward all messages a first-in-first-out buffer management policy is enforced.
A bus reaching the end of line may or may not queue up and wait for another scheduled departure. While waiting for the next scheduled departure, additional data might be generated. On the other hand, if there is no scheduled departure and the bus is leaving service, all the buffered data will be pushed to the next bus in line. If no such bus exists, e.g., there are no more scheduled departures, all the buffered messages will be dropped and considered lost.
The routing algorithm employed during a simulation is provided as an external module and is a system configuration parameter. A user might implement a custom routing algorithm just by extending the appropriate module and defining the application logic on which the forwarding strategy relies upon. This approach makes URBeS an ideal platform for routing protocol development and comparison: multiple experiments can be easily run specifying different routing modules to be used with the same traffic pattern.
The output of the DTS is a complete trace of the generated data traffic. From this trace we can compute all the needed performance indexes and perform protocol analysis.
Urban environment
To evaluate the perfomance of MDTN we have selected a real city, Milan, Italy; a medium size town (typical for many European cities) well served by 69 bus lines covering a circular city plan. Figure 3 shows the map of the PTS used in our simulations while Table 1 presents an overall summary of the city and relative PTS layout. Bus line density is calculated as the mean number of kilometers covered by buses over a square kilometer.
As observed in [13], Fig. 3 shows that, the overall city structure is clearly not Manhattan-like; crosses between bus lines may occur at any time and there is no constant space between contacts. Moreover, buses can run along three kinds of routes: they may span across the city, run around the center, or cover only a peripheral section making a small loop. Example of such lines can be seen in Fig. 3(b), 3(c), and 3(d) respectively.
The uneven topological structure and the frequent contacts between nodes makes the PTS of Milan a very interesting case study to evaluate the MDTN service architecture.
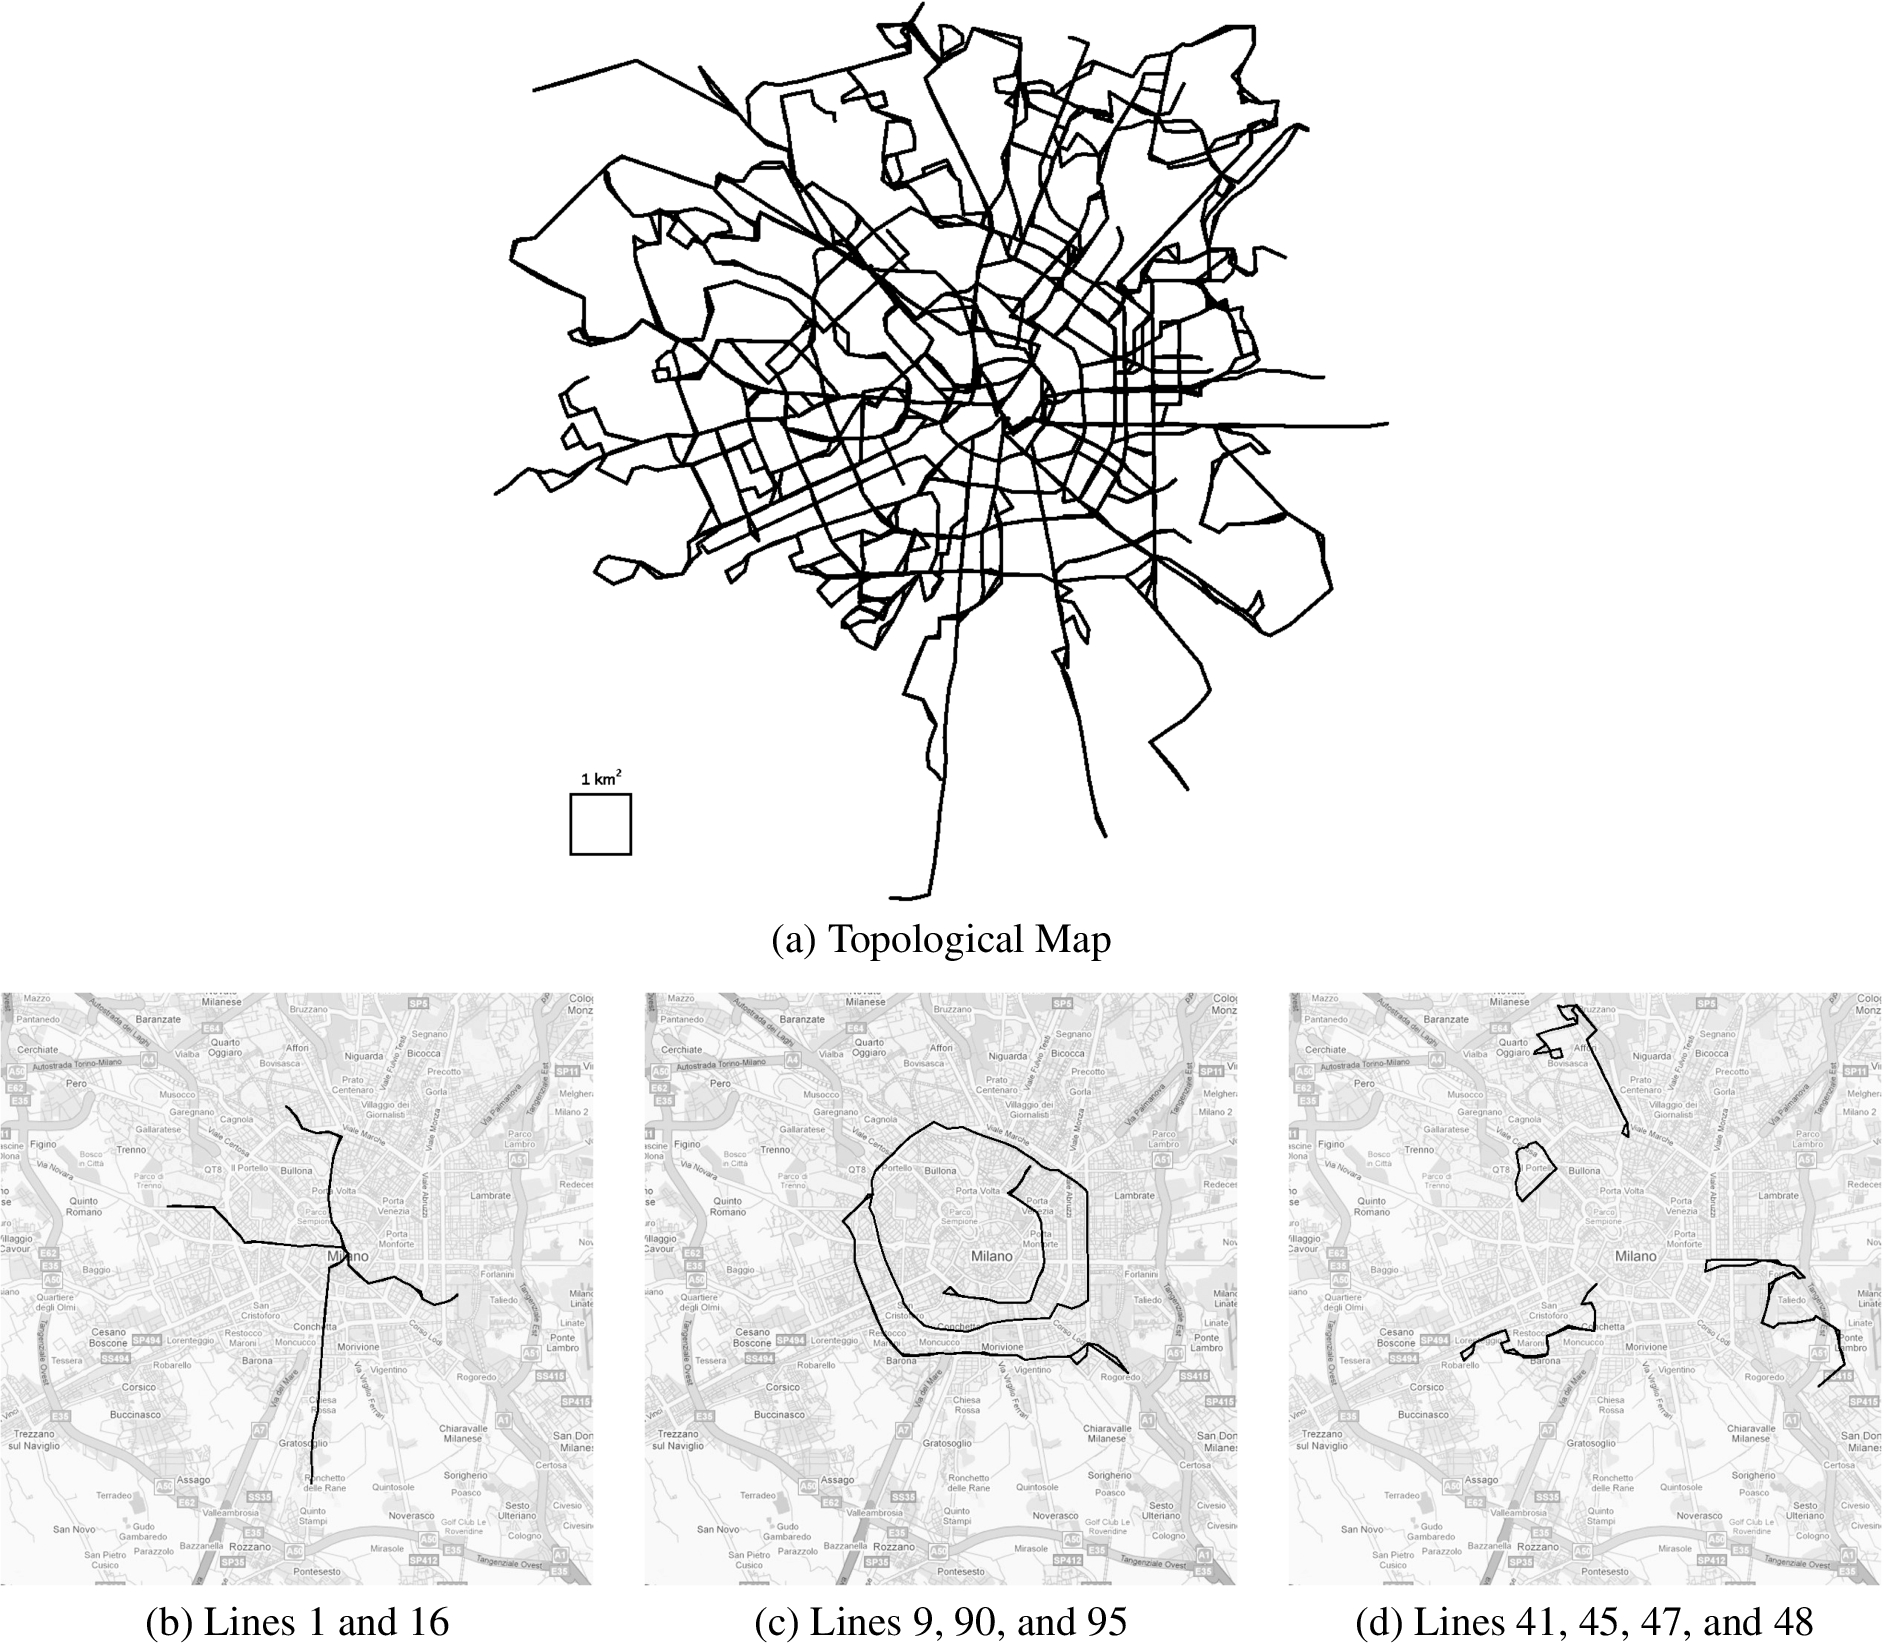
Milan PTS characteristics. Above is shown the overall PTS topology along with some bus routes comprising it [13].
In our simulations each bus is equipped with a 802.11g network interface with a 100 m maximum radio range. Only line/of/sight contacts are considered: urban canyons created by buildings are taken into account.
Simulation starts at 4 A.M. (the first bus starts at 5 A.M.) and ends at 8 A.M. of the following day (the last bus goes out of service around 6 A.M.). All buses departing before 4 A.M. are considered on duty during the night and not in the morning.
With regard to traffic generation, our aim is to simulate data exchange during an ordinary working day. Data traffic generation is performed continuously during working hours: from 8 A.M. to 8 P.M. During simulations, requests are generated at a constant rate for every operating bus. Each bus receives 10 service requests per hour from MDTN clients in proximity. These requests are accepted as long as the bus is in service; even when waiting for the next departure at the end of the line. For each request, the client specifies a destination line where he wants the response to be delivered, which is chosen randomly on the PTS using a uniform distribution.
We assume that each bus is equipped with sufficient storage in line with modern equipment for industrial PCs, so that constraints on limited storage space can be neglected. In order to simulate both typical web-based and generic data traffic (mail, forum posts, social network interaction, urban utility network interaction, etc.), the size of request messages varies uniformly from 1 KB to 40 KB, whereas the size of response messages varies from 10 KB to 64 KB. When a message is generated, it is stored into the bus local storage until forwarding becomes possible, according to the chosen strategy.
When a bus reaches the end of the line it may queue up and wait for another scheduled departure. If the bus stays in line it will hold all its data and will keep accepting requests from the surroundings. If, on the other hand, the bus leaves service, all content will be pushed to the first bus waiting in line. If there is no bus (because there are no more scheduled departures) all the stored messages are dropped and considered lost.
Properties of PTS layout of Milan
Properties of PTS layout of Milan
Forwarding can take place depending on the routing policy and distribution scheme between BSs on-board each bus and between a BS and an IG deployed at each line end. In our simulation we considered the following three distribution schemes:
No routing: each bus must keep all its requests until it reaches the end of line. When the end of line is reached, requests are satisfied and responses are immediately sent to the IG(s) of the destination line. Notice that, in this scenario, no routing policy is needed.
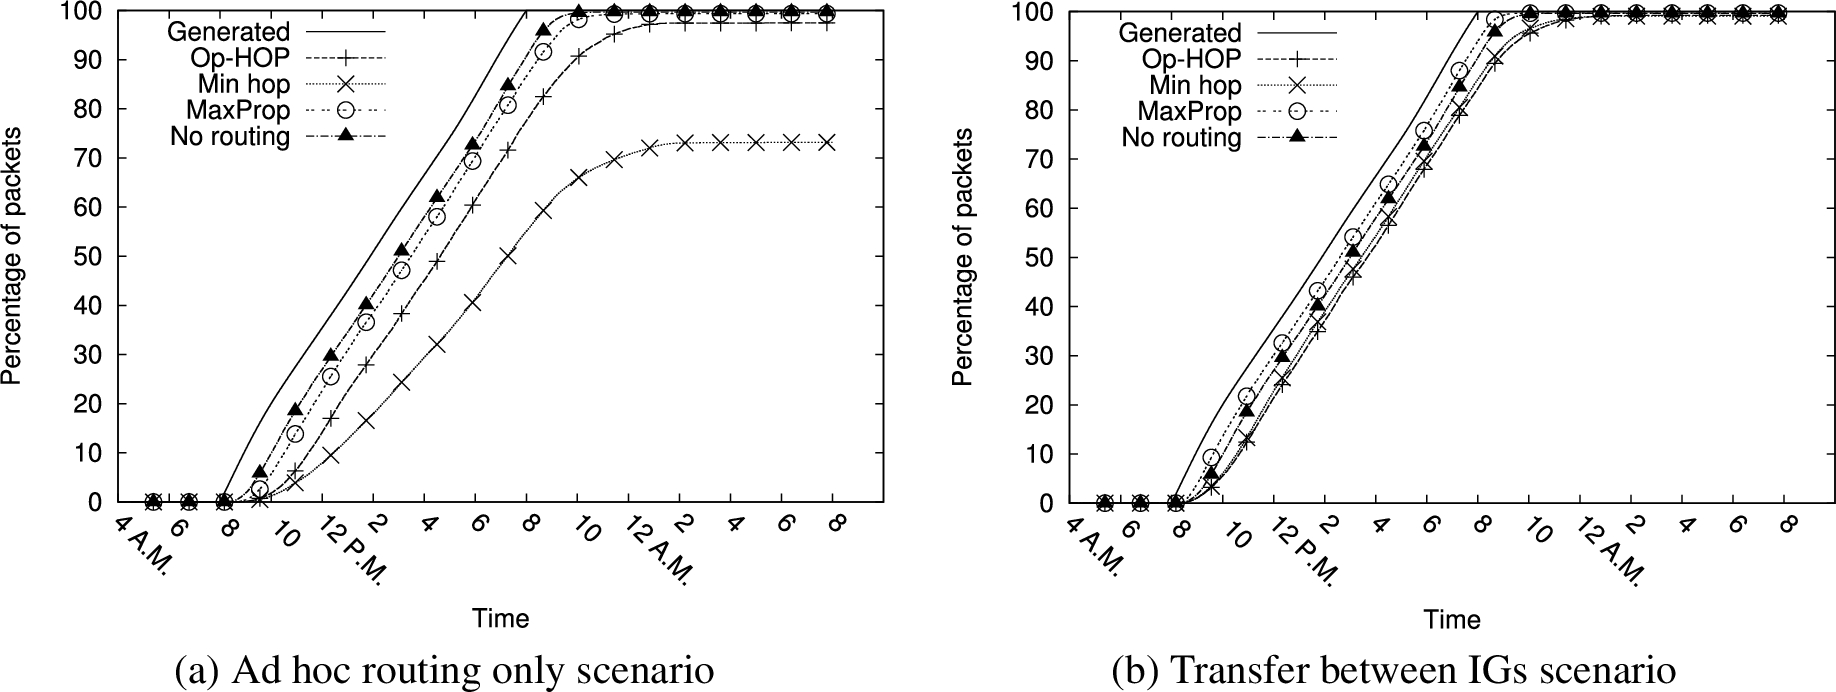
Ad hoc routing only: requests are forwarded toward the destination line using one of the routing policies described in the following. If, along the path between source and destination, an IG is encountered (i.e., the bus is in transmission range of an IG), requests are satisfied and changed into responses, which are forwarded toward their destination line adopting a specific routing policy. Otherwise, requests are delivered to a destination line carrier, which will eventually meet an IG (e.g., at the end of the line), thus generating related responses.
Transfer between IGs: requests are forwarded toward the destination line as in the previous case. When an end of the line is reached and requests are satisfied, responses are sent immediately to the IG(s) of the destination lines using a wired network.
With regard to the routing policy, we aim to test how MDTN would benefit from legacy or innovative routing approaches. For this reason in our simulations we compared three different routing policies which, we believe, are meaningful for a broader set of solutions; they are: Minimum hop (Min-hop), MaxProp [35], and Op-HOP [13,31].
Min-hop follows a single-copy, link state routing approach, which should be able to exploit the specific design of a PTS, usually devised to bring people (as messages) across the metropolitan area minimizing the number of transits. Link state routing is extensively adopted in wired networks and we use it as a benchmark to understand how much MDTN can benefit from more sophisticated routing. Moreover, a link state approach is, in general, feasible for a PTS because all bus routes are known in advance and should not change without notice during the day.
MaxProp is considered the state of the art for DTN deployment over a PTS: it uses a multi-copy routing algorithm and implements a sophisticated buffer management based on messages priority. Being multi-copy, MaxProp uses more resources while generally providing good performances in terms of delivery delay.
The last protocol, Op-HOP, also uses a single-copy link state approach. Differently from the Min-hop, Op-HOP adopts a metric based on probability: message routing paths are calculated based on lines encounter probability to maximize message delivery. Moreover, unlike other solutions, Op-HOP forwarding criterion is estimated based on the number of encounters rather than their duration [32]. Op-HOP has already been shown to scale better than MaxProp in a purely ad hoc environment.
Through this section we discuss the results obtained in the simulation analysis. In specific, through Section 6.1 we show the delivery delay, that is the time span taken for a request message to be delivered from the bus where it was generated until the response is delivered to its intended destination. Next, in Section 6.2 we discuss the delivery rate metric, that is the percentage of delivered responses over the total number of request messages.
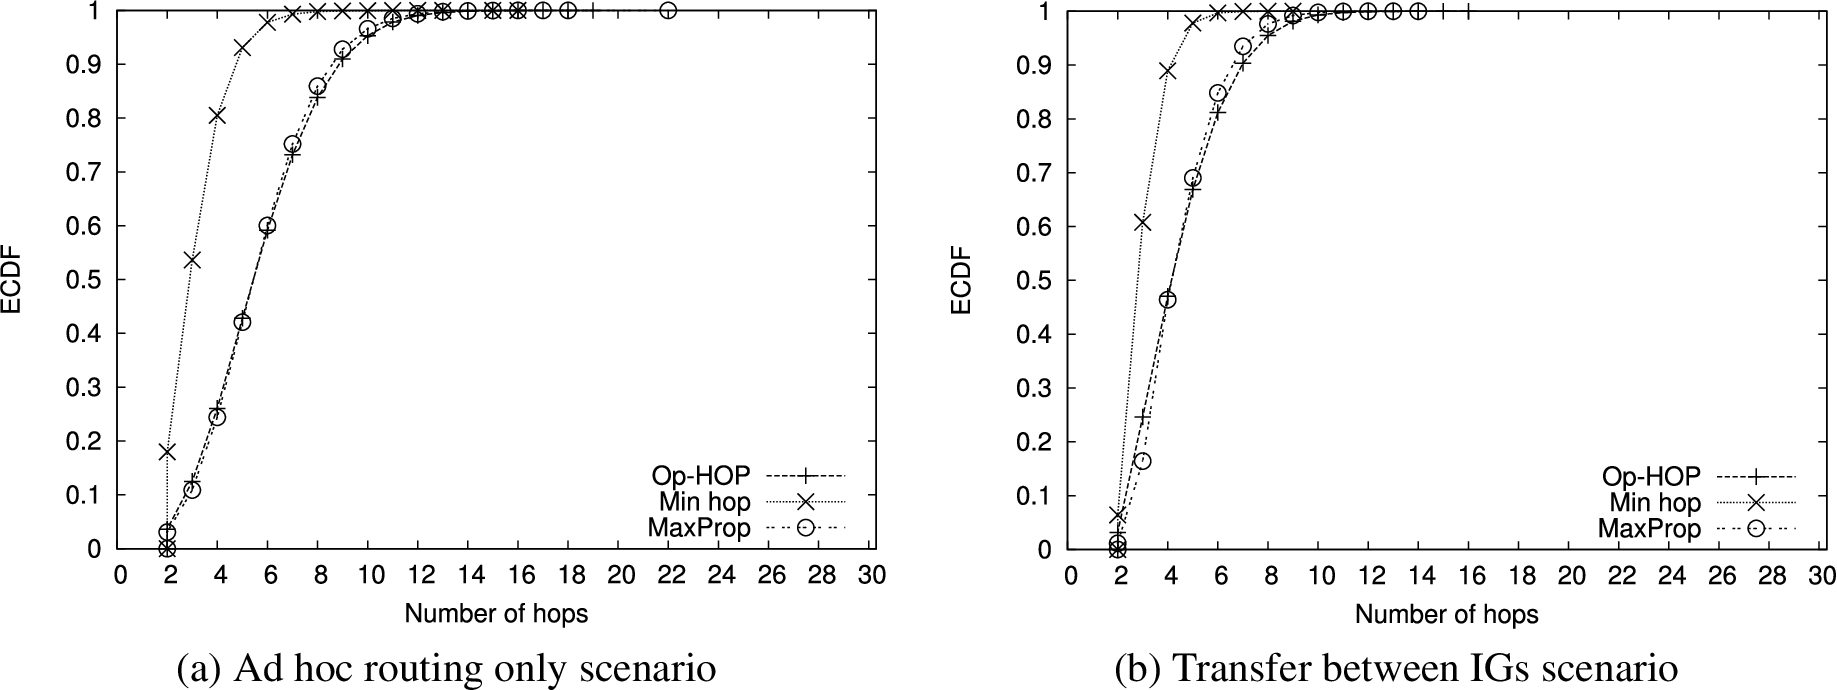
ECDF of number of hops.
Traffic delivery profiles.
A summary of average delivery delays under the various combinations of routing policies and distribution schemes is reported in Table 2. As we can see, with a pure ad hoc routing approach, responses will be delivered with an average delay of 1.6 to 4 hours; being the Min-hop policy the worst and MaxProp the best case. MaxProp has also the smallest standard deviation (less that one hour), thus showing more reliable than Op-HOP (more than one hour standard deviation) and, in particular, Min-Hop (almost three hours). Under these lenses, the system could be actually used for news retrieval, distribution of information regarding local events, and more in general, for non-critical data retrieval whose validity fits within MDTNs delivery delay profile.
Summary of delivery delay in Milan (values in hours)
Summary of delivery delay in Milan (values in hours)
A different scenario comes forward when the distribution scheme changes and the request is forwarded only up to the first IG and the response is transmitted directly to the IG of the destination line via wireline. In addition to the fact that the average delay time is reduced, Min-hop starts performing better than Op-HOP while MaxProp is still the best scheme able to contain the delivery profiles up to less than 1 h on average. The difference between Min-hop and Op-HOP sits in the optimization of Op-HOP: the latter is more likely to miss contacts and carry the request toward the IG of the first line, reducing the average delay more than Op-HOP. In this distribution scheme, in all cases, the average incurred delay is acceptable for urban-wide services.
The number of traversed hops embodies a performance metric closely related to the delivery delay, as every hop is the result of a contact opportunity or a (sometimes long) travel toward an IG. In Fig. 4(a) and Fig. 4(b) the empirical distribution function (ECDF) of the number of traversed hops is reported. In the graphics, the no routing scheme is not reported since it will not bring any meaningful information (the number of hops is fixed) and all profiles have a minimum of two hops because the messages have to traverse at least one IG before reaching the destination. Analyzing the outcome, we can observe that, despite the lower delivery delay, MaxProp does not outperform Op-HOP in a sensible way, that is, the number of hops is almost the same. This means that the average time between two consecutive message forwarding is smaller for MaxPror with respect to Op-HOP, meaning that MaxProp is able to better take advantage of forward opportunities, and more effective at identifying feasible next-hops.
Figure 5 shows the traffic delivery profiles. The Generated line shown in the charts denotes the percentage of requests generated in time. By comparing both scenarios, the performance of Min-hop is sensibly worst than the other routing policies, unless the system is extremely connected, as it happens in the IG Transfer scenario. This can be explained with the extremely long delivery delay: messages will accumulate in the evening and buses going out of service will make the network less connected, increasing the number of message drops.
Instead, Op-HOP is not suffering to the same degree because paths are built based on encounter probability: a smaller fraction of the total traffic will stay in the system for a much longer time and will be dropped at the end of the day, and a more considerable number of messages will be able to find the way to destination. We have to observe that not even the no routing distribution scheme is able to guarantee a 100% delivery of messages. Nevertheless, MaxProp is able to slightly outperform no routing but it needs assistance from the IGs.
Conclusion and future work
In this paper we presented and discussed the performance of MDTN: a delay tolerant application built on top of PTS, which is able to provide opportunistic connectivity in scenarios where infrastructure connectivity is lacking or cost-attributed. We applied our solution to a real environment and tested different routing strategies. By means of near-to-real simulations we show that MDTN could be a viable solution for non-critical data retrieval. In particular, partial infrastructure deployment (e.g., IGs at end lines) could help to boost delivery profiles making the system appealing to end-users.
As a future extension of this work, we plan to investigate a caching mechanism which could help to boost MDTN delivery profiles. In this respect, MDTN can be viewed as a mobile cache providing access to popular content where otherwise it would not have been available. Furthermore, it would be interesting to explore new routing strategies and distribution schemes specifically tailored to the dynamics of the considered PTS, taking also into account further constraints such as nodes capacity (bandwidth, storage limits) and message maximum delivery time.