
Abstract
This paper presents a three phase approach to crime prediction based on video analysis, neuro-fuzzy inference and density mapping. In the first phase, crime indicator concepts are modeled and used in building classifiers for crime indicator events. Both indicator concept modeling and indicator event classification are performed using Generalized Maximum Clique Problem (GMCP) method. In the second phase, a neuro-fuzzy inference system modeled from training data is used to make predictions about classified crime indicator events obtained from the first phase. Finally in the third phase, kernel density estimation (KDE) is used to fit a spatial probability density function to the predicted crime indicator events across the study area. The major advantages of this method include the potential to predict crime in real time due to the use of video based events, the ability to generate fuzzy rules from data, the ability to optimize fuzzy rule-base by learning and the ability of weighting different crime variables. The proposed framework has prospects for developing a police field decision support system. The feasibility of the framework has been tested in a simulated experiment using sampled clips from violent scene detection (VSD) 2014, Hollywood Human Action (HOHA) and HMDB datasets and the results are quite promising for real life implementation.
Introduction
Crime prediction is a continuously relevant area of research giving the demands of today’s society and the threats of global terrorism. Crime prediction research is often supported by criminology theories. Prominent among the criminology theories include the routine activity theory, rational choice theory and crime pattern theory [5,18]. Analyzing these theories, the understanding one gets is that criminals and victims follow certain life patterns, crime patterns are influenced by geographic and temporal factors and criminals make rational decisions based on risks and benefits. These patterns can be extracted using image processing and event detection methods.
Crime mapping is a significant component of crime prediction since it allows the visualization of crime patterns. There are several methods of crime mapping which includes: point mapping, spatial ellipse, thematic mapping and Kernel density estimation (KDE). KDE is viewed as the most suitable method for visualizing crime data as a continuous surface [9,22,30]. As such, in this study we adopted KDE for visualizing our predicted crime indicator events.
Conventional crime prediction methods are mostly based on data-mining and spatial statistical techniques. These methods often rely on a combination of crime incident data, socio-economic, demographic (population related statistics) and spatial factors for predicting crime [6,8,18,30]. More recently researchers have expanded these methods to include social media information in order to achieve better performance [1,3,25,26]. Even though these methods have demonstrated good performance especially in forecasting future crimes, the major drawback of these methods is the failure to predict crime in real time.
Another direction of research with relevance to crime prevention is smart surveillance. Smart surveillance methods make use of automatic image understanding and video based event detection methods for purposes of security alertness or situation awareness. In our opinion, smart surveillance offers the best prospects for predicting crime in real time. Nonetheless, existing works often focused on detecting abnormal events or enhancing security alerting systems in special areas of interest like airports, parking lots, shopping malls and so on [4,27,29]. Besides that, there are some open research issues regarding the performance of event detection methods. Such issues include false alarm rate, identifying best key-point descriptors, tracking partly occluded entities, optimizing learning parameters and other camera related issues (like viewing angle, viewing distance).
In light of the above, this study intends to the explore viability of using wide area video surveillance for the purpose of crime prediction and crime mapping. In short the main contributions of this paper as include: (1) Defining and modeling crime indicator events in videos. (2) Identifying the best feature descriptors for video based crime indicator concepts. (3) Evaluating existing video based concept detection methods. (4) Establishing GMCP as an optimal classifier choice for video based crime indicator event detection. (5) Building a neuro-fuzzy crime prediction system using training data. (6) Combining video event detection, neuro-fuzzy inference and kernel density techniques for wide area crime pattern visualization. The rest of the paper is organized as follows. Section 2 presents an overview of relevant literature. Section 3 presents the proposed solution. Section 4 contains description of the datasets and experiments. Section 5 contains discussion. Section 6 concludes the paper with summary of our contributions and future research direction.
Relevant literature
The study seeks to tackle crime prediction from a multidisciplinary and an integrated viewpoint, by bringing together techniques of video based event detection, hybrid intelligent systems and Mapping techniques. As such the literature will be reviewed under three subsections for the sake of clarity and easy comprehension.
Video based event detection
This is one of the well-researched areas of computer vision and there are several approaches to video based event detection. Notable among these approaches are concept based event detection (CBED) methods. These methods use the detection of semantic concepts for modeling and classifying events in videos. Some examples include Izadinia and Shah [14] who used low-level event concepts models for recognizing complex events under a latent support vector machine (LSVM) framework. Jingen et al. [17] proposed a video based event recognition method using concept attributes. In their method, events are modeled in a semantic concept space using a variety of complementary semantic features. Ehsan et al. [10] also used a combination of trained concept detectors with a latent temporal model for event detection. Their argument is that, concepts in an event tend to articulate over a discernible temporal structure. Hence they exploited the temporal model using the scores of concept detectors as measurements. Another method is Shayan et al. [24] who proposed a contextual approach to video classification. In their approach, events are modeled based on co-occurrence of concepts and new events are classified by matching semantic co-occurrence patterns with reference event models.
Hybrid intelligent systems
Hybrid intelligent systems are intelligent expert systems which combines at least two intelligent technologies like fuzzy logic, neural networks, evolutionary computation, probabilistic reasoning and so on. These combinations have led to the emergence of systems that are capable of reasoning and learning under uncertain and imprecise circumstances. In the last few decades, the integration of Fuzzy Logic and Neural Networks in particular has attracted a lot of attention across various fields of science and engineering research. Some of the notable works include: ANFIS proposed by Jang [15]. ANFIS is a Sugeno-type fuzzy inference system with five layers. This method relies on backpropagation learning for determining the premise parameters and least mean square estimation for determining the consequent parameters. Nauck and Kruse [7] also proposed NEFCON which is Mamdani-type fuzzy inference system. In this model, the learning process is based on a mixture of reinforcement and backpropagation learning. NEFCON can be used to learn an initial rule base if no prior knowledge about the system is available or even optimize a manually defined rule base. NEFCON has two variants: NEFPROX (for function approximation) and NEFCLASS (for classification tasks).
Mapping techniques
Kernel density estimation (KDE) is one of the effective ways of visualizing the distribution of crime across space and time. Traditional KDE methods often depend on historic crime incident data. But recent improvements including Matthew [12] successfully integrated social media (twitter) information on a KDE framework in order to enhance performance. Dawei et al. [6] presented a different approach to hotspot mapping. In their framework they used spatial statistics and data mining concepts to map crime hotspots and investigate the relationship between socio-economic factors and crime variables. They created a Hotspot Optimization Tool (HOT) which identifies crime hotspots through related variables.
Proposed solution
The proposed framework is made up of three phases’ which are video analysis, crime prediction and crime mapping. The first phase adopts contextual approach to video classification and context models are built using co-occurrence of concepts. To do this, event classes are modeled based on concept co-occurrence within the classes and new videos are classified by matching semantic co-occurrence patterns with event representation models. The matching is performed by finding the strongest clique of co-occurring concepts in a video based on Generalized Maximum Clique Problem (GMCP) which is solved using Mixed Binary Integer Programming.
In the second phase, crime predictive analysis is performed using a neuro-fuzzy approach. The adoption of this approach allows the easy integration of other crime predictive factors (such as time of event and crime rate in the area) and the weighting of these factors. In the third phase, kernel density estimation (KDE) is used to fit a spatial probability density function to the crime imminence data across the study area. This allows the visualization of crime imminence levels in spatial space. The assertion held by this study is that real time video data provides a more pragmatic source for identifying and understanding crime imminent regions as compared to historic crime incident data. This assertion is supported by a widely held psychological view that before a crime occurs there are usually indicators or leading events [5], hence this study attempts to capture crime indicators through analysis of surveillance videos. Figure 1 is the proposed framework diagram.
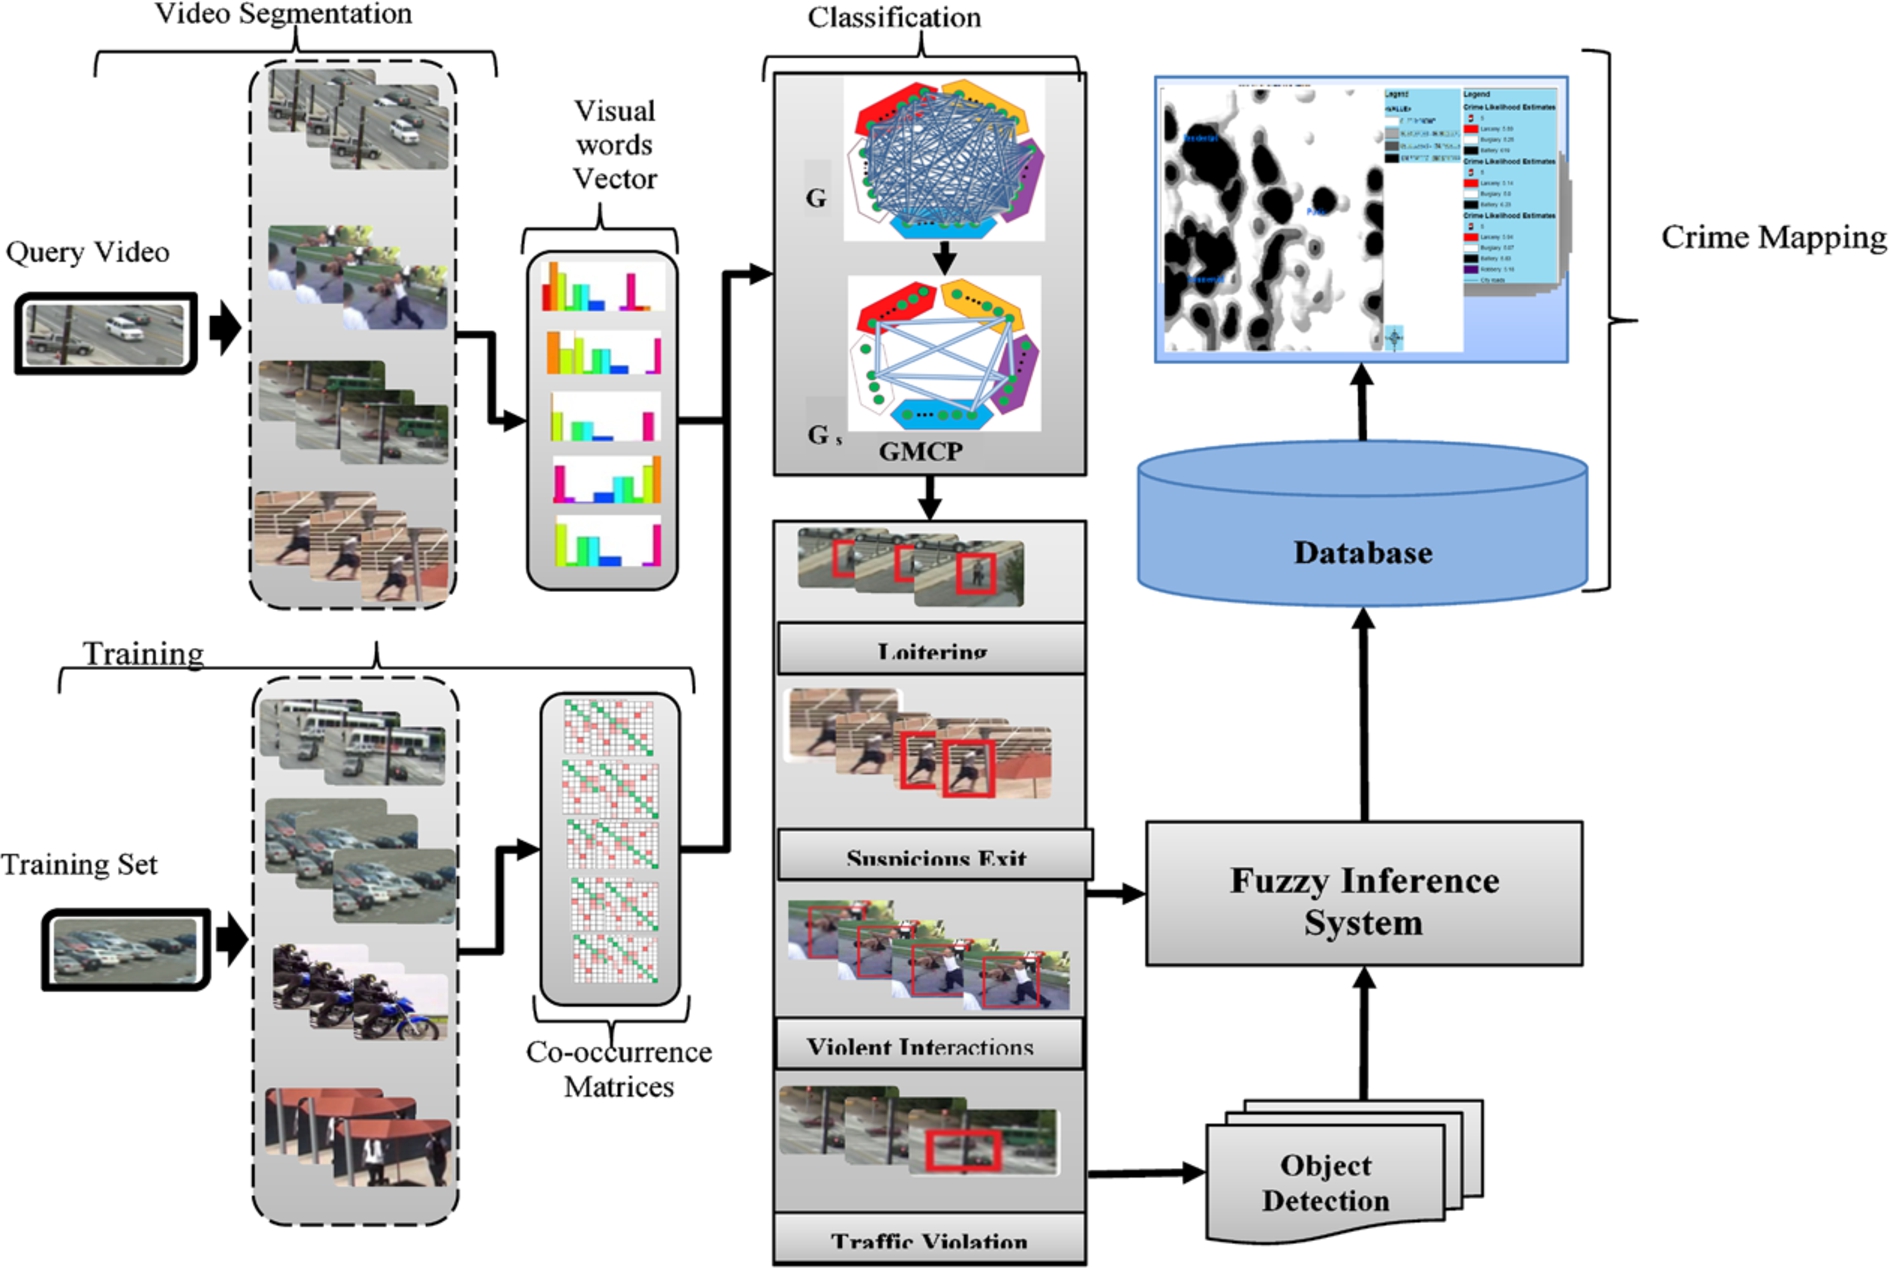
Proposed framework diagram.
To build the concept detection model, first the probability of concepts co-occurrence are computed from annotated training videos and saved as reference co-occurrence matrices. Then the query videos (which should be the surveillance footage) are divided into clips of equal interval. Given that the number of trained concepts is k and the number of clips in the query video is h. The k trained concept detectors are applied to each clip and the resulting
Context model
To capture context within videos, a pairwise co-occurrence of concepts strategy is used. The strategy is built based on the conditional probability of concept coincidence. As such the reference co-occurrence matrices are computed using the conditional probability of concept coincidence [24,29]:
Using GMCP for concept detection
Given that, graph
The first term is obtained from the reference co-occurrence matrix and the second is the SVM confidence value. Thus the larger the edge weights the higher the probability for the parent concepts of
To perform the concept detection, one concept is assigned to each clip of the test video. And a subgraph of G defined as
Equation (4) aggregates all the possible pairwise relationships between different concepts in different clips and the set of contextually consistent concepts is found using the following expression:
GMCP is used in solving the above combinatorial optimization problem. The objective of GMCP is to find a subgraph within a complete graph in such a way that the sum of the edge weights is optimized [2,11,24].
Using GMCP for video classification
By representing a video class based on the co-occurrence of its concepts, GMCP can be used to classify the video. As stated in [24] a class specific co-occurrence matrix
By solving the optimization problem, the class which the test video belongs to can be found as follows:
Crime predictive analysis
As indicated earlier, this study adopts neuro-fuzzy approach for predicting crime imminence levels across the study area. Specifically an adaptive neuro-fuzzy inference system (ANFIS) [15] approach is used. As the name implies ANFIS exploits the strengths of both Artificial Neural Networks (ANN) and Fuzzy Inference Systems (FIS). In such a combination the learning capability becomes an advantage to the FIS and the formation of linguistic rule base becomes an advantage from the viewpoint of ANN.
Neuro-fuzzy model
ANFIS is a sugeno-type fuzzy inference system. A typical Sugeno fuzzy rule is expressed as follows [15]:
Generally ANFIS can be explained in a six layered architecture. The first layer is often the input layer where the neurons simply pass external crisp signals to the next layer. The second layer is the fuzzification layer and neurons in this layer perform fuzzification. The third layer is used to compute the rule antecedent. Each neuron in this layer corresponds to a single Sugeno-type fuzzy rule. The rule neurons receive inputs from respective fuzzification neurons which are then used to calculate the firing strength of each rule. The conjunction of the rule antecedents is evaluated by the product operator. Thus, the output of neuron i in the third layer is obtained as follows:
The fifth layer is the defuzzification layer where the consequent parameters of the rules are determined. A defuzzification neuron calculates the weighted consequent value of a given rule using the expression:
Basic learning rule and definitions
Let assume that a given adaptive network has L layer with kth layer having
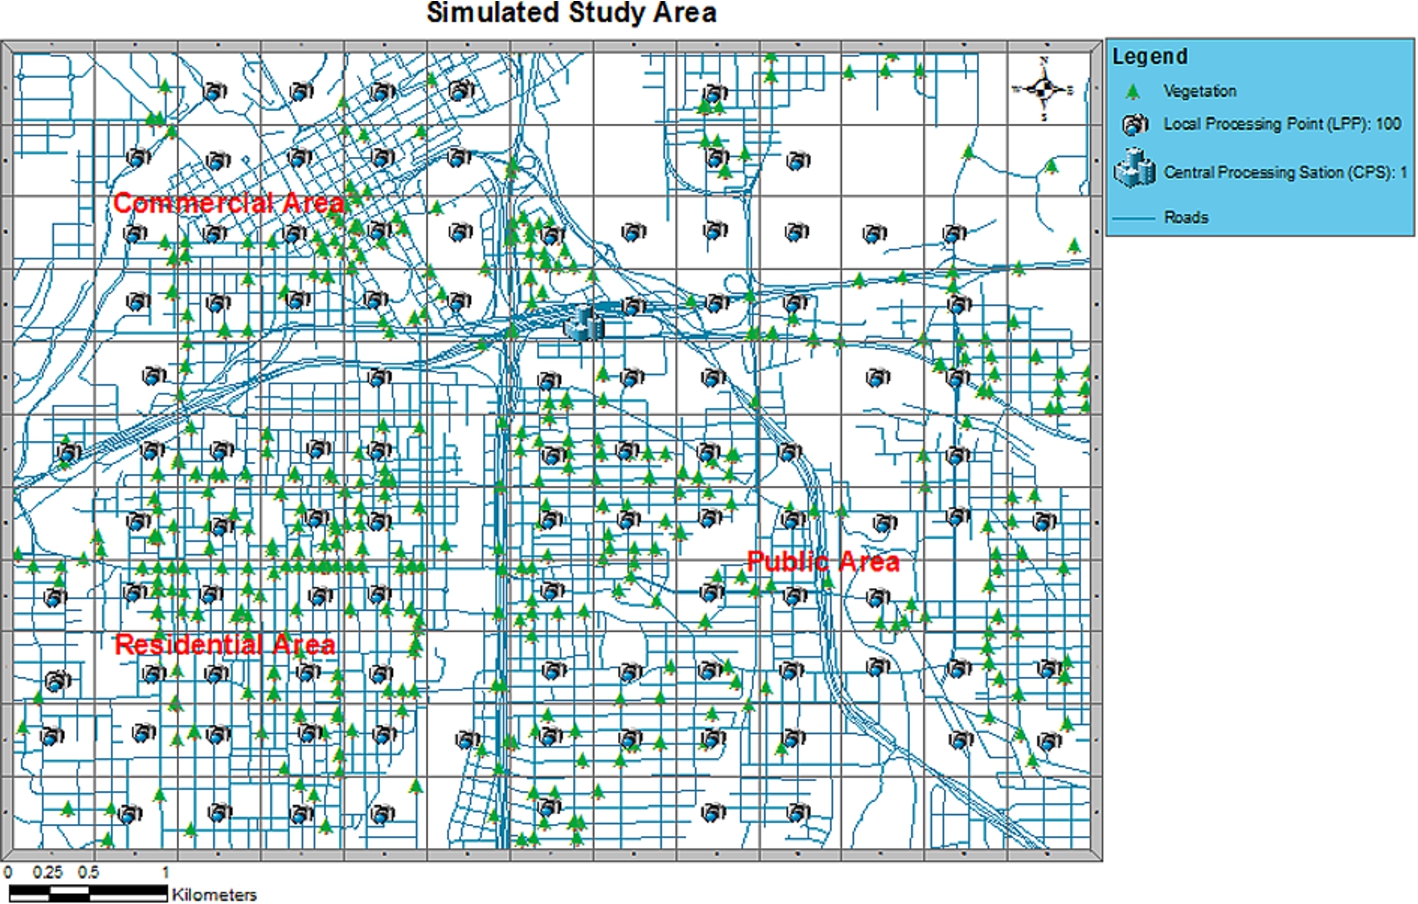
Study area with grid plan, camera network processing points, road network and zonal demarcations.
In adaptive network learning a combination of gradient method and least squares estimate to update the network parameters. Each epoch of this hybrid learning procedure is composed of a forward pass and a backward pass [15]. If we consider an adaptive network with only one output as:
Crime mapping
To visualize crime imminence levels and detect areas of high crime imminence, KDE is used. To do this, a simulated study area of 130 km2 is created as shown in Fig. 2. The area is divided into 5 zones with some terrain features like roads. To deploy a surveillance camera network in the study area, a grid network with blocks of 1000 m2 is overlaid on the area. Each grid block is then subdivided into
Experiments and results
Data collection
For the experiments violent scene detection (VSD) 2014, Hollywood Human Action (HOHA) and HMDB datasets were used. The VSD2014 datasets features diverse outdoor scenes and events that bear close alignment to real-world scenarios [25]. The dataset is collected from various sources including user-generated videos shared on the web and popular Hollywood movies ranging from very violent ones to nonviolent ones. HOHA contains short video clips from 32 movies [21]. HMDB is collected from various sources, mostly movies. The dataset contains 6849 clips divided into 51 action categories, each containing a minimum of 101 clips [20].
Video analysis experiments
To begin, 10 crime indicator events are defined and 1200 short clips from VSD datasets, 1500 short clips from HOHA and 1000 short clips from HMBD are sampled based on the event definitions.. The clips are of different lengths ranging from 3 minutes to 5 minutes and they are sampled at a framerate of 20 Hz with a pixel resolution of 640 × 480. The clips are annotated and used for training and validation. Annotation is done at video frame level and all moving objects are marked and tracked by bounding boxes.
Comparison of average accuracy (%) results for GMCP and SVM concept detectors using different descriptors
Comparison of average accuracy (%) results for GMCP and SVM concept detectors using different descriptors
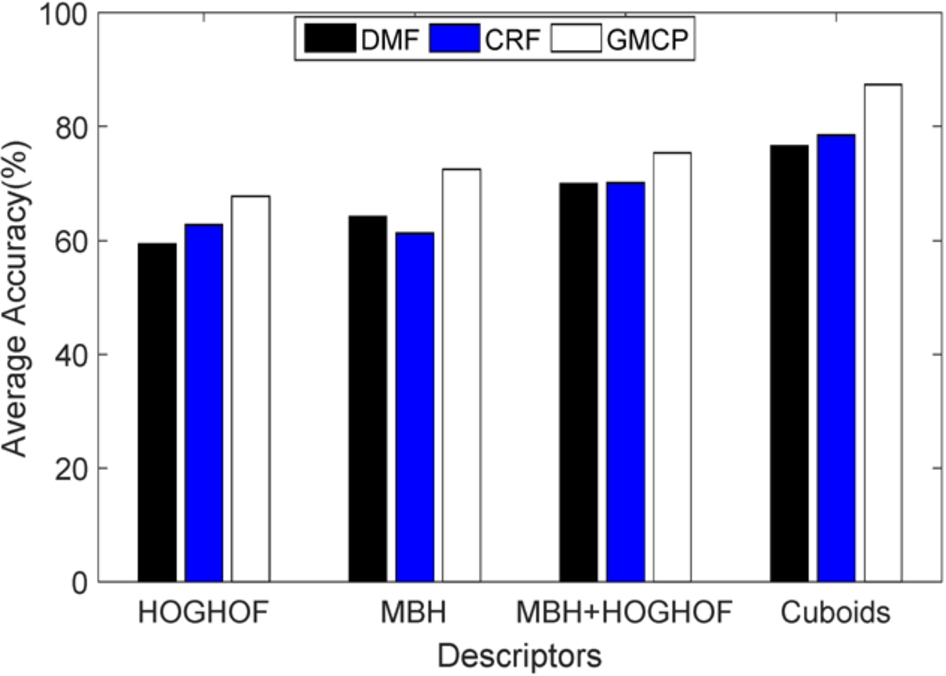
Comparison of different concept detectors using different descriptors on our sampled dataset.
To model the concept detectors, cuboids [8] features were used based on experimental results shown in Table 1. A feature codebook using cuboids features extracted from the annotated clips was constructed using K-mean clustering. K-means was initialized 10 times and the results with the lowest errors were kept. The number of visual words was fixed at 1500 and it demonstrated good results. Finally 112 binary SVMs with
To evaluate the proposed GMCP-based concept detection method, 10-fold leave-one-out cross validation approach was used. As such the reference co-occurrence matrices were extracted utilizing 9 folds of the 3700 sample annotated clips from VSD dataset and the remaining were used for validation. As a baseline 112 individual SVM concept detectors are applied to each annotated clips and the class with the highest confidence is picked as the detected concept. To make comparison with other methods, Linear Chain Conditional Random Fields (CRF) [16] and Discriminative Model Fusion (DMF) [13] were also implemented. Figure 3 shows the average accuracy of the various concept detectors using different descriptors.
From Fig. 3 it can be seen that GMCP performs better than the other concept detectors in all cases and the best performance was achieved using cuboids descriptors. It should be noted that in all cases the parameters were tuned to obtain the best performance results.
Evaluation of the classification methods
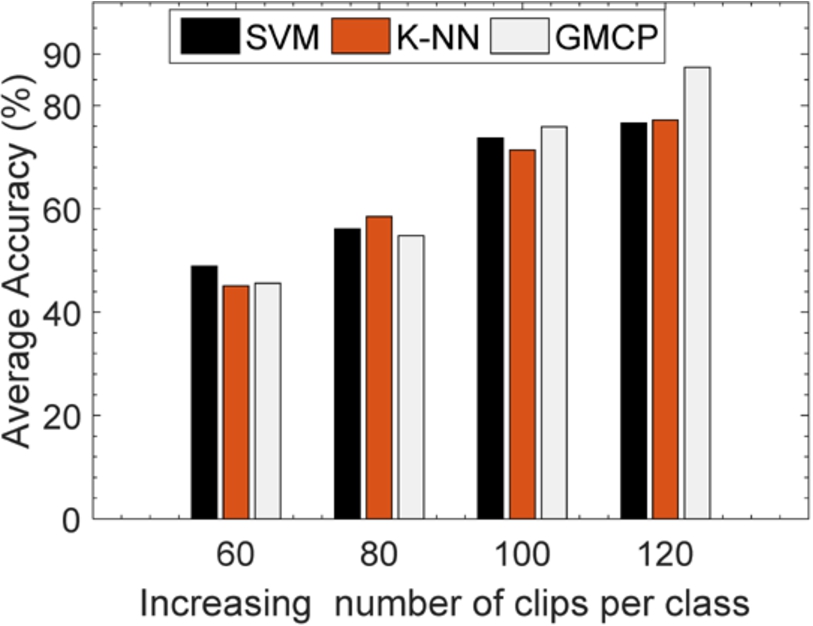
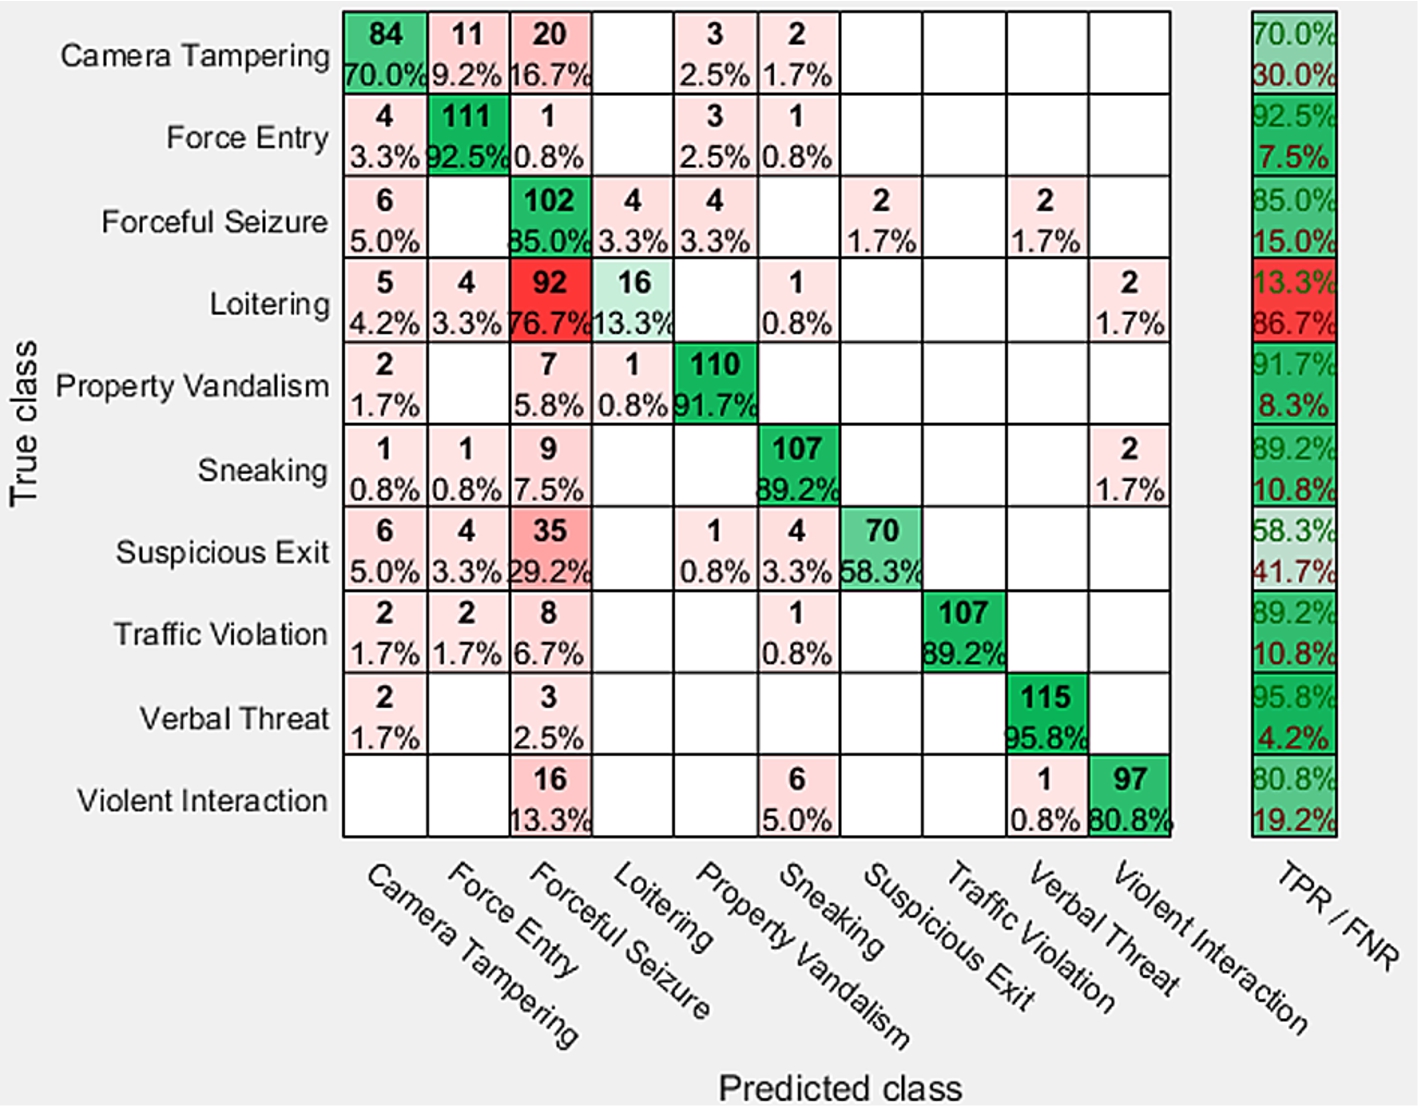
To make comparisons between of the GMCP based classification method and other well-known classification methods, a multiclass SVM [23,24] and k-nearest neighbor classifiers (k-NNs) [19,29] were also implemented. Figure 4 is a chart showing the average classification accuracy for GMCP classifier against the other classifiers. Figures 5, 6 and 7 are the confusion matrices for SVM, K-NN and GMPC classifiers respectively.
The bar chart in Fig. 4 shows the average classification accuracy for GMCP classifier against a Multiclass SVM classifier and K-NN classifier. From the bar chart it can be seen that the GMCP classifier outperforms the other classifiers. The average accuracy values are 76.6%, 77.2% and 87.4% respectively for the SVM, K-NN and GMCP classifiers. It can also be observed that the GMCP classifier improved significantly with increasing number of clips per class.
The confusion matrix in Fig. 5 shows percentages per true class for SVM classifier after performing 10-fold cross validation. The blue diagonal contains both the percentage and the number of correctly classified clips in each class. The red cells outside the diagonal contain percentage of misclassified clips in each class. From the figure it can be observed that the SVM classifier recorded its best performance in Verbal Threat class with a score of 95.8% and its worst performance in Loitering class with a score of 13.3%.
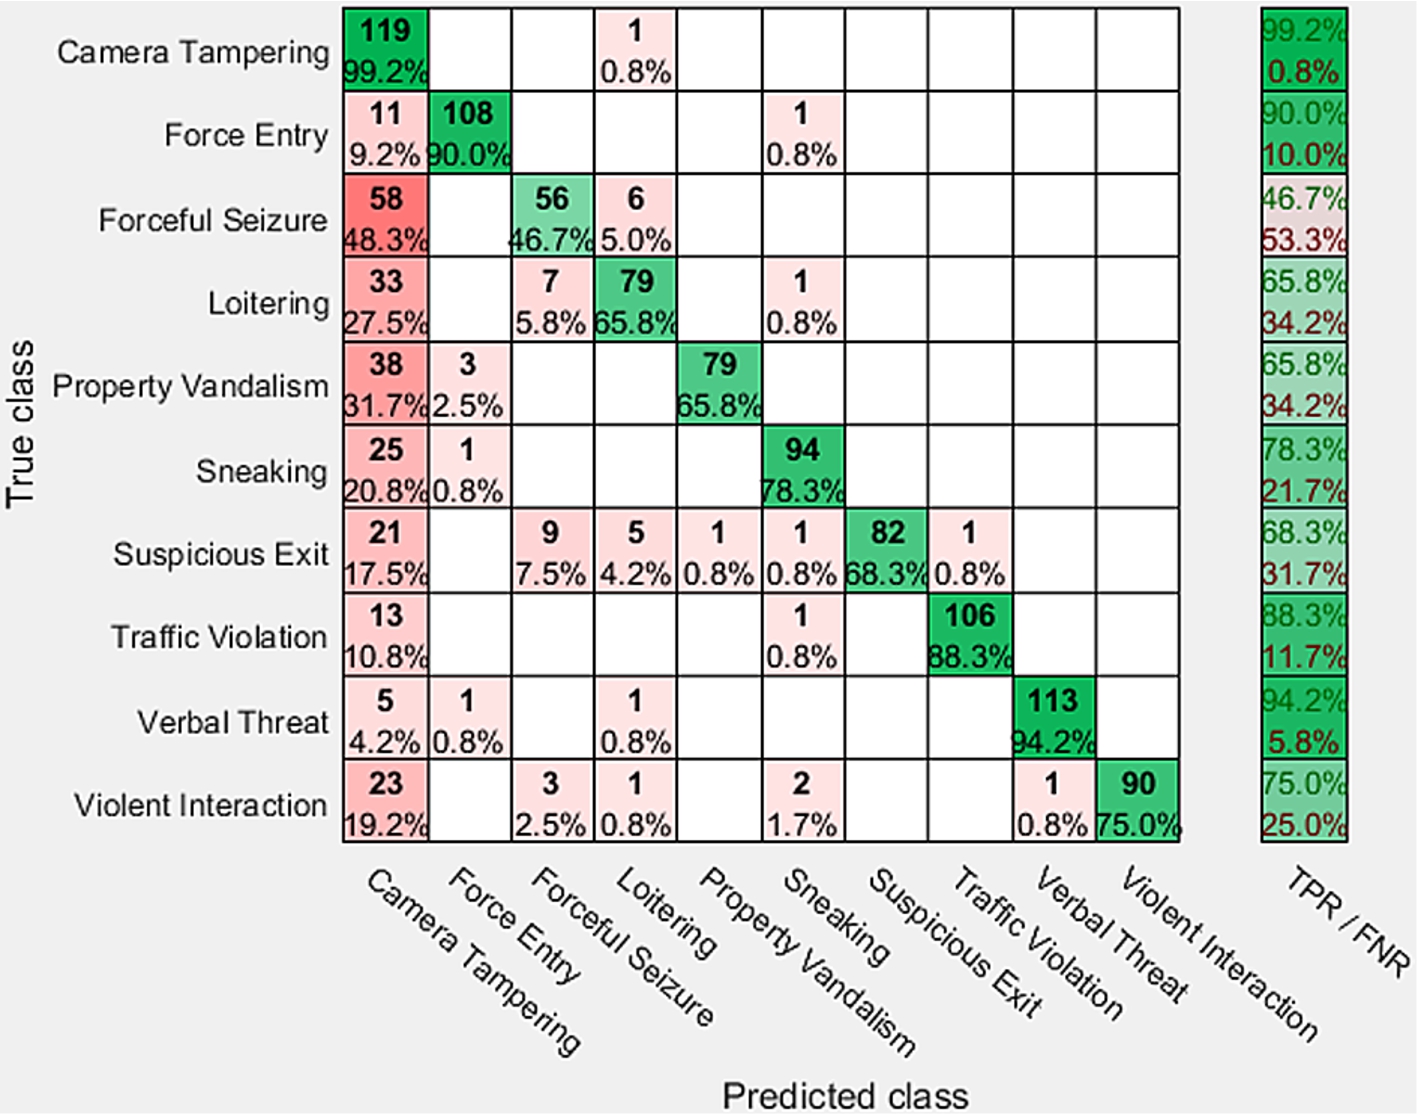
Figure 6 shows percentages per true class for K-NN classifier after performing 10-fold cross validation. Unlike the SVM classifier, the best performance of K-NN is recorded in Camera Tampering class (with a score of 99.2%) and worst performance is in Forceful Seizure class (with a score 46.7%). More importantly, with K-NN some improvements can be observed in the classes where SVM performed worst.
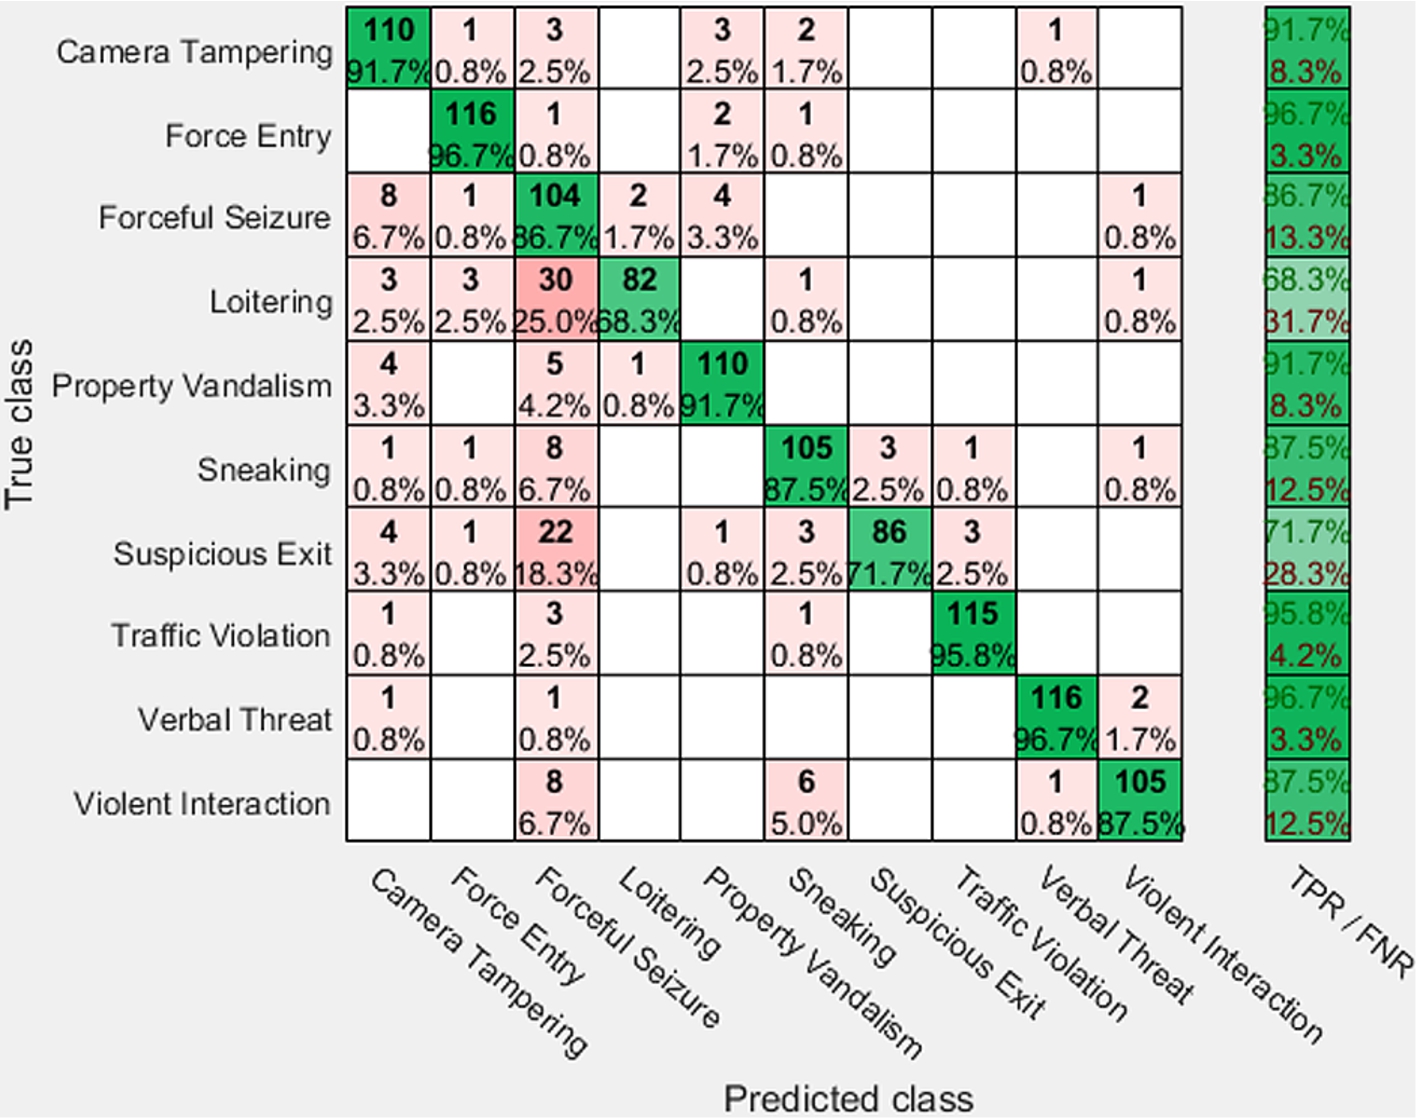
Figure 7 shows the percentages per true class for the GMCP classifier after 10-fold cross validation. It can be seen that there are significant improvements over both SVM and K-NN Classifiers. For instance, in the class where K-NN had its worst misclassification, GMCP had one of its best performances in that class (with a score of 96.7%). However, there are some observable similarities in the performance of all the three classifiers in the sense that they all recorded low values in Forceful Seizure and Suspicious Exits classes.
Crime prediction experiments
The experiments in this section are performed to model the crime predictive fuzzy inference system. This allows the extraction of the initial fuzzy rules from the training data and the tuning of the membership function parameters through adaptive learning. Four types of crimes are considered namely: robbery, burglary, larceny and battery but due to space constrain we will only show the experiments of robbery category since the procedure is similar for the rest. To start, the fuzzy inputs and output are extracted from the annotated training videos and 60% is used for training and 40% for model checking and validation. Figure 8 is a plot of the fuzzy training inputs and output.
Comparing the average accuracy of classifiers.
Confusion matrix for SVM.
Confusion matrix for K-NN.
Confusion matrix for GMCP.
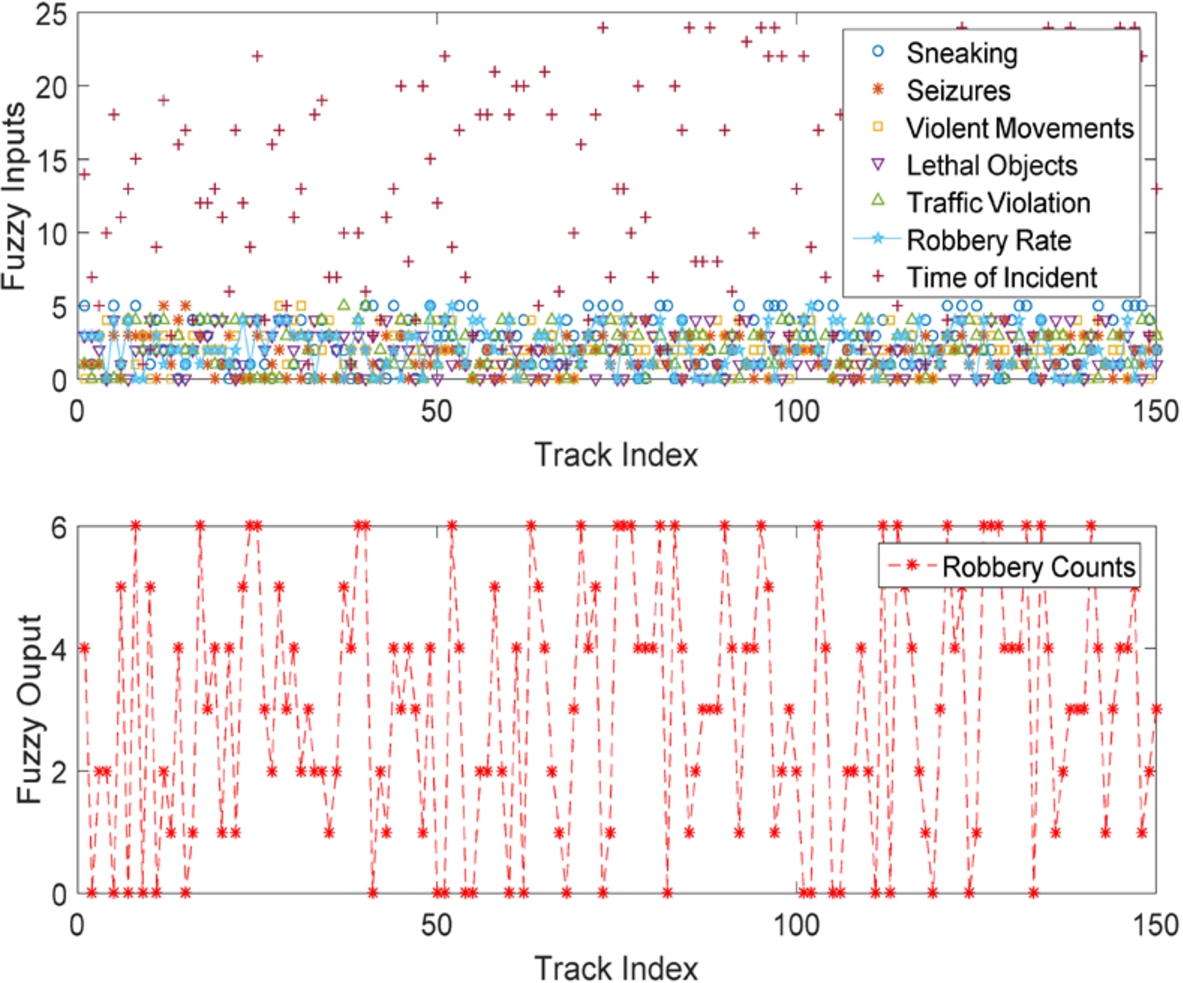
Plot of fuzzy inputs and fuzzy output for robbery class.
To construct the fuzzy inference system (FIS) model from the data, subtractive clustering is first performed using different clustering radii for different input variables (from 0.5 to 0.25). After obtaining the initial FIS model, the root mean square error is computed and used as a baseline for comparisons during adaptive learning. The system is then tested using the checking data and the results are shown in Fig. 9(a) and (b).
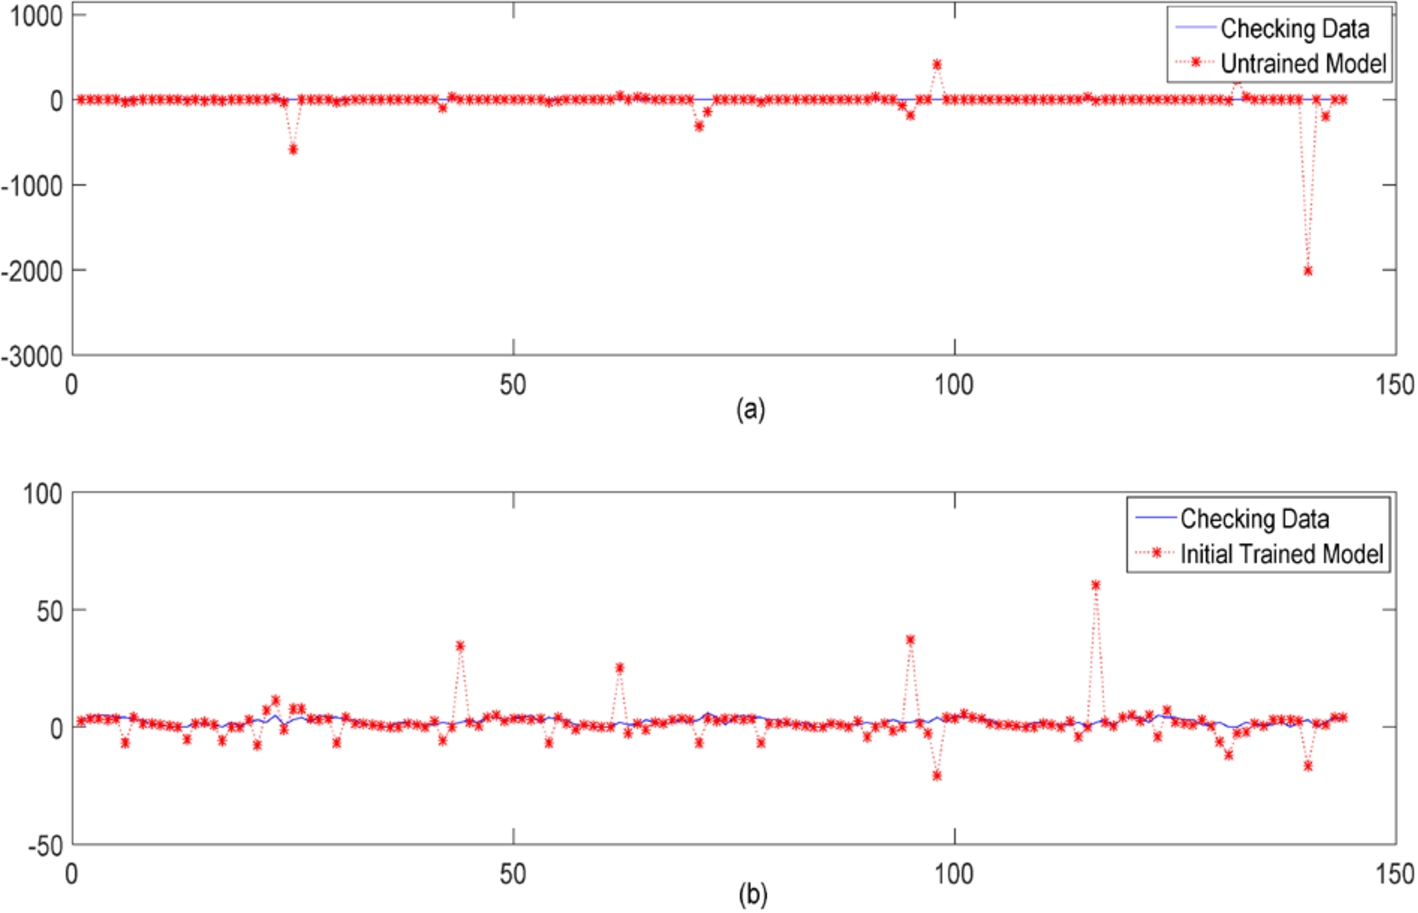
(a) Model before training. (b) Model after 40 epochs of training.
Figure 9(a) is plot of the untrained model output against the checking data. After observing the model performance in Fig. 9(a) where the checking error above is 200, the first ANFIS optimization experiment is performed using 40 training epochs with an error target of 0 and an initial step size of 0.1. Figure 9(b) is the plot of the initially improved model output against the checking data. As can be seen in Fig. 9(b) the checking error is now below 100. To further optimize the model and also test for overfitting, the model is trained again with 200 epochs and the results are shown in Figs 10(a) and (b).

(a) Testing for overfitting. (b) Comparison of initial and final Improved Models.
Figure 10(a) is the plot of the improved model output against the checking data. From the figure, it can be seen that there is no overfitting because the model is not so fitted to the checking data. This means the fuzzy system is able to generalize and can therefore be used to make predictions with different data. Figure 10(b) is the comparison of the initial trained model and the final model against the checking data.

Error plots for (a) Training, (b) checking.
Figure 11(a) is the plot of the training error. The lowest training error is 0.6968 which occurs around the 23rd epoch point after which it becomes steady. Figure 11(b) is the plot of the checking error and the lowest checking error which is 2.8751 occurs at the 170th epoch, after which it remains steady even as ANFIS tries to minimize the error till the 200th epoch point. It can also be observed that there have been some great improvements with the checking error because the initial checking error was 241.6922 which have been reduced to 2.8751. Hence the plot indicates that the model has the ability to generalize over the checking data. Figure 12 is the generated ANFIS diagramed and Fig. 13 is the modeled FIS structure.

Crime prediction ANFIS diagram.

Robbery Imminence Prediction Fuzzy Inference System (RIPFIS) Diagram. RIPFIS is a Sugeno-type inference system with 7 inputs, 33 rules and 1 output as can be seen from the figure.
The generated diagram has five layers, with the first layer being the input layer where neurons simply pass external crisp signals to the next layer. The second layer contains the input membership functions and the neurons in this layer perform fuzzification. The third layer is used to compute the rule antecedent. The rule neurons receive inputs from their respective fuzzification neurons which are then used to calculate the firing strength of each rule. The conjunction of the rule antecedents is evaluated by the “AND” operator indicated in blue in Fig. 12. The fourth layer contains the output membership functions. This layer performs defuzzification and determines the consequent parameters of the rules. The fifth layer computes the overall output using the summation of all incoming signals. After adaptive learning, a Robbery Imminence Prediction Fuzzy Inference System (RIPFIS) is created as shown in Fig. 13. RIPFIS is a Sugeno-type inference system with 7 inputs, 33 rules and 1 output.
Figure 14 is the plot of the input membership functions used to model the universe of discourse for the Robbery category. Figure 15(a) to (f) are surface plots of RIPFIS showing the functional relationship between Robbery Imminence (in y-axis) and the rest of the input variables using Robbery Rates as a constant x-axis variable. The plots are created on a

Plot of membership functions for RIPFIS input variables. The system uses a Gaussian membership function for all the inputs variables and a linear membership function for the output variable.

Plots of output surface.
Figure 15(a) is the output surface of robbery rates and time of incident. From the figure it can be seen that robbery imminence is high between the hours of 10 to 15 (GMT) with a rate of 2 to 6 robberies. From Fig. 15(b) we can see that robbery imminence tend to increase as violent movements increases from 10 to 30 counts. From Fig. 15(c) it can be seen that, with 5 to 10 item seizures there is an imminence level of 2 robberies if the robbery rate in the area is below 4. From Fig. 15(d) it can be seen that robbery imminence assumes a fairly increasing trend as sneaking activities increases. From Fig. 15(e) it can be observed that the presence of lethal objects has more influence on robbery imminence than robbery rates. From Fig. 15(f) we can make the deduction that robbery rates have more influence on robbery imminence than traffic violations.

KDE map per square kilometer using VSD1 sampled data.

KDE map per square kilometer using VSD2 sampled data.
The experiments in this section are performed to visualize crime imminence across the study area. To do this 2 separate query datasets named VSD1 and VSD2 are sampled from VSD dataset. Each query dataset contains 800 clips and each clip has at least 100 tracks. The clips are assigned to designated grid blocks and the tracks of each clip are geo-referenced to mini-grids (within the designate grid blocks) in a sequential manner. On the whole each grid has 8 clips and each mini-grid has at least 200 tracks since there are 100 designate grids of interest and 4 mini-grids within each designated grid. Hence the mini-grids represent the primary surveillance sources hosting the input videos. For the “time of incident” fuzzy inputs, the time stamp on the video frame at the spatio temporal interest point is taken. But for simplicity sake, the time is normalized on hourly bases. And for the “crime rates” fuzzy inputs, predetermined values are assigned based on expert discretion.
To perform the mapping experiments, the query datasets are deployed separately on the study area in two consecutive sessions. In each session, video analysis is first performed and then four concurrent fuzzy inference systems are used to compute the crime imminence for each grid cell. It should be noted that the four fuzzy inference systems represents the crime categories, thus at each location four different crime types are computed. A KDE map and a prediction statistics map are generated at the end of each experimental session as shown in Figs 16, 17 and 18. Before executing KDE, the distribution of the crime imminence data across the study area is first examined and standard deviation classification (grouping classes with similar values) approach is adopted since the interest here is to identify clusters with very high values.
Figure 16 is the KDE map using the first sampled dataset (VSD1) and Fig. 17 is the KDE map using the second sampled dataset (VSD2). Standard deviation classifications and a search radius of 1000 m were used in constructing both figures. The darkest spots in the figures represent predicted regions of high crime imminence.

Descriptive statistics of predicted crimes.
Figure 18 is a descriptive map showing histograms of predicted crime types at various locations. To make prediction at a particular location, a cut-off threshold of average crime imminence is set at 5. Hence any crime type with average imminence levels greater than 5 is predicted as an imminent crime in that location (it should be noted that the locations are defined by grid blocks). From Fig. 18, three types of crimes have been predicted for various locations with histogram bars indicating the strength of the predictions.
The experiments were mainly focused on depicting regions of high crime imminence and identifying crimes types with average imminence levels greater than a set threshold. But in real world deployment, further explorations can be done to determine the behavior of crime concentrated regions (hotspots), which could be acute or chronic. Determining the behavior and underlying factors in a crime imminence region is of great importance because it informs the kind of policing intervention that should be taken. For example, there can be situations where visible police presence can rather provoke or trigger crime than prevent it. Such situations may involve gangsters and psychopaths who may simply take pleasure in committing crimes just to defy the presence of law enforcement officers. So depending on the dynamics and the underlying factors police may decide to go undercover or not.
More importantly the framework proposed in this study can be used to develop a real time field decision support system for police patrols. The system can be hosted on a secured network so that police on patrol duty can interactively access real time crime imminence statistics using tablets or smart phones. Besides that, such a system can also help in giving a visual impression of how policing actions are impacting the crime atmosphere in an area.
Conclusion
The paper presented a comprehensive approach to crime prediction. The approach exploited the prospects of video surveillance in a dimension that could be useful in developing wide area crime early warning systems, crime hotspot monitoring system and a police patrol decision support system. Principally the framework is grounded on theories of criminal behavior, so a system developed based on this framework will work best in predicting crimes that fall under the rational choice, activity routine and crime pattern theories.
For feasibility testing, the framework was implemented in a simulation study area. A wide area surveillance camera network was created and used to host sampled VSD datasets on the study area. Neuro-fuzzy inference systems were built based on the dataset hosted on the network. For the visualization of regions of high crime imminence, KDE was used. On the whole the experiments were demonstrative and going forward, the intention is to implement the framework in a real world case study.
Footnotes
Acknowledgements
This research is supported by Natural Science Foundation of China (61173122).