
Abstract
Precision agriculture has different strategies to collect, process and analyze different types and nature data to be able to make decisions that improve the efficiency, productivity, quality, profitability and sustainability of agricultural production. Specifically, crop sustainability is directly related to reducing costs for farmers and minimizing environmental impact. In this paper, an application to help in the decision making about the most convenient type of crop to plant in a certain zone is developed, taking into account the climate conditions of that zone, in order to make a sustainable crop. This application is integrated within the Internet of Things system, which can be adapted and parameterized for any kind of crop and zone. The Internet of Things system components are described in detail and a fuzzy clustering model is proposed for the system’s intelligent module. This fuzzy model focuses on making a zone grouping (management zones), taking into account the zone climate conditions. The model manages fuzzy data, which allows us more extensive information and a more natural data treatment. A real study case of the proposed application is presented using data from the Region of Murcia (Spain). In this study case, the entire deployed Internet of Things system has been described, the fuzzy model to group similar areas in terms of meteorology has been validated and evaluated and the recommendation module has been implemented, taking into account the actual production data and the needed resources for the crops in the Region of Murcia (Spain).
Introduction
In the agricultural sector, numerous decisions are made every day with the aim of obtaining the best possible yield from crops, both in terms of productivity and the necessary resources to obtain a good production. Nowadays, it is important to support this decision making in the large amounts of data that are being stored from the agricultural environment. Precision agriculture can help in this decision making because it provides us strategies with the aim of improving the quality, productivity, efficiency and sustainability of crops while trying to minimize negative environmental impact [6,10].
There are a lot of mechanisms to be able to plant any type of crop in any area, however, these mechanisms imply an extra economic cost, as well as a possible natural resources over-exploitation. This causes the lack of sustainability of these crops and a high environmental cost. For example, when farmers cultivate plants that are vulnerable to cold weather in cold areas, they must use anti-frost techniques to prevent the crop loss, causing an increase of both production cost and negative environmental impact.
Internet of Things (IoT) systems have shown a new innovative research direction at the agricultural field [17]. These systems allow us to obtain a great amount of data, which are then analyzed and allow us to monitor and create decision support systems for farmers, in order to improve their benefits, decrease their costs and increase the crop production, among other functions [4]. The IoT systems are characterized by the fact that they are made up of IoT devices, connected by communication technologies that allow data collection to be analyzed by the system intelligent components. Later, they can show the possible decisions and/or actions to the end user [15]. These actions or decisions will provide information to the user, always taking into account this information must be adapted to the type of end user.
In this work, an integrated intelligent component within an IoT system is developed, to advise farmers which type of crop will have better yield and will be more sustainable in their area, in order to reduce costs and increase profits. This component communication with farmers will be done through an application for mobile devices (App), which will be proposed and designed in this work, and will have a friendly and configurable interface in order to be used in different crops and in different areas. The use of a mobile application has been chosen because still today the farmer is reluctant to technology, but the use of mobile phones has been integrated into all daily life areas.
The intelligent component is based on designing and applying a procedure of grouping regions with similar climatic conditions and then performing a yield analysis of each region to recommend farmers the type of crop with the optimal yield. This procedure takes into account the climatic conditions uncertainty, transferring it to the SoftComputing framework, that will allow us to deal with imperfect data and, therefore, to express in a more correct way the true data nature. This procedure is based on Intelligent Data Analysis process (IDA process), using the large amounts of available data from crops and weather stations that allow a non-experimental data analysis to optimize production and make agriculture more resilient to climate change.
Within the data mining phase of the IDA process a fuzzy clustering method is proposed. This method allows regions to be grouped taking into account climatic variables and to make decisions using additional crop sustainability information (management zones). Specifically, we focus on region groups from different areas of the Region of Murcia (south-east of Spain), that were obtained by the proposed fuzzy clustering technique from the collected data from various weather stations. In addition, the proposed intelligent component is validated and implemented in a real study case, where the complete IoT system is described, emphasizing the App that provides recommendations to farmers, so they can make the best decisions for their crops.
The work structure is as follows: In Section 2, works that try to solve agriculture problems using clustering techniques for management zones are reviewed. Section 3 presents the IDA process. In this process, a fuzzy clustering technique is implemented to obtain the model that generates knowledge in the IoT system. Section 4 describes and details the development and the different elements that make up the proposed farmer App, indicating its components, its integration and its deployment within the IoT system. Section 5 presents a study case where the whole IoT system is deployed, and details specific results about the usefulness and knowledge that are generated by the proposed App. Finally, Section 6 shows the conclusions of the obtained results and the different future works to be performed.
Management zones in precision agriculture problems
Precision agriculture addresses a wide range of agricultural problems with the aim of making more sustainable crops, enabling farmers to maximise their profits and reduce their losses. To predict and help to make decisions in precision agriculture, machine learning techniques can be used [10].
The most common problem farmers have to face is that they do not select crops depending on their soil necessity and weather conditions, and as a result they face serious setbacks in productivity. This problem can be addressed through precision agriculture. This strategy takes into account several parameters, viz: soil characteristics and types, weather conditions and crop yield. Data collection, which is based on these parameters, will help to suggest the farmer suitable crops to be cultivated, achieving an increase in production and a reduction in costs because more sustainable agriculture is carried out using the features of the plantation area.
It should be noted that this successful application of precision agriculture on farms requires detailed yield characterisation, limiting factors such as soil water retention capacity and extreme temperatures, identification of agronomically sound and homogeneously managed macro-areas, and selection of the most suitable crops and their management for each zone. This characterisation is defined as management zones [14]. In this framework, different contributions have been recently made, taking into account that in most of them, clustering and fuzzy clustering techniques are the most successful ones.
For example, the spatial-temporal change in agricultural distribution in Thailand is analyzed in [9] during the 2007–2015 period, using cluster, outlier and hot spots analysis. The conclusions, and main objectives of the analysis, are supporting and contributing to the energy and food security strengthening through adaptation or survival to climate change for the 2015–2021 period.
The authors of [18] address the Indian farmers problem, who do not choose to cultivate according to the soil need, and therefore they have to face a serious decline in productivity. They propose a recommendation system through a majority voting assembly model using techniques such as random tree (decision tree in which for each split just a random attribute subset is available), k-nearest neighbor and naïve bayes to recommend a suitable crop.
In [21], a study about the effective use of agricultural land by calculating economic indicators is carried out. The authors perform a cluster analysis in which three clusters in terms of economic efficiency of agricultural land use in the Lviv region are obtained.
In [23], the authors attempt to estimate the under cultivation area and the agricultural product type categorization in order to achieve sustainable development in agricultural studies. In this study, an unsupervised zoning of cultivation areas with the same cultivation pattern in Golestan Province is performed by a multi-stage method. A cluster, with Spectral Angle Mapper algorithm, producing a region mapping with the same cultivation pattern, is obtained.
The authors of [16] developed a cluster-based method to analyse the spatial relationship between a set of variables and to determine the management zones in a vineyard, taking into account some areas with homogeneous characteristics that are likely to be affected by multiple interrelated factors. The aim of obtaining these zones is to improve irrigation management and agricultural decision-making. In [11], the expectation maximization algorithm is developed to transform the seasonal rainfall series in order to identify the homogeneous rainfall zones in winter and summer crops at the state of Parana, Brazil. The authors used average monthly rainfall data which were collected from 157 weather stations over 20 years. The results indicated that at each analyzed crop, three clusters were presented, indicating low, moderate and high rainfall according to the country area. Another work that manages and tries to optimize irrigation by means of precision agriculture is presented in [7]. The study presents a performance evaluation between different statistical and clustering algorithms to analyze an irrigated field with an important soil spatial variation. In addition, the main zoning attribute, such as apparent soil electrical conductivity, space-borne satellite images and yield data were required as ancillary data. The results indicate that clustering techniques are more effective, with the apparent soil electrical conductivity attribute being the most effective one. Another work where clustering methods can obtain good results is presented in [13]. In this work, the modified approach of several clustering methods is used to group data based, on the one hand, on districts that have a similar temperature, rainfall and soil type and, on the other hand, on districts that are producing maximum crop production, focusing on wheat. Based on the obtained clustering, the optimal parameters to produce the maximum crop production in India are analyzed and obtained.
In [5], a general and comparative study on different types of clusters is carried out to group different cultivation areas. Specifically, the evaluation was carried out with data which were obtained between 2010 and 2015 from three commercial agricultural elders which were cultivated with soybean and maize in Brazil. In general, all clustering algorithms behaviour was satisfactory for the indicated purpose.
The authors of [22] conduct a Fuzzy C-Means and hierarchical/non-hierarchical grouping methods study. They apply these methods to the 15 governorates clustering in Iraq, on the basis of some agricultural crops. The authors perform a comparative study and evaluation of different statistical and fuzzy clustering methods, being the fuzzy C-means the best one. Another paper that deals with management areas through clustering techniques is presented in [8]. This paper experiments and compares the clustering algorithms C-means, fuzzy C-means, possibilistic fuzzy C-means and Linde Buzo gray to delineate management zones in precision agriculture. The objective of the zone delineation determination is for the application of the fertilization process. Sugarcane was selected as a study case for the zone delineation experimentation. This study considers 14 crop important nutrients for the delimitation. Also, in [19], the authors apply two types of cluster analysis, namely fuzzy analysis clustering (FANNY) and a hard cluster algorithm (CLARA), to delineate a farmer’s field into zones based on spatially varying soil and crop properties that should be considered for irrigation management.
As the analyzed works represent, the different clustering techniques are used with satisfactory results for management zones, covering different types of problems. Therefore, in this work a clustering technique is used to create groups with similar climatic conditions. This technique is extended to the SoftComputing framework, which allows us to improve the model interpretability and to work with data that are expressed through imprecise values (fuzzy values, intervals, …).
IDA process based on a fuzzy clustering technique
Cluster analysis is one of the most widely used techniques for solving descriptive tasks in the IDA process. This technique obtains good results when applied in agriculture field, as shown in the previous section. The idea is to partition a dataset into groups with similar characteristics. It is an unsupervised task and the obtained groups could be considered as classes.
In this work, a classical clustering algorithm fuzzy extension [12] is proposed. This technique can work with nominal and numerical attributes which are described by crisp and fuzzy values. The proposed algorithm will be named
In general, a clustering algorithm groups a dataset E into c partitions, trying to keep the data within the same group as close as possible and the groups as far as possible (cluster compactness). In these algorithms, the objective function plays an important role, whose purpose is to determine the cluster quality (computed as cluster compactness).
algorithm
This section presents an extension of the general clustering algorithm of [1]. This extension allows working with imperfect data, that is, there can be values at the input dataset that are expressed by nominal and numerical values, precise and imprecise (intervals and fuzzy sets).
Let’s suppose a set of examples
The main steps are shown in the Algorithm 1.

In Algorithm
If k attribute is numerical, the distance of Diamond [2] is used:
If k attribute is nominal, the Dubois and Prade measure [3] is used:
The update of the cluster centroids from the crisp partition
If k attribute is nominal:
If k attribute is numerical:
This section describes the different elements that are part of the developed application (denoted by
In the App development, the server is a main element since it will be the one that contains the main control core of the application. Its general operation consists of acquiring cloud data from time to time
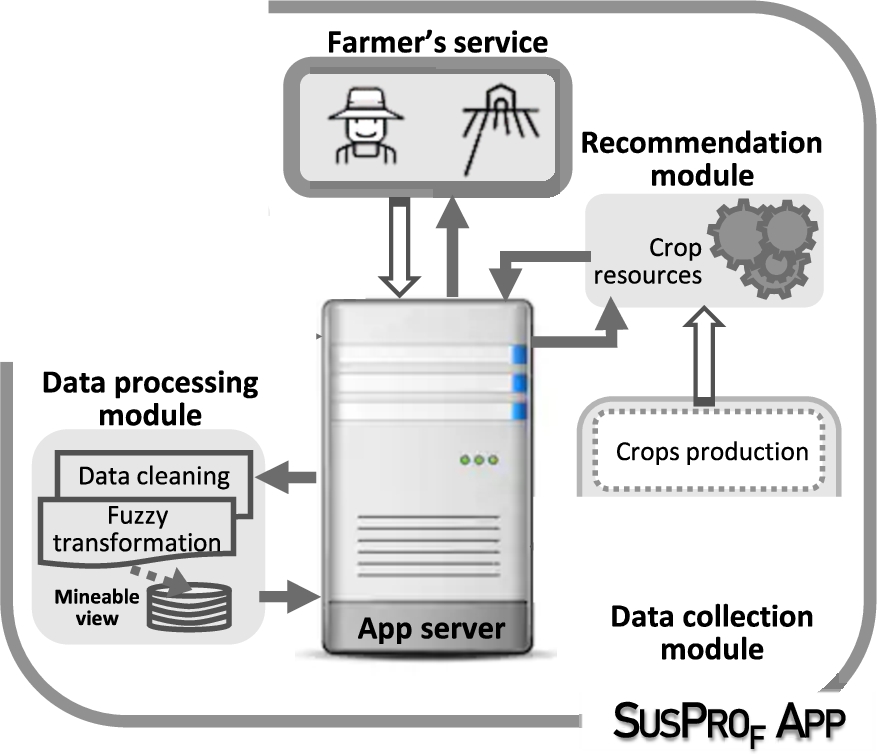
Figure 1 shows the different

Application components and their interconnections.
The flowchart in Fig. 2 shows the working scheme of the main control core of the server to carry out the system data updating.

Functional scheme for system data updating.
The provided result will be an ordered list of recommended crops based on two premises, 1) how important is the production of that crop on grounds with similar climatic conditions, and 2) the amount of necessary resources for these crops, respecting the sustainability criteria. The farmer can establish the importance of these two requirements in the information that is provided by the system, based on his/her preferences or the agrarian policies, that are established by the government in that area. In the next sections, the different modules are explained.
As we have previously commented, this module must obtain data from two different types of sources. On the one hand, it takes data to update the mineable view in order to obtain the App data mining model. On the other hand, it must collect data that allow building the recommendation to the farmer using the IDA model and the built rules. To obtain the mineable view, data sources with information about various climatic variables will be used. These data sources are provided by public weather stations that are located in various terrains of the region, where the application is deployed. For the recommendation module development, data on the production by zones of the different crops will be obtained. All of them are Open Data Sources, which are available in the cloud. The information about resources that are needed by crops (fertilizers, water, …) is previously collected.
Data preprocessing module
This module performs the necessary data processing to obtain the mineable view used by the Intelligent Data Analysis module. This module will start working every time the weather data updating of Data Collection module is activated.
In this module, among other cleaning and formatting operations, the transformation of certain data into fuzzy values will be carried out. This transformation allows, on the one hand, decreasing the attribute number in the problem and, on the other hand, to express in a more appropriate way the true nature of certain information. This is the case of attributes that provide the maximum, minimum and average values of the same measure and that can be related and expressed by a fuzzy value. This transformation provides good results when obtained data are used by appropriate intelligent data analysis techniques.
Intelligent data analysis module
The Intelligent Data Analysis module contains the fuzzy clustering algorithm proposed in this work, that can deal with described data by crisp/fuzzy values in both numerical and nominal attributes. Obviously, the application modular structure allows including the other Intelligent Data Analysis techniques that can obtain a problem description expressed by clusters and can deal with used information type. The model that is obtained in this module is updated offline every time an update of the mineable view is carried out according to the diagram represented in Fig. 2. The module also contains the technique configurable parameters specifications and includes the necessary procedure to adjust those that are necessary (for example, the c value).
Once the model is obtained by clusters using the
This physical location allows the Recommendation module to generate the output since it can access to other types of available information from those locations, for example, types of crops in those locations, used resources, profitability of crops, etc.
From the obtained knowledge from the IDA model, the rule set of the rules engine is built. For each problem attribute, a partition is defined in the form of five fuzzy labels (very low, low, medium, high, very high) to describe each cluster based on them. In general, any value that is relative to resources that are needed by a given crop will be expressed in an equivalent way by means of these labels.
Recommendation module
This is the module in charge of providing the App output in the form of recommendations to the farmer. The output consists of an ordered list with types of crops that are recommended for cultivation on the farmer’s plot. The ranking will be made based on the production amount of each crop and the resources that are used by them in areas with similar climatic conditions to the farmer’s ones, and that respect the idea of sustainable cultivation.
A farmer’s recommendation request will be made using IoT devices. The recommendation module obtains the geographical areas with climatic conditions that are similar to his/her plot according to the IDA model (information from the cluster to which the instance representing the farmer’s data belongs) and generates an ordered list in descending order of crops that are suitable for his/her plot.
Therefore, given the instance that represents the user’s data, the i cluster, to which the instance belongs, is obtained. In this cluster, there are certain ground areas a represented with their weight (
In the Recommendation module there will be available information for each ground area, which are represented in the cluster depending on the quantity each type of crop in that area produced. In addition, other information about the needed resources by the crops is also available.
The crop ranking in the final list, which is provided to the farmer, is obtained based on the score each crop X obtained:
The Recommendation module can be scaled to take into account other types of additional or different information for the user recommendations generation, based on different criteria.
Integrating the App into the IoT system
The developed App is integrated into the IoT system through the App server. For this integration, a FIWARE infrastructure [24] is used for the implementation of the App, as it facilitates the extracting, transforming and storing process of data. FIWARE is committed to the collaborative development of “smart-solutions” and technologies such as Internet of Things, Cloud Computing and Open Data.
The App server of the proposed IoT system integrates a FIWARE server. The FIWARE server is in charge of receiving the information from the weather stations sensors, storing this information and providing the appropriate web services that will be used by the graphic user interface to visualize this information, as well as to serve as a data source for the Intelligent Data Analysis module. This part of the system can be considered a key element for the proposed software architecture, as it hosts all the proposed software components running in the backend and allows users to establish the basic virtual infrastructure that is needed to run the application using the APIs provided by FIWARE.
Figure 3 shows an elements running overview on the FIWARE server, including the Intelligent Data Analysis module and the Recommendation module. Although these two modules are not directly part of FIWARE, they have been integrated to complete the functionality and data consumption that is performed by the databases which are implemented in the FIWARE server.
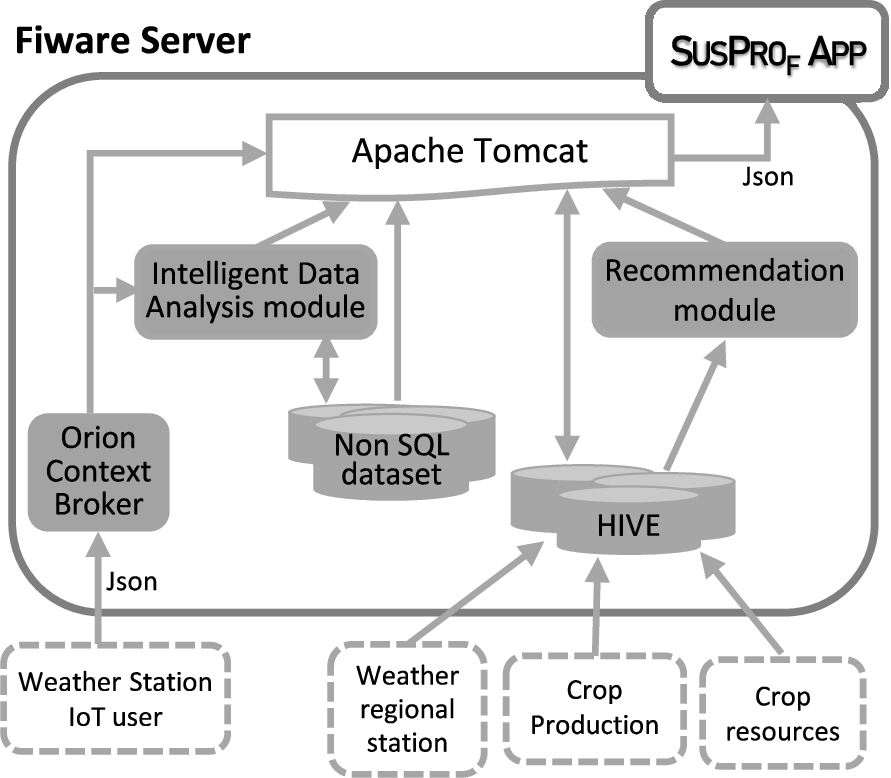
General scheme of the used FIWARE infrastructure.
As shown in Fig. 3, in order to interact with the application, data are collected by means of IoT devices (weather stations) located in the farmers’ plots (see Section 5.2.1). The context information is in a non-SQL database (Mongo DB), with the help of the Orion Context Broker. FIWARE data models appropriate to the type of information provided by these devices will be used to integrate these data into the App. In addition, the server is prepared to integrate HIVE tables to collect available data from weather stations at the region level and data to agricultural information of the recommendation module regarding production and resources in order to respect the sustainable criteria maintaining a good production.
As shown in Section 4, the App basically consists of two phases: one in charge of obtaining the intelligent model that captures the provided knowledge by the data, and the other one in charge of providing knowledge to the farmer on demand. In this section, a specific study case is shown. The case reflects the two phases of the App operation, and focuses on the Autonomous Community of the Region of Murcia (Spain). Many of the areas focus on agriculture (fruit and vegetables), which represents a strategic sector in this Region economy. A crucial aspect in this economy is the agro-food production for export, since it represents a percentage of more than 50% of the regional market. 50% of their total area is used for cultivation (67% as dry land and 33% as irrigated land). It should be noted that if the App has been used previously, the obtained model from the data will have already been calculated and, therefore, the App will directly continue with phase 2.
Running the App: Obtaining the models and useful knowledge
During phase 1, the App activates the modules shown in Fig. 4.

Components activated when the App performs modeling and obtains useful knowledge.
The App starts with the “Data collection module” collecting more technical information. The used information of these areas from the weather information point of view is obtained from the Agricultural Information Service (SIAM,
Description of the weather stations in study of the Region of Murcia, Spain

Description of the weather stations in study of the Region of Murcia, Spain
Each station is equipped with the following sensors and ephemeris: weather vane, radiometer, rain gauge, data-logger and thermo-hygrometer. The collected information corresponds to 4 years during the periods from 01/12/2016 to 31/03/2019 (approximately the meteorological winter). The initial data, which were obtained from SIAM sensors, correspond to values obtained every 5 minutes and they are grouped 12 by 12 to show values each hour. For this reason, some of the measurements show the minimum, mean and maximum values for each hour. The obtained information is shown in Table 2.
Information collected every hour for each station (noted with its station code)
From the collected information, the App continues with the “Data processing module”. All measured attributes are used, where attributes with several values for the same measurement (min, med, max) are transformed into fuzzy attributes. The fuzzy attributes are “Relative humidity” (
Fuzzy attributes are represented by trapezoidal fuzzy values
The measure values that correspond to the missing values have been maintained. In these cases, the constructed attributes contain trapezoidal fuzzy numbers
Therefore, the dataset that the module returns to the server is formed by 104544 instances with 10 attributes joint to the station code. In Table 3, the descriptive information of this dataset is shown.
Descriptive information of the built dataset containing 104544 instances (8712 per station) and 10 attributes and the station code
Descriptive information of the built dataset containing 104544 instances (8712 per station) and 10 attributes and the station code
At this stage, the App continues with the “Intelligent Data Analysis module”. For this module operation, the App uses the available dataset. Initially, this module uses the
Executing the
Behavior of the J function according to the c parameter – relative decline (%↓)
Behavior of the J function according to the c parameter – relative decline (%↓)
The obtained model is described in Table 5.
Model with
Table 5 shows the group characteristics according to the attribute values. As can be seen, the cluster centroids for attributes
“Intelligent Data Analysis module” continues analyzing the obtained cluster. The module analyzes each group of the selected cluster using the station labels in order to check similar behaviours related to different cultivation areas.
The groups size of this cluster is the following (in parenthesis the percentage that represents with regard to the instance total of the dataset): Group 1 = 53027 (50.72%), Group 2 = 18201 (17.41%), Group 3 = 33316 (31.87%). And, in addition, the collected information from the different groups related to the 12 stations is the following:
Group 1 (50.72% of the instance total) includes the following stations, where the percentage of the instances of each station is indicated: CR12 (67.69%), JU71 (67.32%), JU81 (68.22%), MO22 (67.37%), CI42 (69.28%), CI52 (69.79%), CR32 (70.96%), AL41 (65.23%) and TP91 (62.82%).
Group 2 (17.41% of instances). This group includes the stations: JU42 (69.82%), LO21 (69.26%) and LO41 (69.83%).
Group 3 (31.87% of instances). This group includes the stations: CR12 (32.31%), JU42 (30.18%), JU71 (32.68%), LO21 (30.74%), JU81 (31.78%), MO22 (32.63%), CI42 (30.72%), CI52 (30.21%), CR32 29.04%), AL41 (34.77%), LO41 (30.17%) and TP91 (37.18%).
In order to use the characteristics of each group in a more comprehensible way for the farmer, the numerical attributes domains (
Centroids with labels: VL – Very Low, L – Low, M – Medium, H – High, VH – Very High; for WD,
,
,
,
,
,
,
,
; for Hf_R,
,
,
Centroids with labels: VL – Very Low, L – Low, M – Medium, H – High, VH – Very High; for WD,
Thus, with this more comprehensive cluster characterization, the analysis of Table 6 and the information related to the stations in each group, the following knowledge is obtained:
All groups obtain a very low average rainfall value for the analysed period.
Groups 1 and 2 have the common characteristics of very low solar radiation, predominantly non-sunny days, high relative humidity, wind speed is very low/low and positive units of cold.
Group 1 includes 9 stations that are located in the Central and South Altiplano, Vega del Segura, West Valle del Guadalentín and Cartagena areas. Group 2 includes the rest of the areas, that is, the 3 stations that are located in the East Valle del Guadalentín, and the Northern Altiplano. Group 2 differs from Group 1 by showing south-west/south winds, a lot of variation in accumulated radiation and low temperature, while in Group 1 there is a south-west wind direction, very low accumulated radiation and a low/medium temperature.
Group 3 has the characteristic of predominantly sunny days, medium cooling units, very low radiation, low/medium accumulated radiation, medium relative humidity, medium temperature and very low to medium wind speed from the south/south-west.
As described in the “Intelligent Data Analysis module”, the rules whose resources have been activated by the selected crops in the farmer’s similar areas will be used. These rules will be those that include the resource component which will be used by the crops with a better agreement with the climatic conditions of the specific area. Some rule examples will be shown in the next section.
During phase 2, the App activates the modules shown in Fig. 5.
Components activated when the App performs the recommendation process for a request.
The server already has a model, which is described with three clusters and knowledge that characterizes different zones by means of their climatic conditions. In this phase 2, the App makes use of the information that is related to the production of the different areas of study and develops recommendations for the farmer when requested.
Again, the App uses the “Data collection module” to collect production information (it uses official pages1
The interaction with the farmer is performed by means of personalized information of his/her plot that is collected using an IoT system (e.g. a local weather station). The used IoT system in this study case is currently deployed on a plot of land in the municipality of Cieza (altitude 324 m) of the Region of Murcia, Spain. The system deployment is shown in Fig. 6.
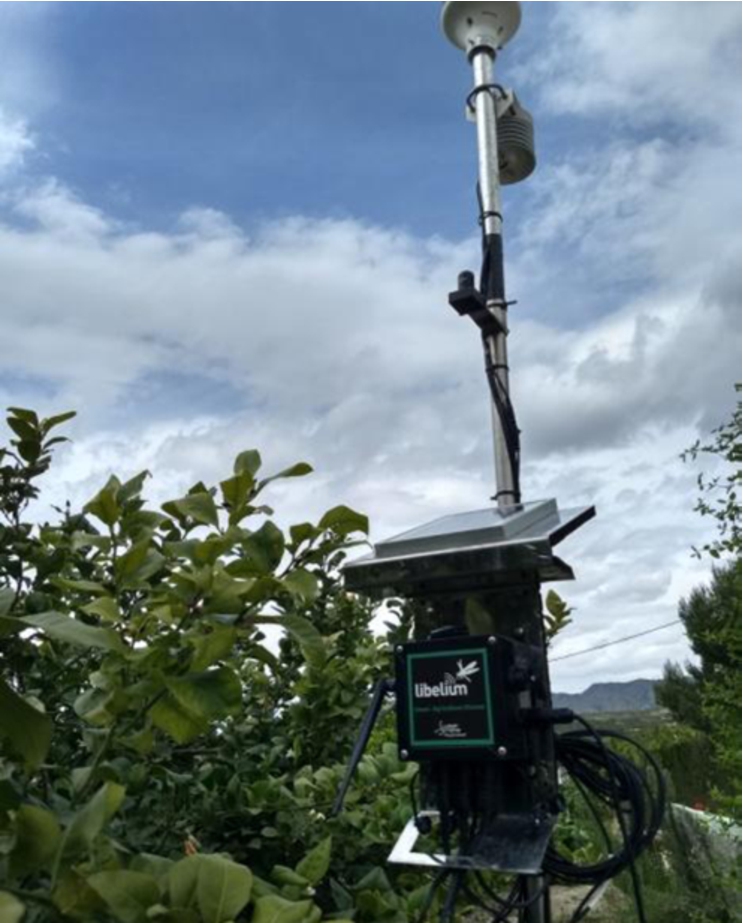
Local meteorological data collection system.
Figure 6 shows some of the components that make up the IoT system, such as the different sensors to collect information and the communication aerials.2
These sensors collect information on air humidity and temperature, pressure level, rainfall, wind direction, wind speed, soil temperature, soil conductivity, soil permitivity, leaf wetness, vaporization, solar radiation and luminosity.
Finally, it is important to note that this device, shown in Fig. 6, has more sensors than needed for the proposed intelligent component. However, this allows us to collect accurate information and, in the future, to add this information to the clustering technique, for example, soil characteristics, leaf wetness or vaporization.
This local IoT system collects the information for several days, and the server activates the “Data processing module” to obtain the input instances average and to transform it into the attributes that are collected in the model. From this instance of information from the farmer’s plot, the server uses the available model to obtain the Region areas with similar weather conditions. From this information, the obtained knowledge in “phase 1”, the needed resources by crops, and the collected data regarding production, the “recommendation module” generates a decreasing order list of suitable crops for the plot. This order is influenced by the weights that were indicated by the farmer to the production information and plot and crop resources of the areas that are similar to it.
In the specific case that is going to be developed, once the local IoT system readings have been taken for 15 days, the mean vector (
Vector that represents the weather conditions of the farmer’s plot
Vector that represents the weather conditions of the farmer’s plot
From the available cluster, the distances of the vector, that is associated with the plot, to the different cluster centroids are
Therefore, the area weights,
The collected information about the main crops in these areas is shown in the Table 8. Specifically, the main fruit trees of each area are shown with their production weight and measures related to the modeled attributes in the system that characterize them (water they need, cooling units, humidity, sun and temperature). The more similar the characteristics of a crop X to those of the areas considered in the selected cluster i (
In Table 8, value “?” indicates a missing measure. In this table, the values of many attributes are expressed with imprecise values because they have been found this way in the consulted data sources. This fact shows the importance of incorporating the treatment of imprecise data in the systems and IDA models.
Main fruit trees by area and their characteristics
With all the available information, the value
For example, if we focus on the water resource, according to this attribute partition and the information about this resource in the group i ( If water(X) is VL then If water(X) is L then If water(X) is M then If water(X) is H then If water(X) is VH then
where X is the considered crop. In general, the defined rules for each considered resource indicate that the more similar the requirements of a crop are to the features of the group to which it belongs, the more sustainable it is, and therefore, a higher score is assigned. This way, the output that is generated by the system takes into account, in addition to production, which crops can be grown in a more natural way and with fewer artificially provided resources.
When values
Table 9 shows the effect of considering or not the crop sustainability. When values
In this work, an intelligent component, which is integrated within an IoT system, is developed to advise farmers which type of crop will have more yield and will be more sustainable in their area, in order to reduce costs and increase profits. As part of the intelligent component, a fuzzy clustering technique,
As future work, we propose the inclusion in the proposed fuzzy clustering model of soil parameters information, which can help to identify the area similarities, not only from the climatic point of view, but also taking advantage of the area natural resources. This information has not been included in this study due to lack of public information on soil types in the area where the study has been carried out.
Footnotes
Acknowledgement
Supported by the projects TIN2017-86885-R (AEI/ FEDER, UE) and RTC-2017-6389-5, granted by the Ministry of Economy and Competitiveness of Spain (including ERDF support).