
Abstract
This systematic literature review presents the computational methods of human behaviour prediction research from Pentland and Liu’s seminal 1999 paper on human behaviour prediction to the latest research to date. The PRISMA framework for systematic reviews was used as the review methodology to structure this information aggregation. This review provides a high-level summary of the field with key areas identified for new research. The results show that there are frequently used datasets for training predictive models: MavHome, MavLab, LIARA, CASAS, PlaceLab, and REDD. Accuracies in the range of 43.9% to 100% for predictions of varying complexity. Common data structures for modelling behavioural data: Vectors, tables, trees, Markov models, and graphs. Algorithms that fall into three distinct categories: Machine Learning (NN, RL, LSTM), Probabilistic Graphical Models (namely Bayesian and Markov variants), and Statistical and Trend Analysis (ARIMA, Prophet). Additionally, we document other notably useful algorithms that fall outside of these three main categories including Jaro-Winkler and Levenshtein distances. Opportunities identified for further research include the use of audio as the data source for behaviour prediction methods, and applying times-series prediction machine learning algorithms (RNN, LSTM) to the smart home problem space.
Keywords
Introduction
There is a rapidly growing interest in smart home and assistive living technology, and predicting human behaviour is a key component of progressing from reactive to pre-emptive systems in smart environments. The resurgence of machine learning, computer vision, and other Artificial Intelligence (AI) fields in the last decade has created new opportunities for human behavioural prediction in assisting people in their homes, workplaces, vehicles, and healthcare scenarios. This review collates data and methods of behaviour prediction, covering over 20 years of research, to identify where new research opportunities exist in this field, and provide a foundation of knowledge for further research.
Background
This systematic review of computational methods of human behaviour prediction examines key algorithms and datasets with the purpose of determining what the most relevant advancements are for computationally predicting human behavioural outcomes. The review is bounded from 1999 to 2022, starting with the highly cited Pentland and Liu paper [49] which began the new generation of behaviour prediction work in computer science, and includes research up to the present day, at the time of writing. This review addresses a gap in the literature of an aggregate of the key work in this area, presented as an accessible summary of the important sub-fields and computational methods, and provides a starting point for researchers new to this field. The authors used this literature review as the foundation for behaviour prediction research at the University of Manchester. It was first conducted in 2018 and then updated in 2022 to share with the wider research community. As such the data tables include both the original and updated review papers and the aggregate data from both in the analysis.
Key concepts in behaviour prediction
The behaviour prediction field builds upon work in object recognition, action recognition, and behaviour modelling, also known as Human Activity Recognition (HAR). Action or object recognition uses discrete classifiers to determine an object or event such as dog, cat, human or waving, walking, running – for example. This is usually achieved through computer vision analysis of images or video combined with a classification model. These datasets are built up by using human classifiers to label video or images so they can be correctly validated to determine the model accuracy. Once we have these discrete attributes and an ability to classify them it becomes possible to model the behaviours of humans, perhaps using a knowledge graph or other suitable data structure. For example, we can model the behaviour of a human by connecting its action attributes such as talk, eat, walk, run, sit, and sleep. We now have a human model, but how do we know what it will do next? A prediction algorithm takes the features of human behaviour and calculates – through various different methods as detailed later in this paper – and determines which behaviour, or state, will happen next. These techniques are known as Human Activity Prediction (HAP), and are often a probabilistic state change value determined by previously observed data of the human’s behaviours and how one state can lead to another. For example ‘run’ will rarely precede ‘sleep’, but ‘eat’ may often occur before ‘sleep’ and so it will have a higher likelihood of being the next state after eating.
Much of the work by the research community in recent years has focussed on solving the foundational problem of activity recognition [14,18,24,25,50], which is instrumental in providing the labelled data for prediction models. All of the predictive methods found in this review build upon the work done by the research community in activity recognition, and it is important to understand the dependent relationship between HAR and HAP, as shown in the diagram in Figure 1.
Action and object recognition are the building blocks or precursor that we use to generate the base data to understand what a human is doing. These algorithms are out of scope of this review, however, all we need to understand is that action recognition algorithms generate the labelled sequence of events used for modelling. Connecting these singular classified events together creates a model of actions or events we understand as behaviours. These models can be sequential time series tables, or they could be graph-like state change models. Prediction algorithms then use these models to calculate which is the most likely next event or activity.

The process of next event prediction.
The objective of this review was to create a summary of the key information in this field needed for further computer science research. To achieve this we set the three research questions below, which will provide the foundation level of knowledge needed to conduct novel investigations in human behaviour prediction. These questions will determine these pieces of information: datasets, modelling, and prediction algorithms.
Answered in Section 4.1 Answered in Section 4.2 Answered in Section 4.3
Review methodology
We used the PRISMA checklist for selection and review of papers, and modified the results and discussion sections to exclude areas that are focussed on clinical research rather than computer science. You will see this reflected in the review sections later in this paper. For this review we wanted to answer the knowledge discovery research questions in Section 1.3. A granular examination of each dataset and algorithm is out of scope for this review but it would be a good research opportunity for future work. As such this review presents a high-level overview of the key information, with relevant comparisons and elaboration where necessary.
Methods
Protocol
The search and selection have all followed the PRISMA guidelines,1
PRISMA, prisma-statement.org.
Systematic review protocol,
Systematic review data,
The eligibility criteria used for this systematic review are as follows.
The study’s main concern is predicting human behaviour, and this is indicated in the title with the keywords: predict, prediction, predicting, forecast, or forecasting.
The study was produced from 1999 to 2022.
The study is not already included from a different database.
The study uses computational methods.
The study is a primary study.
These criteria are derived from Boland et al. [10] and were agreed with the co-reviewers before proceeding to the search and selection stage.
Information sources
The following databases have been searched: Google Scholar, ACM digital library, IEEE Xplore, ScienceDirect, SpringerLink, and Wiley Online Library. This list of databases was compiled from the sources found in the scoping search in Google Scholar, which aggregates papers from different sources. This included the most recognised platform for computer science research (ACM), along with well known publishing sources (IEEE, Springer, Wiley, and Elsevier (ScienceDirect)).
For the scope of this systematic review the databases listed above are comprehensive and cover a large amount of research material to both reduce bias, and be reassured that a reasonable effort has been made to cover all the significant material.
Search
The search and selection process followed those detailed in the PRISMA guidelines. The keyword search used ‘human behavior prediction’ as its base search terms – from the title of the 1999 Pentland and Liu paper [49], along with combinations of synonyms and spelling variations (U.S. and British) as seen in Table 1. Boolean operators were also used to improve the accuracy of search results.
Search term synonym/variation table
Search term synonym/variation table
The search string was constructed using the synonyms in each column of Table 1 and combined into one boolean string.
Each database was searched for all papers that matched the search criteria, before being filtered using the inclusion criteria in Section 2.2 and the quality assessment below.
The main literature search and de-duplication was conducted using a Python script that either calls the database API directly, uses the Crossref API, or uses web scraping to acquire the search data. The script requests the first 1000 entries for the search string from each database (or fewer if less than 1000 are available). Resulting in a maximum of 6000 papers for this review.
The lists of papers were then de-duplicated, and at the same time filtered for some of the inclusion criteria: published date, and keywords in the title. This part was quite aggressive in only including results with the string predict or forecast in the title, and as such reduced the number of results from 3360 to 134. The results for each stage of the process for the main database search and selection are shown in Table 2.
Main search and selection process
Main search and selection process
The Python search code is available online at Github,4
Python API search and de-duplication,
To check this process was not excluding relevant papers, 33 papers (approximately 1% of the initial search results) were randomly selected from the list of 3360. The papers were selected using a random number generator in a Python script that only selected papers that had previously been excluded. The random number corresponded to the spreadsheet row number in the list of papers. The results of the test to validate the filtering process show that none of the 33 random papers selected passed the eligibility criteria – therefore validating the title keyword and publication date filter. The list of random papers, Python script, and inclusion criteria test are available online.5
Filter validation files,
Finally each paper was assessed and awarded points based on the following criteria: 1 point if it meets the criteria, 0.5 points if it partly meets the criteria, or 0 (zero) if it does not meet the criteria. Papers with a score of less than 4 (four), a QA of less than 80%, were rejected.
QA 1: Is there is a clear statement of the aim of the research?
QA 2: Is the work put into context of other research?
QA 3: Are system or algorithm design decisions explained?
QA 4: Is the methodology throughly explained and reproducible?
QA 5: Are the results clear and include appropriate analysis?
These criteria were derived from Kofod-petersen [33], and agreed with the co-reviewers verifying the protocol, as appropriate for filtering out low quality papers.
To minimise subjective bias in the review process, the review search and selection (including inclusion criteria and quality assessment) was conducted by three PhD researchers from the University of Manchester’s Interaction Analysis and Modelling Lab.6
IAM Lab,
The data to answer the systematic review objectives was extracted from each of the final papers into a spreadsheet. High level attributes of each study plus prediction accuracy were sufficient for the data summary performed here to produce a list of methods and algorithms, and their respective accuracies.
Data items
The data collected from each source: Input data type, input dataset, data structure used to represent behaviour, processing method/algorithm used, output model or data, prediction accuracy (%), results analysis used, use cases stated, keywords.
Results
Data extraction
The key data extracted from the literature includes the smart home datasets used; prediction algorithms; data structures used for modelling behaviour; and input data types e.g. sensors, video, location data; and keywords and use cases from each of the papers e.g. Ambient Assistive Living (AAL). The key extracted data can be found in Tables 3, 4, 5, and 6.
Data extraction: algorithm accuracies
Data extraction: algorithm accuracies
Data extraction: input data types
Data extraction: data structures for modelling behaviour
Data extraction: use cases and keywords
Full research data extracted from the final papers (listed in Table 7 is available online for re-use, validation, and further research.7
Final review papers
Many of the studies use freely available datasets from research universities such as MIT or Washington State. These are Mavhome,8
The datasets contain different input data types from smart environments, see Fig. 2, including sensors placed around a home, power consumption of different appliances, device operations, location data, video, and accelerometers. A comparison of the dataset to highest recorded prediction accuracies in Table 8 shows that MavHome, CASAS, LIARA, and Placelab have generated comparable high accuracies from their data.

Input data types.
Dataset/algorithm prediction accuracies

Choosing a data structure to model behaviour is an important precursor to behaviour prediction. We can see in Table 9 that the literature shows behavioural activities are modelled in five different ways: Graphs, Markov graphs, Time-series tables, Tree, and Vector. Fundamental to modelling this type of data is representing the sequential or temporal nature of the data in the data structure.
Dataset/behaviour modelling data structure prediction accuracies
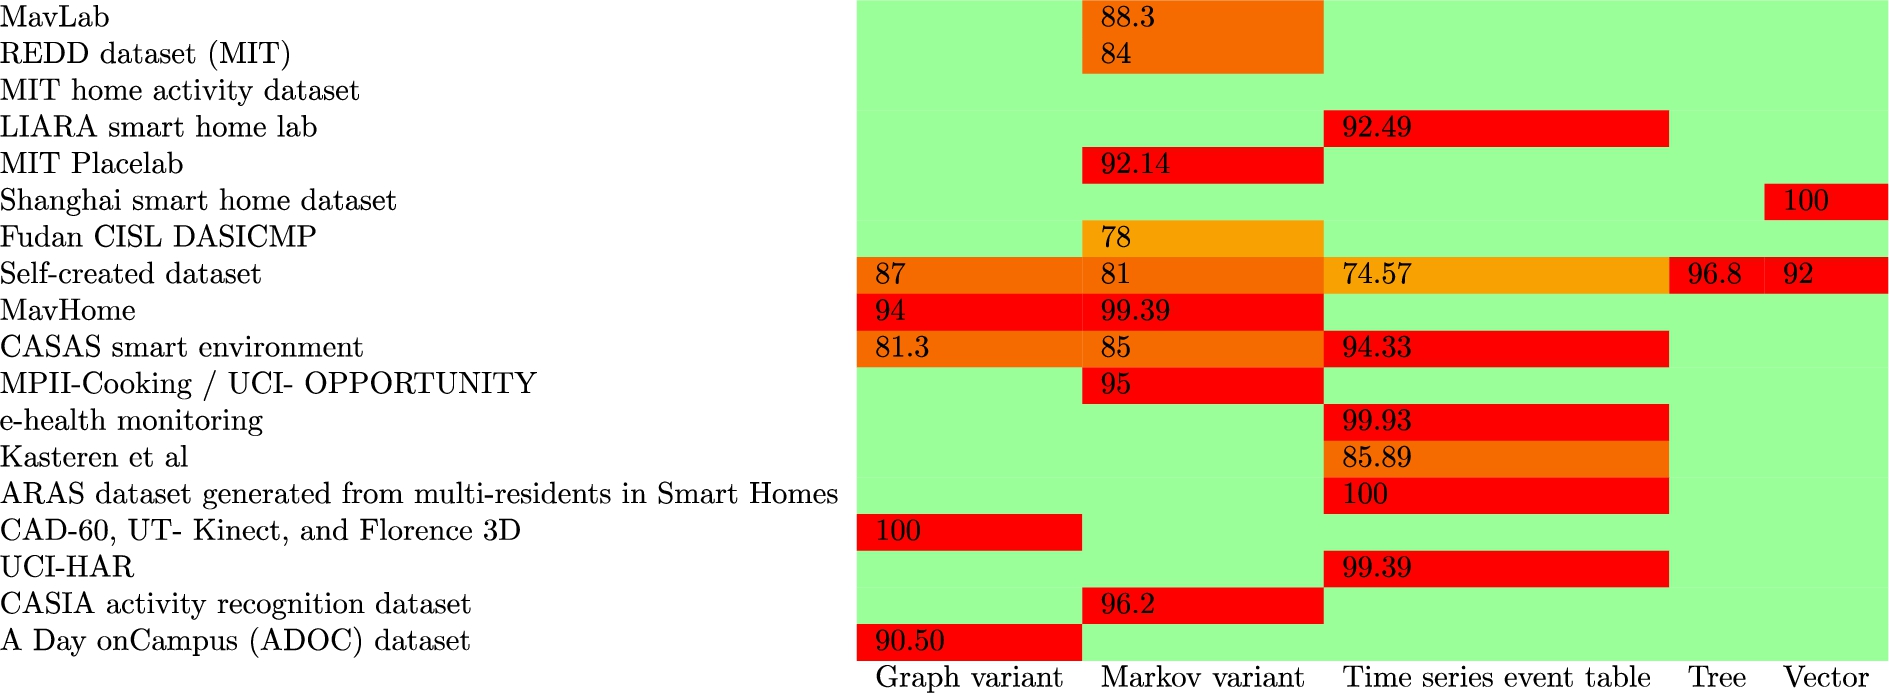
Dataset/behaviour modelling data structure prediction accuracies
Vectors are the simplest of all these data structures. We can imagine a sequence of events represented as sensor values
To model more complex relationships between events, activities, and data points within a smart environment we must look at data structures that can support a higher number of dimensions, and be extensible to advanced algorithmic processing. Graph data structures are an ideal candidate and lend themselves well to behaviour modelling where vertices represent activities or events, and edges represent the connections or transitions between them. A graph can show causality by following the chain of vertices, and is incredibly versatile in enabling calculations to be performed on the edges or on the vertices using many different computational methods. Graphs also have notable subsets which include Markov variants that can reduce down the number of states by grouping them, so only the current state or n-th number of states is considered in a transition rather than a longer sequence of events. Trees are another type of graph, acyclic in nature, that represent the behavioural data in the opposite way to Markov graphs, in that they are purely causal in showing how one event leads to another. Graph data structures and combinations of different types of graphs have the most potential to computationally represent highly complex behaviours.
Prediction algorithms or methods fall into three categories: Machine Learning (ML), Probabilistic Graphical Models (PGMs), and Statistical and Trend Analysis [62]. Machine learning algorithm variants include Reinforcement Learning (RL) [4,28], Neural Networks (NN) [2,38,61] [45], Recurrent Neural Networks (RNN) [5], Long Short Term Memory (LSTM) [5,29], and Support Vector Machines (SVM) [29]. Probabilistic Graphical Models include SPEED algorithm variants (sequence prediction via enhanced episode discovery) [3,22,43] and CRAFFT algorithm variants (current activity and features to predict next features/Bayesian network) [48]. Lastly, Statistical and Trend Analysis which includes Facebook’s Prophet, ARIMA, and SARIMA [55,57]. A full list of algorithms can be found in Table 3, and a simple relationship between data structures and algorithms can be found below in Table 10.
Data structures and corresponding prediction algorithm types
Data structures and corresponding prediction algorithm types
The prediction accuracies range from 43.9 to 100, as seen in Table 3. However, the studies were predicting different behaviour types so future research would need to differentiate based on their use case. Some studies focussed on complex behaviours such as Activities of Daily Living (ADL), whereas others simply predicted the next location a person would occupy. The use cases and keywords in Table 6 demonstrate this further.
Table 8 shows a comparison of the different algorithm’s prediction accuracies (%) for each of the datasets used, where the highest stated prediction accuracy for each dataset/algorithm combination is used for each table entry.
Accuracy expressed as a percentage of correct predictions (%) features most commonly in the results of this review. This is standard way of assessing the efficacy of classification tasks. However, prediction tasks with a continuous output tend to use Mean Absolute Error (MAE) and Root Mean Square Error (RMSE) which appears in a number of papers, and denotes the error distance from the regression line of best fit, where a low number equates to better accuracy.
Output type
The majority of the systems output a single value – the prediction. This could be: an action, a probability, a location, a health data value, an appliance or device usage. None of the systems detailed in the studies used more complex data structures, such as matrices, to output multiple data points (multiple time based predictions) at the same time.
Use cases stated
All of the uses cases stated, see Table 6, can be categorised as smart environments, with distinct sub-categories that focus on Activities of Daily Living (ADL) or Ambient Assistive Living (AAL).
Discussion
Results from this review are able to answer the research questions set out in the objectives in Section 1.2 – and detailed in the following sections.
What are the key datasets?
The majority of current research in this area focusses on the MavHome [19,31,51], MavLab [3,30], CASAS [13] [23,45,47,59], LIARA [11,34], and Placelab [15,32] datasets from MIT and Washington State University. Some novel datasets exist which report excellent results, as shown in Table 8, specifically the Shanghai smart home dataset and Neural Network combination which reported a perfect score [63].
As expected the input data from the datasets are a mix of types: sensors including motion sensors, actuators, and switches; appliances such as kettles and cookers; devices like thermostats; and more complex data input such as accelerometers, location data, and less commonly video.
The relatively low use of video is interesting given the advances in computer vision. The processing of video for behaviour prediction may have been too computationally expensive, something that has changed only very recently. Or there could be cultural and privacy concerns that make researchers believe it is unlikely that a video feed in every room of a home is ever likely to be accepted by the public, and therefore that research is not worth pursuing.
Furthermore, the complete absence of audio as an input method is also significant given the smart home industry’s focus on their commercial devices predominantly using audio as the user interface method (e.g. Amazon’s Alexa and Google Home). It could be that much of this research is private rather than public. Either way it appears that there is a significant research contribution to be made in this area.
Location data is featured in the input data types from wearable devices and also motion tracking sensors. Mobile phones would be an obvious choice for further research in tracking people around smart spaces, but this may fall into a category with video where there are privacy concerns for the user. All these input data types could be categorised as obtrusive (mobile phone data, live video, audio) and unobtrusive (appliance and device data, motion sensors, power usage), which should be given consideration when conducting research into this area.
The mean prediction accuracy for all results is 79.19%, which could be used as a broad benchmark for current smart home behaviour prediction research.
How is behaviour modelled?
Modelling behavioural data can be done with several different types of data structures of increasing complexity that accordingly can reflect different levels of complexity within the behaviours. In order of complexity we have seen in the literature:
Vectors: A simple sequential list of event identifiers, where the ascending list index represents the arrow of time.
Tables: Two dimensional data with rows and columns allowing for augmenting events with additional data including timestamps. Tables in an SQL database also allow for some relationships to be mapped.
Tree: Good for modelling both the arrow of time and causal relationships between events. Lends itself well to both statistical and machine learning methods for behaviour prediction.
Markov: Variants of graphs with the Markov property are excellent for modelling the state change nature of behaviour, and the relationships between states.
Graphs: The most dynamic and extensible of the modelling techniques. Graphs can be cyclic, have tree subsets, map relationships, hold data and functions on the edges and vertices, and lend themselves well to machine learning techniques.
Graphs are particularly apt for modelling sequences, and inferring which element in a sequence might be next. An example of how a graph or graph like data structure can be used for sequence prediction is detailed in Fig. 4. The vertices can be mapped to each known event in a specific use case, and directed graphs can model the arrow of time. Finally, the edges not only connect the vertices, or events, in a logical way but can also have probability values attached to them that can be dynamically updated. For example, when at point A probabilities for each edge route to points B, D, and E become available (summing to 1). How these probabilities are calculated is determined by the prediction algorithm, which is often a function of the state change from one event to another based on previously observed data for these states.
What are the algorithms used for behaviour prediction?
A visual breakdown of algorithms into categories is shown in Figure 3. The best results for prediction accuracy are being achieved with machine learning algorithms or Bayesian networks, with the highest accuracy recorded in the review papers using Hadoop to process massive datasets that are then used to train a back propagation neural network variant (BPNN). The amount of training data available often impacts prediction accuracy in machine learning models, so this will have been a factor in the results. The highest prediction accuracies are also currently achieved by predicting simple behaviours such as a person moving from one location to another [63], rather than complex multi-occupancy behaviours. The most common algorithms for predicting human behaviour are variations of well known machine learning algorithms (NN, RL, Q-Learning, RNN/LSTM), and variations of LeZi, CRAFFT, and SPEED. All of these algorithms take different approaches to solving a fundamental problem, which is sequence prediction. If we consider a sequence of events or actions, represented by the stochastic process

Sankey diagram of prediction algorithms in review papers.
PGMs combine two features which make them ideal for behaviour prediction. The graph data structure, which can easily be used to model actions and state changes, combined with probability calculations on the edges which can be used for prediction values [7,8]. Probability is particularly suited for a stochastic process like behaviour as it can account for spontaneity and randomness, it can have multiple possible options with various levels of confidence, and can also be calculated with contextual factors taken into account. Additionally, it can also be updated in real time as new data is observed, so models deployed to smart environments could update themselves to adapt to individual occupant’s behaviours. PGMs generally fall into two categories: Markov model variants, and Bayesian model variants.

Simple probabilistic graph example.
Variations of the Markov model, one of the most well known PGMs, feature heavily in the literature due to their suitability to both model behaviour as a graph, and also infer the next behaviour through the probability on each of the edges for transition to another state. Figure 4 demonstrates a very simple type of PGM. A Markov model is similar except that it has an additional loopback state where each state vertex has an edge that loops back on itself, representing a change (e.g. over time) but remaining in the same state value (behaviour). This is also known as a cyclic graph.
There are many different permutations of the Markov Model found in the literature as researchers try to modify the data structure slightly to better accommodate the nuances of modelling behaviour e.g. Hidden Markov Model (HMM) [58], Hierarchical Hidden Markov Model (HHMM) [1], Improved Hidden Markov Model (IHMM), Variable-Order Markov Model (VMM) [36], or Maximum Entropy Markov Model (MEMM) [26]. Markov Models (MM) are a good fit for when all of the state in a system is observable. When there is a non-observable state to account for Hidden Markov Models can better map these processes. Table 11 shows a matrix for selecting which type of Markov model to use, depending on the system state and autonomy.
Markov models
Markov models
Data extraction: algorithm accuracies update, 2022
Data extraction: use cases and keywords updated, 2022
Pros and cons of different modelling types
Updated review search, 2022
Data extraction: input data types update, 2022
Data extraction: data structures for modelling behaviour update, 2022
HHMMs have been found to be especially good for behaviour modelling as they allow activity recognition to start at a higher level, before transitioning down to a more granular level of the model to determine the activity occurring – like a tree data structure e.g. in a smart home a person is in the kitchen therefore connected activities are cooking or washing dishes.
There are several key algorithms that recur in the literature related to Markov models which are useful to understand for processing the state in a HMM. The Viterbi algorithm is used for the most likely sequence of hidden states. Baum-Welch is used for estimating the starting probabilities, and the Forward algorithm will calculate the probability of a state at any given time.
Markov variants are an excellent fit for the behaviour modelling and prediction problem, with good accuracy results for simple behaviours. The current research problem is how to adapt this data structure for more complex behaviour types without becoming computationally expensive.
Sequence prediction via enhanced episode discovery (SPEED) uses episodes of smart home events, that are extracted based on the binary state of home appliances (on/off) [22]. An episode is a sequence of user activities that regularly occur in a smart home. The episodes are transferred into a finite-order Markov model and processed with a prediction by partial matching (PPM) algorithm, to predict the next activity in the smart home, from the previous data. SPEED is different to the Markov variants discussed in that it combines episode discovery (ED) and PPM on a Markov model – which is used to model the behavioural sequence.
LeZi variants
The LeZi algorithm (notably Update LeZi [9], and Active LeZi [27,53]) is an incremental parsing algorithm for sequential prediction that is based on the LZ78 family of data compression algorithms [27]. The LZ77 and LZ78 data compression algorithms, created by Abraham Lempel and Jacob Ziv in 1977 and 1978 [65], break down sequences of symbols (e.g. text files) that repeat with regularity and replaces them with an index key – storing the repeat phrases as unique array values. This reduces a file to a vector of index keys and an array of unique strings or phrases. The LeZi prediction algorithms that build upon LZ78 parses events, actions, or experiences as symbols and stores them in the same way. Massively reducing the size of data any subsequent learning and prediction has to be applied to. Active LeZi (ALZ) also applies a sliding window, of the same size as the maximum phrase length, to further contain the data size. To predict the next event in a sequence the ALZ algorithm calculates the probability for each state occurring in the sequence, before predicting the value with the highest probability as the next most likely action. This is essentially a finite state Markov model that predicts the next symbol in a stochastic sequence, however it is different in that it uses the LZ compression method to manage the underlying data sequence in a highly optimal way.
Bayesian models
Bayesian networks are a type of Probabilistic Graphical Model (PGM) mentioned previously, similar to Fig. 4, that uses Bayesian inference for probability computations. PGMs provide a way to both effectively model behaviour and make inferences on future events within one data structure, and as such they are particularly apt for the behaviour prediction problem. Given a sequence of events where B is the most recent element in a time series set of events, what is the probability of A being the next event?
All of the Bayesian variants found in the literature, including Naive Bayes classifiers and the Dynamic Bayesian Network Artificial Neural Network (DBN-ANN) hybrid models which span Bayesian and ML methods, all derive their prediction capability from the Bayes theorem stated above, to determine the probability of an event occurring.
Bayesian variants, and specifically Dynamic Bayesian Networks (DBN), are all Directed Acyclic Graphs (DAG) which in contrast to Markov models, do not have a loopback state, and only transition from one state to another, as in Fig. 4. This allows a DBN or similar to incorporate the modelling of causality, where one distinct event clearly causes another.
CRAFFT
The CRAFFT algorithm is a Bayesian Network with some extra contextual features to improve activity prediction. CRAFFT, short for current activity and features to predict next features, utilises three features for each activity. These are:
State variable
Activity location feature
Activity time of day feature
Activity day of week feature
By providing temporal context to the existing state and location data, the accuracy of predictions can be improved. For example the ‘bathing’ activity in the morning is usually followed by the ‘personal hygiene’ activity. Whereas in the evening, it is usually followed by the ‘sleeping in bed’ activity label. Augmenting a Bayesian Network with extra contextual features enables it to more reliably calculate the probability of the next activity label.
Knowledge Graphs and Event Graphs
Knowledge Graphs (KG) and Event Knowledge Graphs (EKG) are a type of graph data structure also known as semantic networks. They are interlinked pieces of information that have connections or relationships denoted via the graph edges. The vertices can contain related data e.g. familial relationships or object genealogy, or more interestingly for human activity prediction, they can contain event labels. Having a prebuilt graph of related events and activities simplifies the process of applying algorithms to calculate the transition probability from one event or vertex the next. They also allow greater depth of causality than Markov Models which observe only the current state when calculating the most likely next state transition [26,40,60].
Machine Learning (ML)
Machine Learning (ML) algorithms produce some of the best results found in this review for sequence prediction. Neural Networks (BPNN, ANN) and hybrid Bayesian/Neural Networks (DBN-ANN), Recurrent Neural Networks (RNN) which are particularly adept at time-series prediction [39], Reinforcement Learning (Q-Learning) which rewards correct predictions, and finally Support Vector Machine (SVM) which uses regression. ML algorithms have found their way into every corner of computer science, particularly for classification and prediction (inference) problems. To better understand why they are good for human behaviour prediction, or sequence prediction, it is easier to discuss them as higher level categories: Regression, Neural Networks (NN), Reinforcement Learning (RL), Long-Short Term Memory (LSTM), and Gated Recurrent Unit (GRU).
Regression (SVM)
Regression, particularly linear regression like that found in classifiers such as an SVM, can be used for forecasting the next event in a sequence of known linear historical data and applying a best fit to determine the most probable class or category the next event. This is unlikely to scale well for data with many different behavioural events, or correctly predict outlying events in the data [29].
Neural Networks (NN)
Several NNs are mentioned in the literature, and they all operate in a similar way. The networks are trained on the time series data, and the resulting models output a prediction of the highest weight from the known classes when passed a value found in the historical sequence. The different networks are sensitive to many factors in training such as the amount and quality of the data used to train the model, any preprocessing or feature engineering performed on the data, the number of network layers, activation functions, regularisation, pooling, and normalisation to name a few. There are many permutations for NN based time series prediction that can all have an impact on the accuracy. However, given a large amount of good quality data they are highly effective at classifying the next likely event in a sequence.
Reinforcement Learning (RL)
Reinforcement Learning takes a different approach in that its training process involves learning from the time series data based on how a reward function is configured to optimise for correct predictions. An RL variant found in the literature, Q-Learning, is particularly adept at problems with stochastic transitions and therefore fits well with behaviour prediction when behaviour is modelled as a stochastic process.
Long Short Term Memory (LSTM)
Long Short Term Memory (LSTM) is a neural network that has both feedforward and feedback connections. They date back to 1997 and were invented to solve the vanishing gradient problem, but have only more recently become popular in research when applied to sequences of data. An LSTM is particularly adept at processing sequences of data rather than data with less than three dimensions, such as images. As such it is well suited to time series data, like observed human behaviour in a smart home, and produces comparable results to algorithms stated in Table 3 [37,44,56] [2,46]. The feature of LSTMs that make it especially good at behaviour prediction is the lower sensitivity to gaps between segments of data. Correctly segmenting data into activities is a major issue for behaviour prediction systems, and LSTMs are more tolerant to gaps between data segments, such as when there are lags of unknown duration between events in the time series data. Therefore they are better able to match activities in sequences and produce more accurate predictions as activities are not grouped incorrectly.
Gated Recurrent Unit (GRU)
The Gated Recurrent Unit (GRU) is a simplified version of an LSTM proposed in 2014 by Cho et al [16]. GRUs and LSTMs are very similar in the type of features that they can learn. GRUs have far fewer model parameters, and have even been shown to outperform LSTMs in some sequence prediction tasks [17]. GRUs can achieve the same efficiency, efficacy, and performance as LSTMs – and are often faster to train due to their lower complexity. However, when it is necessary to remember longer data sequences then LSTMs outperform GRUs.
Graph neural network (GNN)
Graph neural networks (GNN) are a set of deep learning methods that work in the graph domain. Graphs are an excellent data structure for modelling behaviour, and by processing data represented as a graph using a Neural Network it can be used for link prediction, or state transition, between graph vertices, which in the case of behavioural data is events or activities [40,60].
Statistical and trend analysis
Statistical and trend analysis are good methods for macro level behaviours over longer timeframes. They can calculate the likelihood that events might occur on monthly or annual time scales, rather than the highly focussed immediate activity predictions of ML or PGM algorithms. This type of analysis is often called forecasting, and could be used in smart environments in conjunction with other prediction methods, to take a longer term look into the likelihood of future events.
ARIMA
Autoregressive integrated moving average (ARIMA) is a time series analysis model, and a generalisation of the autoregressive moving average (ARMA) model. ARIMA can be fitted to time series data to predict, or forecast, future points in a series. As the AR indicates in the acronym, ARIMA is a type of regression that is suited to non-seasonal time series data. It is a linear regression model that uses its own lags (past values) as predictors. An ARIMA(p,d,q) model is characterised by three terms: p, d, q. Where:
p is the order of the AR (autoregressive) term
q is the order of the MA (moving average) term
d is the number of differencing required to make the time series stationary (non-stochastic)
ARIMA is suited to data that tends towards non-stationarity which makes it useful for simple behaviours rather than behavioural processes that display greater stochasticity.
SARIMA
Seasonal ARIMA combines the ARIMA method in the previous section with a seasonal component to factor in trending changes in a time series dataset. SARIMA(p,d,q)*(P,D,Q,s) follows a similar pattern to ARIMA with the addition of the capitalised parameters which indicate a seasonal version of those values e.g. p and seasonal P. Lastly, a forth value is included in the seasonal parameters: s, which indicates the seasonal length of the data.
Prophet
Prophet is a trend analysis and forecasting model developed by Facebook [57]. It uses modular regression to process exceptionally large datasets, and is useful if forecasting is needed for big data datasets, at scale, over monthly or yearly time periods. It includes seasonality and can be applied to different types of time-series data. While this is out of the scope of current smart environment behaviour prediction systems, this kind of processing and statistical forecasting at scale will be needed when these systems grow in complexity.
Other notable algorithms
There are other algorithms reported in the literature, that are either unique in their approach, or have been overtaken by developments in the three main categories outlined above.
Ruleset algorithms
The Apriori algorithm [30] is a ruleset that identifies the most frequently occurring activities in a time-series dataset as those most likely to occur next. Rulesets are not often used for behaviour prediction in recent years as more sophisticated techniques are available such as Markov, Bayesian, and Machine Learning methods.
Sequence pattern mining
Human Activity Prediction (HAP) models and indeed most time-series inference models are sequence prediction models – due to the sequential nature of time. Therefore time series datasets like we find in smart home environments are good candidates for sequence mining algorithms, sometimes also called sequence pattern mining, which find interesting frequent patterns within sequential sets of data – such as human activities – that can used to determine what the most frequently occurring activity is after the current identified sequence [12,36]. In this respect the mined data act like rulesets for determining the next activity prediction.
Decision trees
Regression tree classification [45] is found in the literature, which is a form of decision tree, and used for determining what the next probable action could be. Trees have been popular throughout computer science for a plethora of problems, however similar to the ruleset algorithm stated previously it has been overtaken by more apt methods such as the Hierarchical Hidden Markov Model.
Smart home inhabitant prediction
The Smart Home Inhabitant Prediction (SHIP) [19] algorithm matches the most recent sequence of events with historical data sequences. SHIP matches sequences with a length greater than 3, and returns matches based on the number of occurrences of the pattern in the history and length of the matched sequence. Predictions can be made by matching the next element in the matched sequences.
Grey model
The grey model (GM (1,1)) is a component of Grey System Theory (GST) which aims to manage the uncertainty of a system (hence, grey system) [31]. GM(1,1) is the core component of all grey prediction models that are effective at solving problems where the data is uncertain or incomplete. GM (1,1) works by applying several transformations to the data. First, by taking a vector of time series data as input and applying the Accumulated Generating Operation (AGO) to it, so that:
Becomes:
The GM(1,1) model is then constructed by establishing a first-order differential equation for
Where a and b denote the coefficient and grey input respectively. The least squared method is then used, thus:
And by applying inverse accumulated generation operation (IAGO). The prediction will be:
Where
Jaro-Winkler distance (JWD)
The Jaro-Winkler distance algorithm is used to optimise prediction algorithms by more accurately segmenting a data stream into activities. One of the issues with observing smart home activities is knowing how to split (segment) the activity data that is being observed into discrete activities that can then be classified and used for prediction. The JWD is a string metric to measure the edit distance between two sequences. The more similar two strings (sequences), the higher the Jaro-Winkler distance. This can then be used to match previously labelled activities (as string activity sequences) with ones found in the inbound data stream from the smart environment.
Levenshtein distance
Similar to JWD, Levenshtein distance [35] is a useful method to compare sequence similarity between predicted activities and actual activities. Levenshtein distance is defined as the number of operations required to transform one sequence into another. It produces a score from 0 to 1 where 1 is a complete match between the sequences. As such it can be used to quickly compare the accuracy of two sequences of behaviour when working on prediction systems research i.e. the actual behaviour sequence and the predicted one.
Other factors in algorithm accuracy
The quality and volume of available smart environment data has a big impact on accuracy scores; particularly for machine learning algorithms. The Shanghai smart home dataset which produced a perfect score for a very simple activity (using Hadoop and a BPNN) [63] focussed on utilising high volumes of training data. Therefore, availability of large amounts of high quality data should be considered when conducting research.
Algorithm commonalities
In discussing these algorithms it is obvious that there are commonalities. The key elements for a behaviour prediction algorithm are:
Model behaviour as a sequence of transitions (Markov models) Optimise for time space complexity (LeZi) Limit the scope of historical sequence data being observed so the processing does not become intractable (Markov models, LeZi, SPEED) Improve accuracy by observing large amounts of historical data (ML, BPNN) Use contextual features to improve accuracy (CRAFFT) Use sequence matching to better compare accuracy (Levenshtein distance) Use accurate segmentation of data into distinct activities or events (JWD) Improve tolerance of gaps in, or between, data segments and episodes (JWD, LSTM, GRU)
Scenarios for behaviour prediction
The majority of high level use cases for behaviour prediction in smart environments are for Ambient Assistive Living (AAL), a subfield of Ambient Intelligence (AmI) – a still theoretical advanced smart environment with seamlessly embedded artificial intelligence. However, we are seeing the beginnings of these advanced environments with the use of smart technology in homes and assistive living settings. Assistive living environments are usually healthcare facilities or care homes, and use cases focus on Activities of Daily Living (ADL) and how to predict these events so that they can be preempted, and therefore assisted.
Simple use cases from the literature are systems that know when certain appliances or devices are going to be used, and can activate them instead of the occupant having to frequently do so [42]. Location prediction also features for determining where an occupant might move next in a smart home – which produced the highest prediction accuracy of all the review papers seen [63]. More complex use cases focus on anomaly detection in predicted behaviour. If a pattern of behaviour deviates from the predicted pattern an alarm can be raised that something unusual might be happening [41]; which can be particularly useful when passively monitoring the elderly.
The current research understanding, knowledge, and technology for computational human behaviour prediction is still underdeveloped and the use cases found in the literature reflect that. Basic scenarios are used as a proof of concept while we unravel the structure of predicting patterns that can become almost infinitely complex. One of the most fundamental questions that these use cases should address is: Why is behaviour prediction important for smart environments? The answer to this is that predictive systems are an evolution from the reactive systems that our current technology is capable of. With predictive systems there is no need to wait for a command to be issued. Based on data already seen a system can make a decision for a person. This cognitive offloading then frees the occupant of a smart environment to focus on other tasks; whether highly important ones such as in healthcare and professional settings, or more leisure and entertainment focussed at home. We have seen similar cognitive offloading happen as a result of technological advances in the past with conventional home appliances, computers, and domestic white goods that free people to focus their energy and attention on less mundane tasks. Human behaviour prediction capabilities for smart devices will take care of tasks before they occur to us; control power usage, IoT devices, and entertainment; and eventually even control vehicles and macro scale smart city systems [20] [6,54,64].
The use cases found in the literature focus on domestic smart home settings, healthcare, and care homes. However, it is likely that this research could be applied to many different types of settings – from vehicles to smart cities – using the same theoretical knowledge of sequence prediction and pattern recognition. Future research could investigate more complex use cases such as multi-occupant behaviour prediction where behaviours overlap, massive scale behaviour prediction like that found in crowds at sporting events, or industrial and commercial use cases for improving safety. Examples of these can be found by looking at the Ambient Intelligence use cases in the report by the Information Society Technologies Advisory Group (ISTAG) from 2001 [21], which are still relevant today.
Further research
Several opportunities for further research have been identified by this systematic literature review. These include:
Using different types of data input, such as video and/or audio, which is surprisingly missing from any of the research Trying different combinations of the datasets, algorithms, and data structures identified in this review which could yield interesting results Investigating the efficacy of newer machine learning algorithms such as Graph Neural Networks. Developing the identified behaviour modelling techniques, with richer more dynamic data structures that could output probability distributions for a range of likely behaviours, rather than a single value – building on the work of Tax, 2018 [56]. Exploring further the use of context to improve activity prediction, as put forward in the CRAFFT algorithm.
Centres of research
Based on the number of papers per affiliation in the review data the centres of research for behaviour prediction computation are Washington State University, The University of Texas, and Nottingham Trent University. However, several of the datasets produced are from MIT, which may not have a focus on behaviour prediction, but does have a significant amount of research in smart environments. The top researcher in this field is Diane J. Cook of Washington State University with a significant amount of named author papers, and a high number of citations for those papers.
Conclusion
In conducting this review it was revealed that the state of the art is simplistic in terms of what is currently achievable with these predictions systems. None of the research deals with complex human interactions, how to make predictions when multiple people are overlapping their interactions, or how to dynamically identify a behaviour given different contexts and then make predictions – amongst many other challenges still to be resolved in this research area. There is good availability of datasets with which to conduct research, and many algorithms that yield promising results. There also appears to be little crossover with other fields, such as computer vision, that could potentially produce much better results [52]. The computational resources needed to parse large datasets and use machine learning algorithms are only recently becoming affordable, so this may explain the many gaps in the literature in this area. These gaps provide many opportunities for researchers to explore and contribute new knowledge; most notably using audio and/or video as the input data types, and investigating much more advanced sequence prediction methods such as LSTMs. In conclusion, we can reiterate what what we discovered in answering our research questions in Section 1.3.
Conflict of interest
None to report.