
Abstract
Sleep disorders are one of the causes that impair our quality of life, and adjustment of autonomic nervous activity can improve the sleep quality. The authors examined the effects on the sleep quality with adjustment of autonomic nervous activity by individually optimizing complex environment before sleep. Sixteen subjects underwent an environment optimization experiment during the day and subsequent sleep experiment (9 days/individual) and the ratio of low-frequency to high-frequency (LF/HF) components of heart rate variability was measured during the experiment. The LF/HF decreased under optimal conditions by 19% compared to the control conditions. Next, the effects of optimal conditions before sleep on the sleep quality were evaluated. Based on the index for the sleep quality (light sleep index), effect of the optimal environment conditions before sleep was not clearly observed for all subjects. Clustering analysis was evaluated to analyze the cause deeply. As a result, for the group of experiment subjects who did not feel nervous about the experiment, the light sleep index was decreased under optimal conditions by 29% compared to the control conditions. It was found that the effect on such stimuli could disappear in the subjects who were nervous about the experiment.
Keywords
Introduction
The World Health Organization emphasizes the importance of elongation of healthy life expectancy at birth and improving of quality of life (QOL). Sleep disorders are one of the causes that impair our overall health and QOL. Although various functional declines are observed with aging, autonomic nervous function declines especially after age 30 and the problem of night awakening tends to become apparent [9,17]. Sleep problems can be caused by various factors. It is known that there is a relationship between the autonomic nervous system (ANS) and sleep, and adjusting the ANS can improve sleep quality as well [19]. Moreover, previous studies have shown that the HF rate of heart rate variability tends to be higher as rapid eye movement (REM) sleep, light non-rapid eye movement (NREM) sleep, deep NREM sleep and deeper sleep depth [3]. In REM sleep, the brain is actively working, and memory is organized and fixed. It is called REM sleep because there is a rapid eye movement that causes the eyes to move vigorously during REM sleep. On the other hand, in non-REM sleep without REM, the cerebrum is considered to be resting and is important for recovery from fatigue of the brain and body. In previous research, single environmental factors such as music, lighting, aroma, air flow, and room temperature have shown effects on the parasympathetic nervous system (PNS) [4,5,11,14]. The PNS is a nervous system that functions actively at night and when relaxing. Parasympathetic functions include vasodilation, lowering blood pressure, lowering heart rate, relaxing muscles, and suppressing sweating. Regarding the effect of lighting on ANS activity, twenty subjects showed a tendency for the parasympathetic nervous activity (PNA) of ANS activity to increase and the time to fall asleep to became shorter under the lighting of the desired color [14]. Regarding the effect of music on ANS activity by listening to high-resolution sound sources containing high-frequency components such as natural sounds for twenty-nine subjects, PNA was enhanced, and physiological and psychological relaxation effects were achieved [11]. With regard to the effect of aroma on ANS activity, it was reported that the aroma of lavender tends to increase PNA in ten subjects [4]. Moreover, the research for parameters to build a comfort space model with airflow and room temperature was conducted [5]. However, these previous studies only evaluated the effect of a single environmental factor corresponding to five senses on ANS and few studies have been reported on the effects of the five senses stimuli by multiple environmental factors on ANS activity and the effects on sleep. From the previous studies, it is difficult to achieve a comfortable environment based on a single environmental factor. For example, even if the temperature and humidity are comfortable, a sleep environment cannot be said to be comfortable when the lighting is on. In addition, for people with visual, auditory or olfactory disabilities, it is more necessary to customize a complex environment with multiple environmental factors, not a single environmental factor, rather than for healthy user. On the other hand, it takes time to optimize the complex environment for each individual. We developed a unique three-step method to optimize multiple environmental factors such as air, lighting, aroma, and music for each individual in a short time, and we evaluated the effectiveness of the method. As the next step, we investigated the effect of the environment on sleep. The environment before sleeping is important and can negatively affect sleep quality under light sources of higher color temperatures [12]. In other words, the environment before sleeping can be expected to improve sleep quality. However, there have been few reports on the relationship between presleep autonomic state and sleep quality as modulated by the environment. Therefore, we tested the effect of autonomic state adjusted by a combination of environmental factors before sleep on the quality of sleep at night.
Additional remarkable point of this report is a long-term experiment to investigate ANS activities throughout the day and night under controlled environments. Easy sensors to wear for monitoring ANS activities have been developed these ten years. However, the reported investigations were limited in a few hours or one day [6,18] and few studies on ANS activities throughout the day and night under controlled environments have been reported because it takes time and huge efforts for the experiments. In this report, we investigated ANS activity under controlled environments for nine days and statically analyzed based on each subjects’ daily cycles of ANS activities. The subjects were classified based on the characteristics of the autonomic nervous system activity. As a result, a group of subjects who did not feel strongly nervous was extracted, and the effect of environmental control before sleep of the group on sleep was verified.
In this paper, we examined the effects on the sleep quality with adjustment of autonomic nervous activity by individually optimizing complex environment before sleep. Developed proprietary method for optimizing the multiple environment factors such as air, lighting, aroma and music for each individual in a short period was described in Section 2. In Section 3, results and discussion were reported, which include evaluated result of the effect of the optimized environment factors to the autonomic nervous activity. We also reported, the effects on the quality of sleep by adjusting autonomic nervous activity through a control of the environment before sleep were evaluated. In order to carry out deep analysis, statistical analysis was performed and evaluated the effect on the quality of sleep in each clustering groups.
Methods
Subjects
A total of 16 subjects aged 32–69 years (mean age ± SD: 50.3 ± 11.6 years old) consisted of 8 males (51.1 ± 12.4 years old) and 8 females (49.4 ± 11.5 years old) participated in this study as volunteers. Exclusion criteria included cardiovascular diseases, arrhythmia, psychiatric disorders such as addiction, depression, schizophrenia, bipolar disorder and so on, sleep disorders, pregnancy, and taking any medications concurrently with the study. We have conducted a large-scale experiment in an apartment that brought the equipment to each of the rooms and measured vital data for 9 days per person as described below. Four rooms with the same type were prepared for uniformity of the experiment. Moreover, the experimental period was limited to eliminate changes of seasons. From the result, the number of subjects was set to 16, and the total period was 36 days (4 groups × 9 days). Drinking alcohol, smoking, going out except for eating purposes, excessive exercise, and eating or drinking anything other than water for one hour before the start of each experiment were prohibited during the experiment. This experiment was carried out after ethical approval by the Research Institute of Human Engineering for Quality Life. All participants gave informed written consent prior to enrolling in the study and were paid for their participation.
Experimental conditions
The experiment was implemented from February to March 2020 in Tokyo City, Japan. All experiments were performed in an apartment with an area of about 30 m2, including living room, dining room, and bedroom. In addition, each room was equipped with ceiling lights, wall lights, aroma diffuser, music speakers, and electric fans to regulate the environmental conditions. The ceiling light conditions we determined showed little difference among people in a previous study, with the color temperature to activate the ANS determined as 2700 K and the light intensity of the facial region was 100 lx initial, and linearly reduced to 55 lx (−45%) over 60 minutes. The wall light was set up on the wall 2 meters away from the eyes of the participants. For the ranges of the chromaticity of the wall light, the lighting device is changeable from 0.150–0.629 for CIEx and 0.100–0.698 for CIEy. As a result, the wall light has 8 colors: red, orange, yellow, pink, green, blue, violet, and light blue. The color of the wall light was determined by interview on the first day as explained in 2.4 Procedure below. Shade curtains were installed to avoid the influence of sunlight. The air flow speed fluctuated from 0 to 0.7 m/s using an electric fan. We prepared four types of music which were thought to be relaxing, including jazz piano music, orchestral music, piano music, and natural sounds [13]. Noise level except music was less than 50 dB. The aroma used was a natural essential oil (S06, AT-AROMA Co., Ltd.) in an essential oil diffuser. The temperature in the room was in the range of 20°C to 27°C, controlled by an air-conditioner. The temperature range was set as a range that is ethically appropriate for physical health. If the temperature exceeded the set range, the test was stopped. The temperature in the room and whether aroma was used for optimal conditions were determined based on responses of autonomic nervous activity during the experiments on days 2 and 3 as described in Section 2.4.
For the control conditions, the light intensity, the color temperature of the ceiling light and temperature were set to 150 lx, 5000 K and 20°C, respectively. The stimulation of music, aroma, wall light, and air flow were not used for the control conditions. The environment during sleep was controlled to 16°C and dark conditions without any light, sound, or aroma. The temperature in the control experiment was set from the point of outdoor temperature during the experiment and controllability. The average daily temperature from February to March was around 10°C in Tokyo. However, it was difficult to keep the temperature with using an air conditioner during the whole experiment because it was too low. We evaluated the lowest temperature to keep the temperature, and we confirmed that it was 20°C (daytime) and set the temperature in the control experiment. Similarly, the environmental temperature (16°C) of the experiment during sleep was set from the lowest possible temperature (16°C) of the air conditioner used this time, as a temperature condition that does not cause discomfort due to the cold in a bedroom covered with a futon.
Physiological and psychological measurements
Heart rate variability (HRV) analysis is a non-invasive method for evaluating autonomic nervous system activity. It has the advantage of being less burdensome on the subject and makes it possible to evaluate autonomic nervous system activity such as sympathetic and parasympathetic nervous system activity from heart rate variability. In this study, HRV was measured by electrocardiogram (ECG). Heart rate variability analysis is a simple and non-invasive method for evaluating autonomic nerve activity. There are fluctuations in the fluctuation of the heartbeat, and when this fluctuation is analyzed by frequency, a peak is seen at a certain frequency. In the case of humans, a high-frequency component (0.15 Hz to 0.40 Hz: HF) that indicates fluctuations in the respiratory cycle and a low-frequency component (0.04 Hz to 0.15 Hz: LF) that reflects blood pressure fluctuations appear, both of which are autonomous nerve activities. HF is innervated by parasympathetic nerves, and LF is said to be innervated by both sympathetic and parasympathetic nerves [26]. In order to evaluate HRV, R-R intervals at a rate of 1000 Hz were recorded using two heart rate interval monitors (myBeat WHS-1, Union Tool Co., Tokyo, Japan and Silmee Bar type Lite. TDK Co., Tokyo, Japan) during all of the experimental period. These ECG monitors are wire-free, and have built-in circuits and batteries, and two electrodes are installed on the back side of the main body. The electrodes were both gel-pad type (Blue sensor, Union Tool Co., Tokyo, Japan and Gel-pad, TDK Co., Tokyo, Japan) The size of myBeat is 40.8 × 37.0 mm × 8.9 mm and the body is 13 g in weight. Silmee Bar type Lite is 64.0 mm × 28.0 mm × 9.6 mm and 14 g in weight. myBeat was attached to each participant’s left side of chest and Silmee Bar type Lite was attached to the center of chest using conductive adhesive tape. Frequency analysis of the HRV data from myBeat was analyzed with software (Advance Viewer Software, WINFrontier Co., Ltd, Tokyo, Japan) and used to calculate the autonomic nervous activity. Frequency analysis of the HRV data from Silmee Bar type Lite was also performed to calculate the autonomic nervous system index with software (Small System Application, TDK Co., Ltd, Tokyo, Japan), which has advanced noise removal processing because the main target of the sensor is sleep monitoring which needs strict noise removal [23]. Therefore, the data from the myBeat was analyzed for detailed autonomic nervous activity during the experimental period and the data from the Silmee Bar type Lite was analyzed for trends in autonomic nervous activity throughout the day. These analyses were performed using 0.04 Hz–0.15 Hz as the low frequency component of the autonomic nervous system index (LF) and 0.15 Hz–0.40 Hz as the high frequency component of the autonomic nervous system index (HF). The ratio of the calculated component at LF to that at HF (LF/HF) was used for estimation of the balance of autonomic nervous system activity [26]. The total power (TP) was calculated by the sum of the components at LF and HF, which reflects the level of autonomic nervous system activity. The LF/HF and the TP were calculated every one minute with the R-R intervals for 60 seconds and they were averaged. In order to evaluate the effects on sleep, we measured and computed the LF/HF during sleep which was reported as strongly correlated with sleep depth [24,25]. An expert with a Doctor of Engineering who has more than five years of research on heart rate variability and is accustomed to handling wearable devices responded to the experiment. Actigraph (Motion logger Micro Watch System, Ambulatory Monitoring Inc., New York, U.S.A.), a motion sensor to evaluate efficiency of sleep, was wrapped around the wrist during sleep. Actigraph is a method of measuring the amount of activity of a subject every unit time, and it is non-invasive and can be continuously measured for a long period of time. In addition, its weight is very light and it can be easily worn with a wristwatch, so it is considered to be an effective method for observing the general tendency of this sleep/wake rhythm. In this study, sleep efficiency was evaluated with Actigraph. The sleep polygram (PSG) is known as a standard method for evaluating sleep. This method simultaneously records brain waves, eye movements, surface myocardiogram (Otogai muscle), electrocardiogram, respiratory curve, etc., and comprehensively determines the sleep cycle and sleep depth. However, in actual measurement, it is necessary to wear a large number of electrodes, and it is difficult to say that the subject’s natural sleep is measured due to the discomfort and difficulty of sleeping, and the burden on the subject is heavy. In addition, PSG analysis requires expensive equipment, and analysis requires specialized knowledge. Since the measuring device is also lighter, Actigraph is easy to incorporate in normal life, can be measured for a long period of time, and is suitable for measuring a large number of cases. It has been pointed out that sleep time is underestimated in young people with a lot of physical activity and overestimated in later age groups, but it shows a correlation of 90% or more with PSG [21], and its validity is confirmed.
In order to investigate participants’ subjective feelings, a circumplex model was used, which represents the set of mutual relations by placing feeling-related concepts in a circular order in a space formed by two bipolar dimensions: pleasure-displeasure and arousal-sleepiness [10]. Emotional reactions such as emotions are expressed by external stimuli associated with sight, smell, hearing, etc., and the emotions are transmitted to the autonomic nervous system through the limbic system of the brain. Therefore, the emotions associated with the emotional response are expressed as heart rate variability. The subjects were asked to answer the circumplex model one hour before each investigation started in the normal room environment to investigate normal participants’ subjective feelings. This model is a scale developed based on the two-dimensional model of psychological state proposed by Russell, and is on a two-dimensional graph consisting of two axes of comfort (pleasant-discomfort) and arousal (excitement-calm). It is characterized by being able to show the psychological state. In addition, it is easy for the subject to understand the results obtained and it can be completed in about 1 minute, and the burden on the subject is small and it is convenient [22].
Procedure
We determined the optimal environment conditions to suit the senses of each subject uniquely with a combination of temperature, brightness, etc. by asking about personal preferences and through simple tests of subconscious feelings as described below. The stimulus set in this study was a factor of six environmental conditions (Ceiling lighting, wall lighting, airflow, music, aroma, temperature).
Classification method to optimize environment factors.
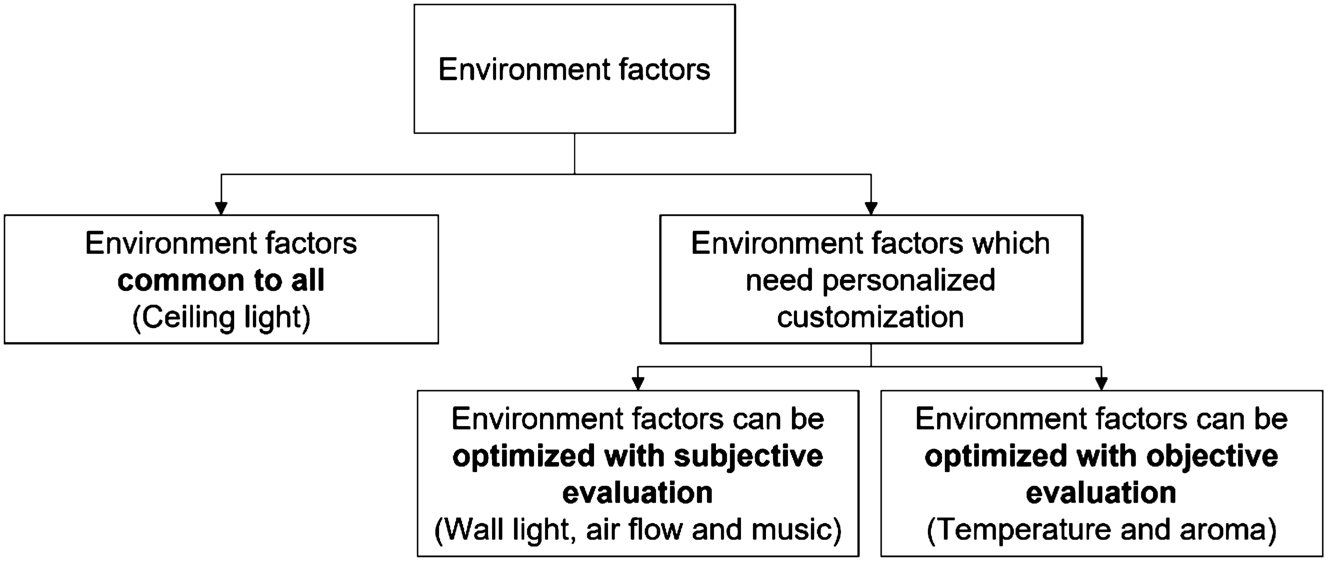
The environment factors were classified into three groups from preliminary experiments and applied three-step optimizing method for the environment conditions as shown in Fig. 1. First, the optimal environment factors can be classified two groups which were factors common to all persons and factors which need personalized customization. Second, the factors which need personalized customization can be classified two groups which were factors that can be optimized with subjective evaluation and factors that can be optimized only with objective evaluation. That is, it can be classified the environment factors into three groups; the factors common to all, the factors that can be optimized with subjective evaluation and the factors that can be optimized with objective evaluation. In this study, we applied three-step optimization for the environment condition. As a first step of the three-step optimization, the factors common to all were applied. And as a second step, the factors optimized with subjective evaluation with questionnaire. At a third step, the factors optimized with objective evaluation. In this study, we evaluated LF/HF as the objective evaluation and applied the environment condition with the lowest LF/HF. The three-step optimization can be reduced time and burden drastically to optimize the several environment conditions. When six factors of the environment conditions six environmental conditions (Ceiling lighting, wall lighting, airflow, music, aroma, temperature) are optimized, it takes eighteen hours (six factors × three environment conditions × one hour/condition) to optimize all conditions. The reason for the change of one factor per hour is to clarify the effect of each factor on the subjective and objective indicators of the participants. Moreover, if we consider the interaction among each factors, it takes 729(
The ceiling light was categorized to the factors common to all and the condition was as the same condition to all subjects [18]. The detail condition was explained in Section 2.2.
The wall light, air flow and music were categorized to the factors that can be optimized with subjective evaluation. Their condition was determined as descried follows. On the first day of the experiment, the subjects were instructed about the test in detail and interviewed about their preferences for the color of the wall light and the music for relaxing. After listening to each piece of music and showing samples of the color of the wall light, they were asked “Which music and color make you feel most relaxed?” by the experimenters and the wall light color and music type and volume conditions were determined. For the air flow, participants exposed themselves to the air flow for 60 minutes. After the test, they were asked whether or not they appreciated it. The air flow was applied to only for participants who appreciated it.
The temperature and aroma were categorized to the factors that can be optimized with objective evaluation. Their condition was determined as descried follows. The first day was mainly aimed to make participants accustomed to the experiment and lifestyle in the apartment and above procedure was carried out in the first day.
The temperature and aroma were categorized to the factors that can be optimized with objective evaluation. Their condition was determined as descried follows. For the air flow, participants exposed themselves to the air flow for 60 minutes. After the test, they were asked whether or not they appreciated it. The first day was mainly aimed to make participants accustomed to the experiment and lifestyle in the apartment.
The experiment was performed starting at 11 am, 2 pm, 5 pm, and 10 pm; four times each day on days 2 and 3, for 1 hour each time. Participants sat on a reclining chair 15 minutes before the experiment. HRV measurement was carried out for 60 minutes. They were allowed to read books prepared in advance but were prohibited from napping during the experimental time. Temperature and aroma were optimized in day 2 and 3. Three conditions of the temperature and two conditions of the aroma (with and without) were set and six experiments (three temperatures × two aroma) were performed in total. The result was compared with two control conditions and determined the optimized environment condition. This determined the optimal environmental conditions at which the average of LF/HF in 60 minutes was lowest for each subject. Optimizing environment condition and adaptation to the experiment was implemented by the third day. It is considered that adaptation for three days is sufficient for this experiment from reports by Agnew et al. and Lester et al. [1,15,16].
From day 4 to day 9 of the experiment, the control conditions, and the optimal environmental conditions were assessed for the original experiment. The experimental schedule is shown in Fig. 2. The experiment was performed at 11 am, 2 pm, and 10 pm; three times each day, for 1 hour each time.

Schedule of devices set up for physiological measurement from day 4 to day 9. (A) MyBeat was used during experimental and sleeping periods, while (B) Silmee was used throughout the day other than from 5 pm to 10 pm for HRV recording. (C) Actigraph was used only during the sleeping period.
During the whole experimental period, participants were allowed to eat out, watch TV, take baths, and do laundry in their free time except for the experiment times. They were asked to go to bed at 11 pm and wake up at 7 am. They were instructed to stay in bed until 7 am even if they woke up before 7 am.
In this experiment, since we are measuring corresponding data from the same examinee, a paired t-test is performed [3]. The advantage of this method is that it allows comparison and testing by taking intra-subject factors into account. Data is expressed as the mean ± 1 standard deviation (SD). The significance level was set at
Clustering analysis is a method of grouping data based on the similarity of data, and a general and representative K-means method was used in this study. The K-means method sets the number of clusters (= k) in advance and divides it into k clusters [8]. The reason why 6 groups were specified as clusters is provided below: We first conducted this analysis by classifying the participants into 4 to 8 groups. It turned out that uniformity (consistency) among each group was low with 4 or 5 groups, while the number of participants was too small with 7 or 8 groups. We therefore decided to use 6 groups in this study. At that time, clustering is performed by obtaining a cluster center such that the total sum of distances from each data point and the cluster center closest to each data point is minimized. Clustered information other than the minimum value was rejected The purpose of clustering this time is to confirm whether there is a similarity in daytime activities from the autonomic nervous activity data of the subjects in daytime life or during sleep. As input, the data of LF/HF and TP averaged every 15 minutes from 11 pm to 4 pm of each subject was standardized so the total average was 0.0 and the total deviation was 1.0.
Decision Tree analysis is a classification method that divides a sample based on if-then rules. This method is often used to understand how the sample was divided because of the branching method of the sample [2]. The purpose of the Decision Tree Analysis is to investigate which time segment of the LF/HF or TP was a factor in classification when the clustering analysis was performed with classification model in this study. By preparing explanatory variables and objective variables as a data set for performing decision tree analysis, a model for classifying samples based on the values of the objective variables for the explanatory variables is constructed. In this case, the explanatory variable is the same data as used in Clustering Analysis, and the objective variable is the cluster number calculated by Clustering Analysis. In particular, eight control values of room temperature, ceiling lighting illuminance, ceiling lighting color temperature, wall lighting color, music type, music volume, aroma type, and air flow, which are the control items in the experiment, are used as explanatory variables. The music type, aroma type, and wall lighting color have no relation to the strength of the numerical values, so they are converted to 0/1 categorical variables and analyzed.
Results and discussion
LF/HFs and HFs in the control environment conditions and optimal environment conditions is shown in Fig. 3. The data from the experiments in the morning, afternoon, and night for all the subjects were included. The average of LF/HFs was calculated from ten to thirty minutes in the experiment time so as not to be influenced conditions before and after the experiment. Thus, the LF/HFs could be changed by activity or circumstance of the subjects before the evaluation, and it takes less than ten minutes to a resting state and stabilize the LF/HF. Therefore, the first ten minutes was eliminated from the LF/HF analysis. The reason that the last thirty minutes was eliminated was to avoid anticipation of the subjects. The subjects were known the time to end the evaluation because of the ethical issue and they tended to anticipate finishing the evaluation at the end of the evaluation and it affects to the LF/HF. The LF/HF under the optimizing environment conditions was 3.25 ± 1.51 and that under the control environment conditions was 4.00 ± 2.01. LF/HF decreased by 19 % under the optimal environment conditions. The paired t-test results confirmed that the LF/HF under optimal conditions was significantly improved in comparison to the control (
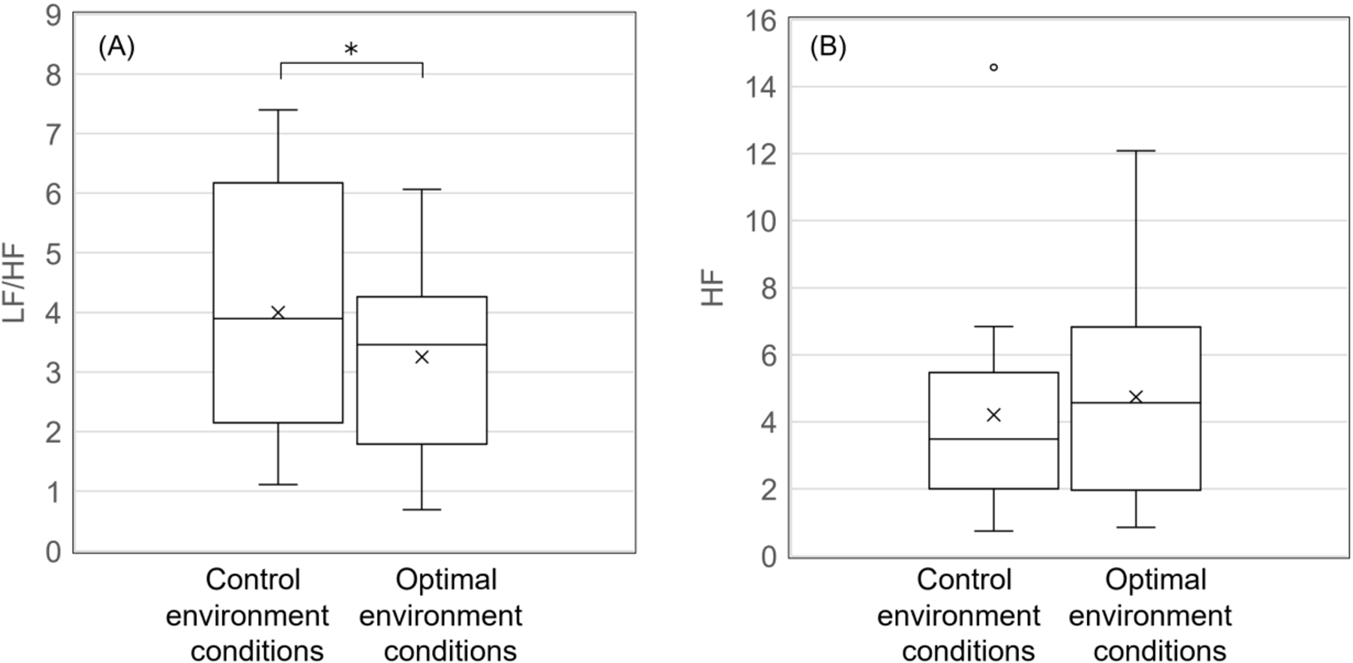
(A) LF/HF and (B) HF under the control environment conditions and the optimal environment conditions.
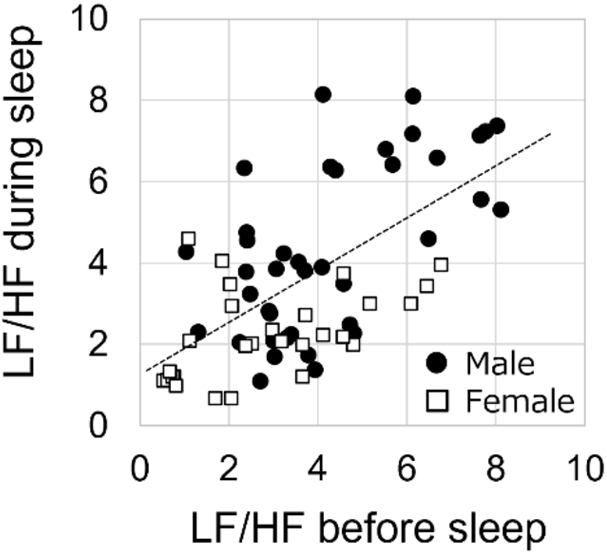
Correlation between LF/HF before sleeping and LF/HF during sleep.
As the next step, in order to evaluate the effects on sleep quality of decreasing LF/HF before sleeping, the correlation between LF/HFs before sleeping and during sleep is shown in Fig. 4. LF/HF before sleeping means the twenty-minute average of LF/HFs between ten and thirty minutes in the night experiment (10:10 pm to 10:30 pm). LF/HFs during sleep were the average of LF/HF over the whole sleep period (11 pm to 7 am) which shows correlation with sleep depth and can be used as an indicator of the sleep depth. Tanida and Suzuki et al. investigated the relationship between sleep stages and autonomic nervous activity [13,24,25]. According to a report studying the relationship between the sleep stage and the power value of heart rate variability, the power value of HF is the maximum during the stage 2 of NREM sleep, and the power value of all bands is the minimum during the slow wave sleep period [28]. Moreover, Tanida investigated the sleep stages with Polysomnogram (PSG) and autonomic nervous activity including LF, HF, LF/HF and so on with Holter ECG sensor at the same time to compare the correlation between the sleep stages and autonomic nervous activity. It was also reported the LF/HF strongly correlated with sleep depth, and the ranges of the LF/HF for each sleep stages; REM sleep is from 2.0 to 4.0, NREM light sleep is from 1.5 to 2.0, NREM deep sleep is from 1.0 to 1.5. Dashed line in Fig. 4 shows approximate line for all subjects. The correlation coefficient between LF/HF before sleeping and LF/HF during the whole sleep period was 0.62 (
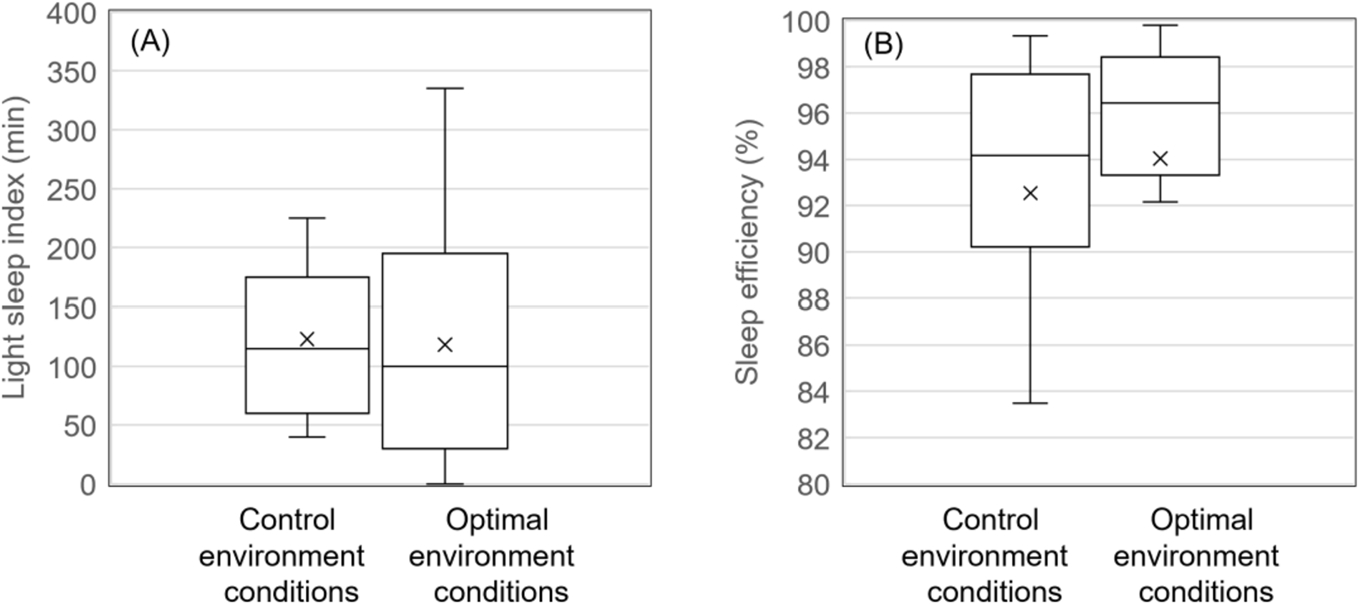
(A) Light sleep index under the control environment conditions and the optimal environment conditions and (B) sleep efficiency evaluated under the control environment conditions and the optimal environment conditions.
The effects on sleep of the optimal environment conditions before sleeping was evaluated. Figure 5 shows total time that the LF/HF was above four during sleep, evaluated with myBeat and sleep efficiency evaluated with Actigraph under the control environment conditions and optimal environment conditions. LF/HF above four during sleep indicates light sleep [25] and we adopt the total time that the LF/HF was above four during sleep as the light sleep index in this study. The light sleep index in the optimal environment was 118 ± 102 min and that in the control environment was 123 ± 64 min. The paired t-test results did not show a significant difference (
Clustering analysis with the LF/HF and TP was performed to discuss the details. LF/HF and TP from days 1 through 9 were averaged for every time period except between 4 pm and 11 pm, as the Silmee Bar type Lite sensors were removed to be charged during this time. In this clustering analysis, we considered each subjects’ autonomic nervous activity should include the period that they felt nervous on the first day because the data also reflects their characteristics. From the result, we applied the data from day 1 to day 9 for the clustering analysis. Figure 6 shows the normalized LF/HF and normalized TP in every time period for each clustered groups. Table 1 shows the summary of featured averages of LF/HF and TP shown in Fig. 6 for each clustered groups and bold value shows the characteristics value of each clustered groups. 11 pm to 7 am was the sleep period and from 7 am to 4 pm was the activity time, including the experimental periods. Although groups A, B, D, and F show low LF/HF during sleep time and high LF/HF during activity time, group C and E do not show a difference in LF/HF between sleep and activity times. Group A shows high TP throughout the day. The peaks of TP at around 7 am and 5:30 pm are thought to arise from walking to another location for meals. We found that each subject was divided into adequate groups because each group shows a similar trend in LF/HF and TP.
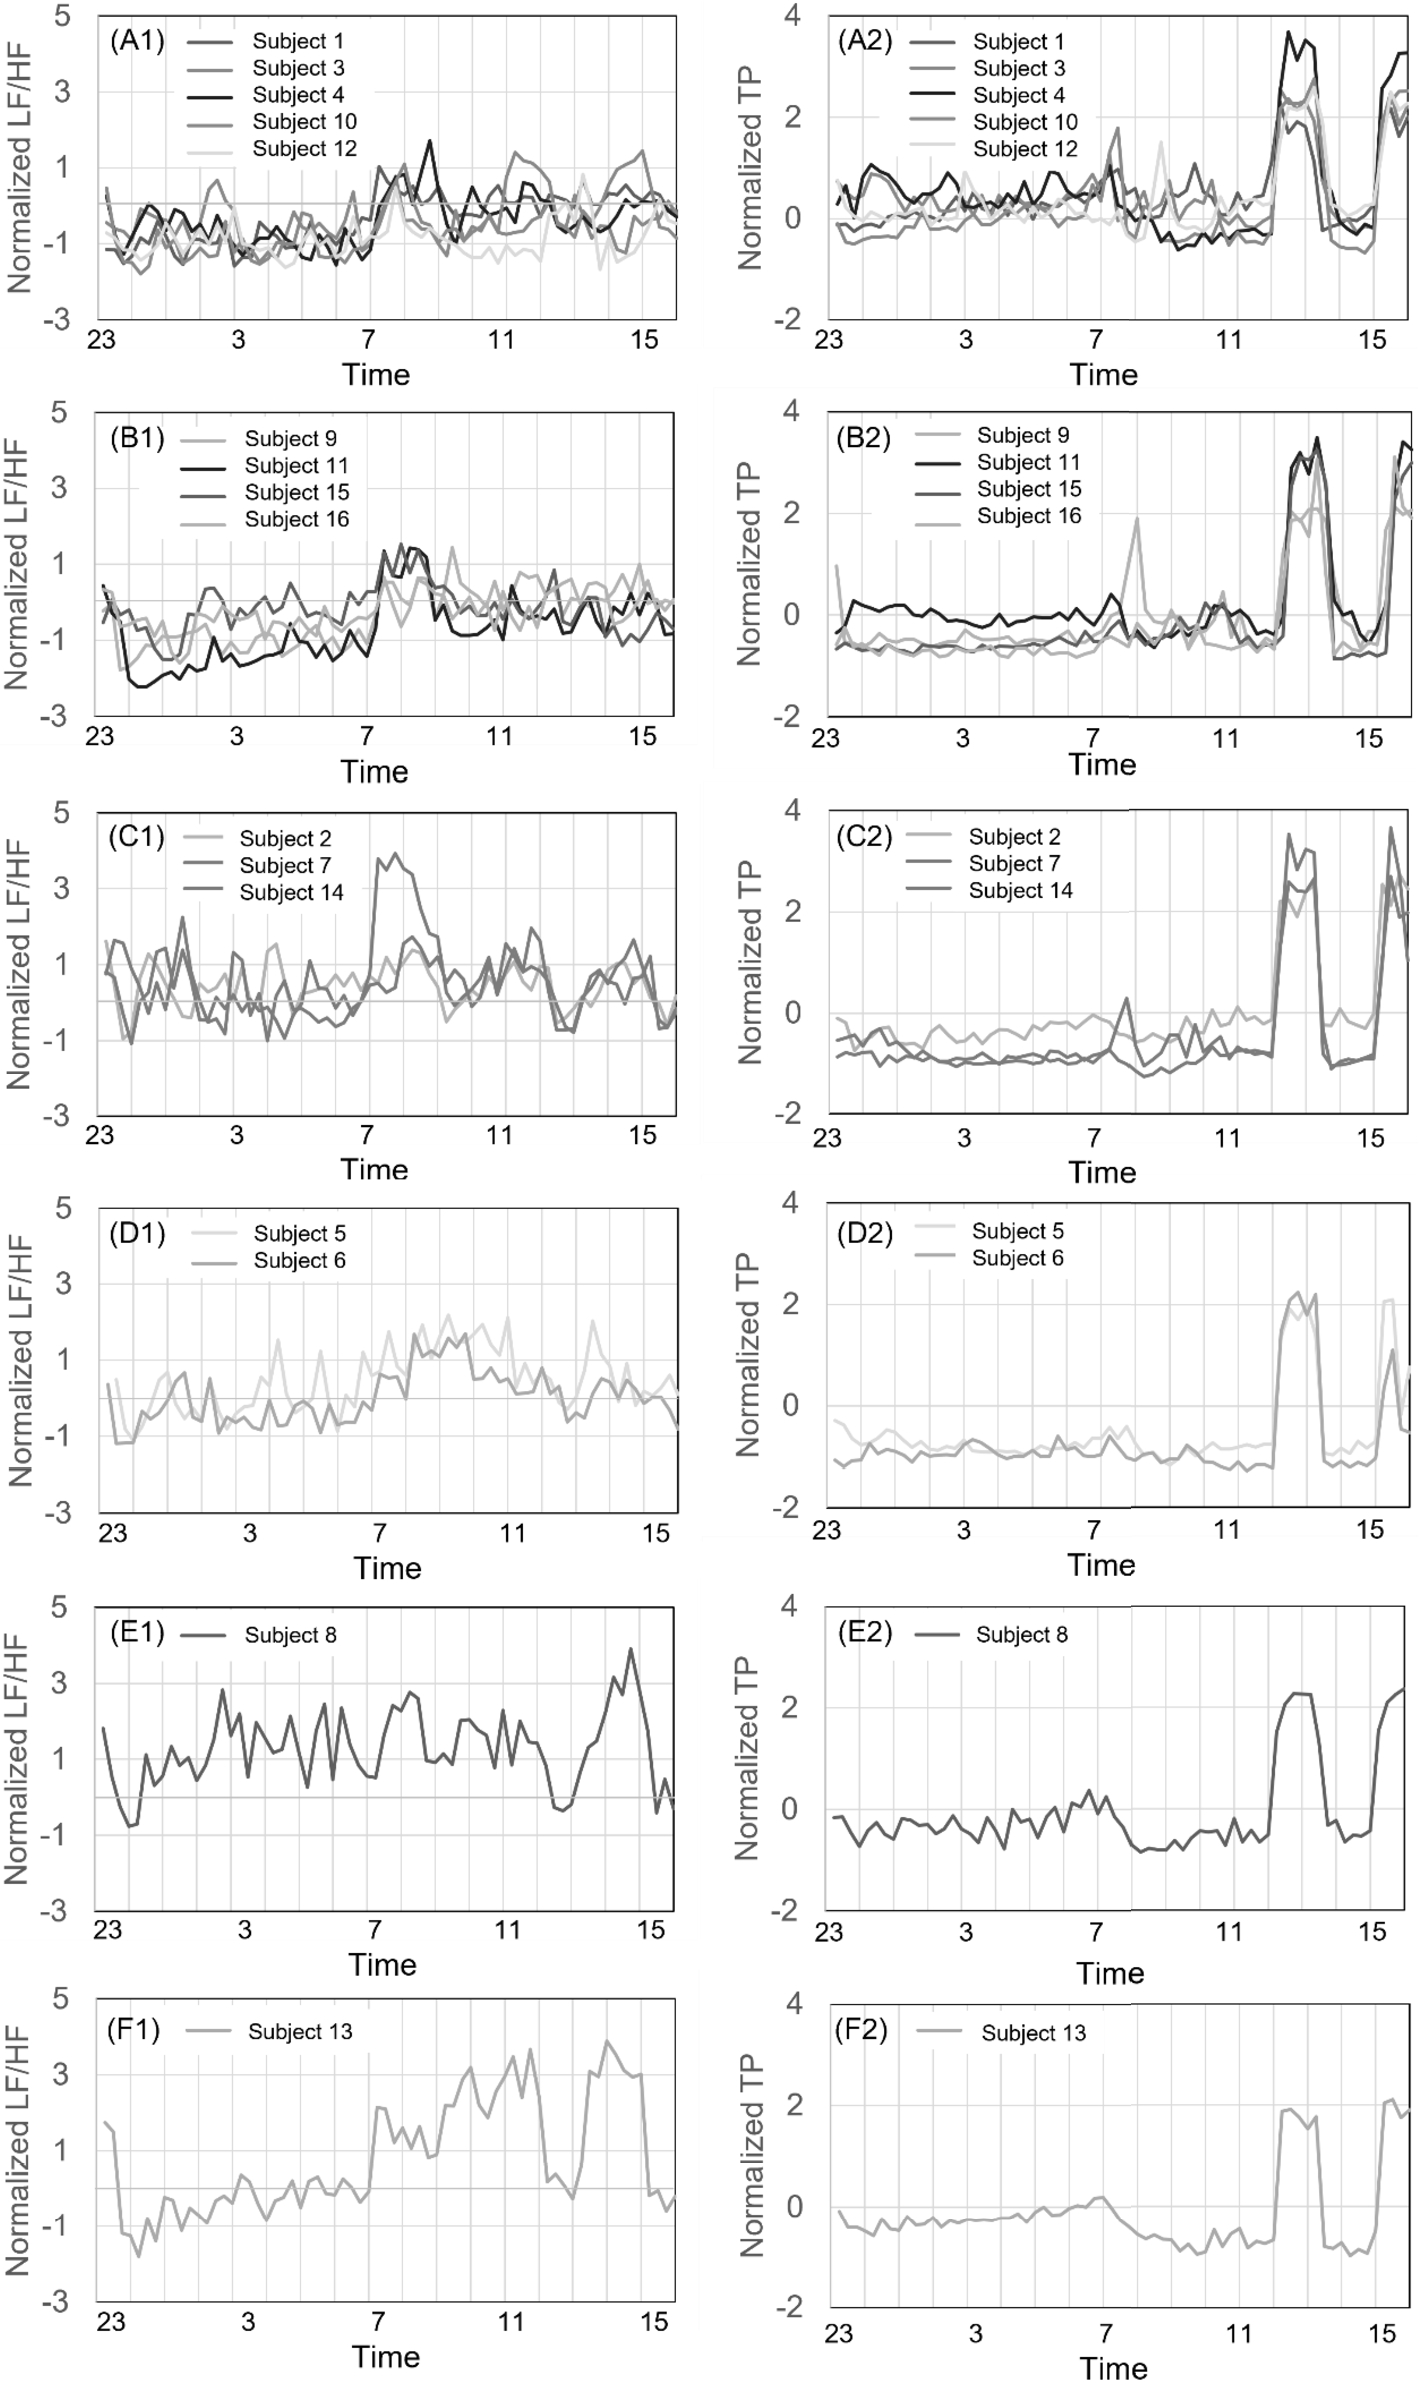
LF/HF and TP in each time period of each clustered group: A (A1 & A2), B (B1 & B2), C (C1 & C2), D (D1 & D2), E (E1 & E2), F (F1 & F2).
Summary of averages of LF/HF and TP for each clustered groups and
In order to analyze characteristics of each groups, decision tree analysis was performed. Figure 7 shows the result of decision tree analysis where branch nodes indicate criteria for judgement to classify into groups. Group A was classified by whether the normalized TP during sleep was higher than −0.18 as shown at Node 1, which means that Group A members seem to be low fatigue during the experiment [27]. Group B was classified by whether the normalized LF/HF during sleep was lower than −0.61 as shown at Node 2, which means that Group B members seem to feel low stress at night during the experiment [20]. Groups C and E were classified by whether the normalized LF/HF at 3:30 pm and 12:45 am were lower than −0.59 and −0.22. An important point was that the LF/HF of Group C and E members decreased drastically only in these times although their LF/HF was relatively high through the day as shown in Fig. 6 (C1) and (E1). Group C and E members tended to show high LF/HF through one day, especially during sleep, and little difference in LF/HF between sleep and activity time. However, the LF/HF decreased only from at 3:30 pm and 12:45 am, which were immediately after experimental times. Moreover, they also tended to start showing an increase of LF/HF at 1 pm, one hour before the experimental time. These results led to the speculation that Groups C and E members felt strongly nervous about the experiment and thus were preparing themselves mentally in advance. From the result, they tended to see an increase in LF/HF before the experiment and a decrease in LF/HF just after the experiment because they were free from their nervousness. On the other hand, Group D was classified by whether the normalized LF/HF in the morning was higher than 1.00 as shown at Node 4, which means that Group D members seem to have high activity in the morning.
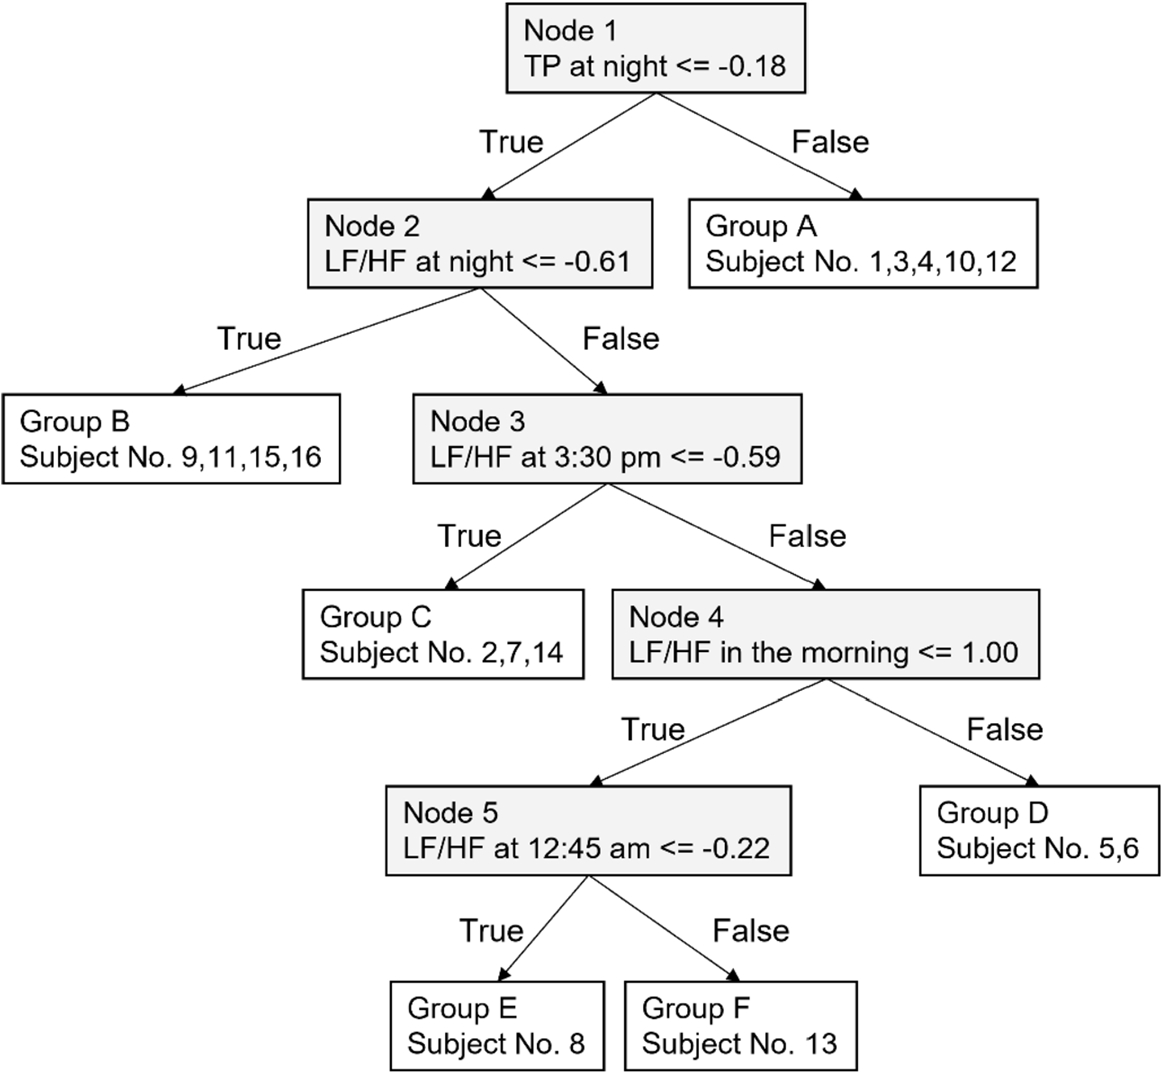
Decision tree analysis.
In order to analyze normal subjective feelings of each group, the subjects were asked to answer the circumplex model one hour before each investigation started in the normal room environment. Figure 8 shows subjective feelings of sleepiness-arousal and pleasure-displeasure for Groups A, B, D and F members and Groups C and E members who felt strongly nervous about the experiment. The average of sleepiness-arousal point for Groups A, B, D and F shows −0.7 and that for Groups C and E shows 3.9. It shows a significant difference (
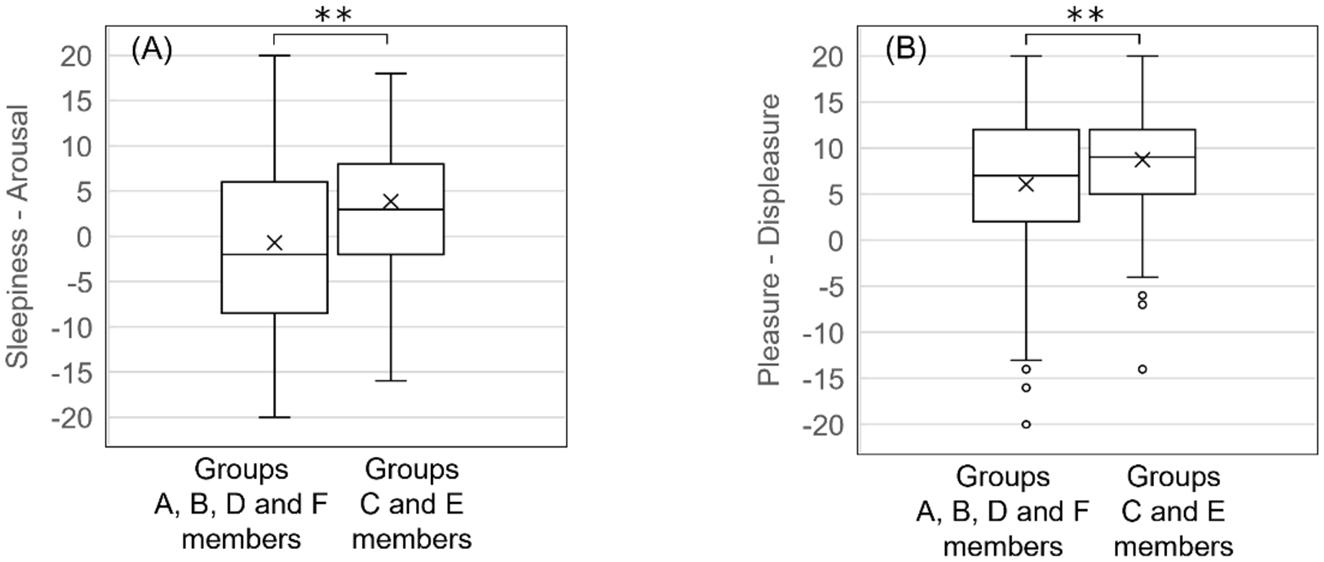
Subjective feeling of (A) sleepiness-arousal and (B) pleasure-displeasure for groups A, B, D and F members and groups C and E members.

(A) Light sleep index under the control environment conditions and the optimal environment conditions and (B) sleep efficiency under the control environment conditions and the optimal environment conditions for groups A, B, D, F.
On the basis of the above considerations, as we hypothesized that Groups C and E seem to not reflect accurate results because they are strongly nervous about the experiment and would not show normal response of autonomic nervous activity, the effects on the sleep only for Group A, B, D and F, excluding Group C and E, have been analyzed. Figure 9 shows the light sleep index evaluated with myBeat and sleep efficiency evaluated with Actigraph under the optimal environment conditions and control environment conditions for the subjects in Groups A, B, D and F. The light sleep index during sleep in the optimal environment was 73 ± 65 min and that in the control environment was 102 ± 56 min. The total time was decreased by 29% under the optimal environment conditions, and it shows a significant difference (
From these results, we show the possibility that optimal environment conditions before sleeping can improve sleep quality for a group of subjects that did not feel strongly nervous regarding this experiment. At the same time, we also propose a screening method with the LF/HF change for subjects who feel strongly nervous and that they might not respond as usual during the experiment. When conducting clinical studies which acquires vital data or subjective questionnaire data such as autonomic nervous activity, sleep and so on, the results may be masked by the stress of the experiment itself. Therefore, our proposed screening method is considered to be one of the effective methods to screening subjects and determine the effects more accurately. For example, our screening method would be effective in experiments in which concentration and emotion are investigated while the measurement device is attached to the body because the attached device would be a stressor itself. In this study, we applied the screening method by clustering, and we plan to improve this method further in the future.
As a limitation of this study, number of subjects were limited because extensive experiment is necessary. In addition, information other than that obtained from the questionnaire from the subjects, such as personality, current medical history and medical history, could influence the experiment and the outdoor air temperature which was around 10 °C in March in Tokyo could have affected the experimental results.
In this paper, our proprietary method for optimizing the multiple environment factors such as air, lighting, aroma and music for each individual in a short period was developed, and it was confirmed that LF/HF decreased by 19% with application of this method. While the effects of controlling the environment during sleep on the quality of sleep have been suggested in the past, no study elucidated the effects of controlling the environment before sleep on the quality of sleep. In this study, the effects on the quality of sleep by adjusting autonomic nervous activity through a control of the environment before sleep were evaluated. Based on the index for the light sleep index, effect of the optimal environment conditions before sleep was not clearly observed for all sixteen subjects. Clustering analysis was evaluated to analyze the cause deeply. As a result, for the group of experiment subjects who did not feel nervous about the experiment, the light sleep index was decreased under optimal conditions by 29% compared to the control conditions. From the result, greater effects were obtained in the group of subjects who seemed to be relaxed during the experiments. It indicates that the stimuli by the optimized environment condition is sufficiently effective in a relaxing daily life. Our environmental control system can improve the quality of sleep, leading to a prevention of lifestyle-related diseases, extension of healthy life expectancy, and improvement of quality of life (QOL).
Footnotes
Acknowledgements
The authors would like to thank WINFrontier Co., Ltd. for evaluation and analysis support.
Conflict of interest
None to report.