
Abstract
Adequate hydration is important for one’s health, but many people do not consume sufficient fluids. By constantly monitoring fluid intake, we gain information that can be extremely useful in dealing with unhealthy drinking habits. This paper deals with the problem of developing a machine learning method for drinking detection, intended for use on an edge device, with a specific focus on power consumption. The proposed approach is based on data from inertial sensors built into a practical, non-invasive wrist-worn device that monitors wrist movement throughout the day and automatically detects drinking events. It ensures low energy consumption by triggering the machine learning only when the probability of drinking is high, as well as by other energy saving measures. To develop and validate our methods, we collected data from 19 participants, which resulted in 135 hours of data, of which 2 hours and 30 minutes correspond to drinking activities. The algorithm was thoroughly assessed through both offline testing and by running the algorithm directly on the wristband in real life. During the offline evaluation, we obtained a precision of 94.5 %, a recall of 84.9 %, and an F1 score of 89.4 %. Testing in real life demonstrated a precision of 74.5 % and a recall of 89.9 %. Additionally, the energy efficiency analysis showed that our proposed technique for triggering the drinking detection method reduced the battery power consumption during the periods of inactivity by a factor of 5.8 compared to continuously monitoring for drinking events.
Introduction
Sufficient fluid intake is essential for overall health. Water, constituting approximately 60% of the body’s mass, plays a critical role in various bodily functions. It aids in transporting nutrients, removing waste, regulating body temperature, and supporting digestion and organ functions [14,16]. However, when the body lacks sufficient water, dehydration occurs, leading to a range of symptoms. Some people experience thirst, a dry or sticky mouth, and other signs of dehydration. While dehydration is a common issue for many individuals, it poses a particularly serious problem among the elderly population. Reduced perception of thirst, often combined with diminished cognitive abilities, can lead to the elderly forgetting to consume enough fluids [3,20]. This neglect in maintaining adequate hydration can result in a variety of serious health problems, including organ and cognitive impairment. The seriousness of dehydration in the elderly is underscored by the statistics. Patients admitted to the hospital for dehydration face a 17% chance of mortality within the first 30 days, and this risk increases to 48% after one year [10]. Furthermore, even after accounting for other factors, dehydrated elderly patients admitted to the hospital are six times more likely to die compared to those with a normal hydration status [10]. While these statistics suggest a correlation between dehydration and mortality, they do not establish direct causation. Thus, a cautious approach is needed to understand the complex relationship between dehydration and health outcomes in the elderly.
To address this issue, a system that can continuously monitor fluid intake and provide feedback to the user would prove highly valuable. By monitoring fluid intake in real-time, such a system could help individuals maintain optimal hydration levels, remind them to consume sufficient fluids, and prevent complications associated with dehydration.
The landscape of technology has evolved significantly, witnessed by the widespread adoption of smart wearables like smartphones and smartwatches. These devices boast built-in acceleration sensors and gyroscopes, enabling the detection of various human activities. Nevertheless, the issue of continuous activity recognition on mobile devices cannot be underestimated, as it can exact a toll on battery life. Energy efficiency, therefore, emerges as a paramount consideration in the realm of human activity recognition systems. This is especially pertinent for segments of the population such as the elderly or individuals reliant on wearables to enhance their daily lives, where frequent recharging might not be a practical option.
The research described in this paper was carried out as part of the CoachMyLife project [5], which has developed a supportive system for people with cognitive deficits that can offer personalized guidance for their daily activities. The system uses one or more cameras and a wearable device to detect the user’s situation, infer their current needs, and provide an appropriate reminder or advice if needed. The system is focused on kitchen activities, so, for example, it can detect the steps of preparing various meals and suggest the next step if the user appears confused. One functionality of the system is also drinking reminders, since – as mentioned previously – people with cognitive deficits often forget to hydrate adequately as they sometimes have difficulty detecting thirst. Since drinking can take place anywhere in the apartment or outside, we opted to detect it with the wristband rather than cameras. An additional advantage of the wristband is that it intrudes on the user’s privacy less than cameras. As there are many similar activities in everyday life that can be confused with drinking, an advanced method is needed that can easily distinguish these gestures. In addition, an energy-efficient implementation of the recognition method was designed for the wearable device to enable a long battery life. This is crucial for individuals with cognitive impairments who may forget to recharge their wristband regularly. Optimizing energy consumption ensures the device can operate efficiently for extended periods, enhancing its usability in monitoring fluid intake.
In this study, we focus on developing a practical solution for detecting drinking activity using a non-invasive sensing wristband. In particular, we propose a method for drinking recognition using classical machine learning (ML) algorithms implemented on a memory constrained microcontroller. As a part of this study, the following scientific contributions are made:
A publicly available annotated dataset consisting of data from an inertial measurement unit (IMU), acquired from a sensing wristband, containing recordings of drinking gestures in a controlled environment. Development of a memory-efficient and energy-efficient implementation of an ML-based method for real-time drinking detection on a resource-constrained device. The method uses IMU data and is based on a threshold trigger that activates the ML process. An extensive performance evaluation. This includes a comparison of ML models in an offline manner, a comparison of different signal window lengths, a controlled test of the drinking detection pipeline on the wristband in a laboratory environment and a test of the detection pipeline on the wristband in a natural environment.
The paper is organized as follows: Section 2 gives an overview of the current state-of-the-art approaches for drinking detection using different types of wearable sensors, especially smartwatches that work with ML methods. In Section 3, we present the details of the hardware equipment used for this study. In Section 4, we present the dataset collection process and its properties. Section 5 describes the development of an energy- and memory-efficient method for real-time drinking detection using a wristband. In Section 6, each step of our proposed ML based method for drinking detection is presented. The experimental setup used in the study and the evaluation results are presented and discussed in Section 7. The paper is concluded in Section 8.
Related work
Existing solutions for monitoring fluid intake come in the form of apps that send reminders to the user or require manual input of the amount of ingested fluids using a smartwatch or smartphone (e.g., WaterMinder app
Solutions based on computer vision, sound or wearable devices are being researched [4,18,22]. Vision-based approaches utilize cameras and computer vision algorithms, including deep learning, to detect drinking activity. Many studies have employed Microsoft Kinect to calculate depth and capture RGB images. Chua et al. used a Haar-like deep learning feature algorithm on images to detect hand grasping a cup [4]. They also used a Microsoft Kinect in front of the subject to detect hand postures during drinking activity [28]. Drinking events were classified with 89% accuracy using Dynamic Time Warping (DTW) [28]. Kassim et al. and Cunha et al. also used a Kinect to monitor wrist joint motion and determine the number of bites and sips consumed [6,12].
Sound-based approaches have explored innovative methods for detecting drinking activity. Smartwatches equipped with built-in microphones have been used to identify chews and swallows as part of monitoring nutrition. Evaluation results confirm the efficacy of this technique, with an F-measure of 94.5% based on 250 collected samples [18]. Additionally, multi-modal sensing, including in-ear audio and motion data from head and wrist sensors, has been proposed to accurately classify food type and estimate the amount consumed, reducing weight estimation errors from a baseline of 127.3% to 35.4% absolute relative error [22]. Acoustic sensors have also been explored as a means of detecting drinking activity. For example, Tommy et al. developed a bottle that incorporated an ultrasonic distance sensor to track liquid levels, an accelerometer to monitor the position of the bottle cap, and temperature and humidity sensors to provide recommendations [33]. Similarly, Vithanage et al. proposed the SmartOne device, which combined a humidity sensor to detect when the mouth was near, an IMU to identify drinking patterns, and an ultrasound sensor to measure the volume of liquid in the container [35]. The device also featured a temperature sensor for providing accurate intake recommendations, as well as pH and turbidity sensors to monitor the quality of the liquid [35]. However, these suggestions are limited by the angles of the captured photos, privacy concerns of video or audio recordings, background noise overlapping with the selected sound [14], etc.
The latest set of research on the recognition of drinking periods is based on the use of inertial sensors placed on the wrist. Chun et al. applied an adaptive segmentation technique on a continuous stream of inertial data captured with a practical, off-the-shelf wrist-mounted device to detect fluid intake gestures [27]. They evaluated their approach in a study with 30 participants where 561 drinking instances were recorded. Using a leave-one-subject-out (LOSO), they were able to detect drinking episodes with 90.3% precision and 91.0% recall, demonstrating the generalizability of their approach [27]. Hamatani et al. developed FluidMeter, a system that uses a two-step detection procedure to detect drinking periods and estimate fluid intake [14]. They extracted 28 statistical features and selected 6 using a feature selection algorithm. They trained a Markov conditional random field (CRF) model, achieving 81.7% accuracy [14]. FluidMeter was evaluated by collecting large datasets in different environments by 70 participants using different container and beverage types. The results showed that FluidMeter can accurately detect drinking activity (with 84% precision and 87% recall) and identify the Sip micro-activity (with 91% precision and 96% recall). It can estimate daily fluid intake in grams with an error limited to 15% [14]. Gomes and Sousa developed a system to recognize the pre-drinking hand-to-mouth movement (a drink trigger) with the goal of predicting drinking events in real-time and free-living conditions [13]. They used a ML model, extracting 10 time-domain features and training a Random Forest algorithm. They tested their method in a natural environment, achieving 84 % accuracy and 85 % recall [13]. Their system, based on a single IMU placed on the forearm, is unobtrusive and user-independent. Drinking events outside meal periods were detected with an F-score of 97 % in an offline validation with data from 12 users, and 85% in a real-time free-living validation with five other subjects [13]. Their results also revealed that the algorithm first detects the hand-to-mouth movement 0.70 s before the occurrence of the actual sip of the drink [13].
Amidst these advancements, it is crucial to address power consumption concerns associated with wearable devices and resource-constrained devices. Strategies such as identifying an optimal sensor sampling frequency [19], implementing duty cycling [37], activating energy-inefficient sensors selectively [36], and considering complex activity recognition features only upon detecting events by simpler time-domain features [7] offer varying trade-offs between energy consumption and detection performance [17]. However, most existing approaches in the field of ML deployment on resource-constrained devices have overlooked the power efficiency aspects. Often, wearable devices have predominantly served data collection purposes, transmitting raw sensor data wirelessly to external processing units, thus partly bypassing the requirement of power consumption optimization within the devices themselves [3,13,14,27]. Certainly, none of the approaches for drinking detection known to us have considered this aspect. Therefore, a holistic approach is necessary to directly address power consumption concerns while designing and implementing ML solutions for resource-constrained devices.
Hardware description
The CoachMyLife project used the wristband shown in Figure 1, which was specifically intended for use by the elderly and people with mild cognitive impairment. For this reason, the design of the wristband is simple. Energy efficiency is also important, as the target group often forget to charge their smart devices. The wristband was designed and manufactured by Caretronic, a company that deals with professional solutions for nursing homes, hospitals and other care facilities and users [25]. The wristband is equipped with a System on Chip (SoC) nRF52840, which is suitable for sophisticated applications that require the simultaneous execution of tasks and a diverse set of peripherals. To achieve the desired minimum power consumption, only a pushbutton (to trigger an alert when the user presses it), a signal LED and an LSM6DSL acceleration and angular velocity sensor are connected to the chip.

Sensing wristband used for drinking detection.
The drinking detection algorithm is implemented on the nRF52840 SoC. The core of the SoC is a 32-bit processor based on the ARM® Cortex™-M4 architecture running at 64 MHz. It is equipped with 1 MB of flash memory and 256 KB RAM, Bluetooth Low Energy 5 (BLE) support and a Floating-Point Unit (FPU). The chip is manufactured by Nordic Semiconductor, a Norwegian company specialized in wireless technology used in the Internet of Things (IoT) [23].
Acceleration and angular velocity measurements are performed by the LSM6DSL system-in-package sensor, manufactured by STM, equipped with a 3D digital acceleration sensor and a 3D digital gyroscope operating at 0.65 mA in high-performance mode (maximum sampling rate) and down to 4.5 μA in low-power accelerometer-only operation mode [21,32]. The most important feature is the built-in 4 kB First In First Out (FIFO) buffer that facilitates autonomous recording of the acceleration and angular velocity data, allowing the master microcontroller to spend the majority of the time in a low-power sleep state.
The dataset is a primary requirement for the development of any ML method. Although the scientific community is actively exploring the field of automatic drinking detection, none of the datasets were freely available for use. For this reason, we decided to collect our own dataset containing recordings of drinking gestures. We also decided to publish the dataset [9] to make it freely available to researchers who want to collaborate in the field of drinking detection.
As a part of this study, we collected data from 19 participants (12 males and 7 females), who were healthy volunteers without any medical conditions that could have affected the data collection process. The mean age of the participants was 30 ± 16 years (range 10–73 years). All participants received detailed information about the purpose of the research, their role and how their data will be managed, stored and published as a freely accessible file. Additionally, all participants provided written informed consent before participating in the study. The total duration of the data collection was 135 hours, of which 2 hours and 30 minutes corresponded to drinking activities, during which 451 drinking gestures were recorded.
Each participant was equipped with a wristband as described in Section 3. For the data collection, we developed an application that ran on the wristband. The application collected data from the 3-axis accelerometer and the 3-axis gyroscope at a sample rate of 52 Hz. The data coming from the wristband was streamed to another device, called HomeTab. The HomeTab is a digital memory device developed by Caretronic and can be seen in Figure 2. It has an application that connects to the wristband, collects the sensor data and later sends the data to a cloud database.
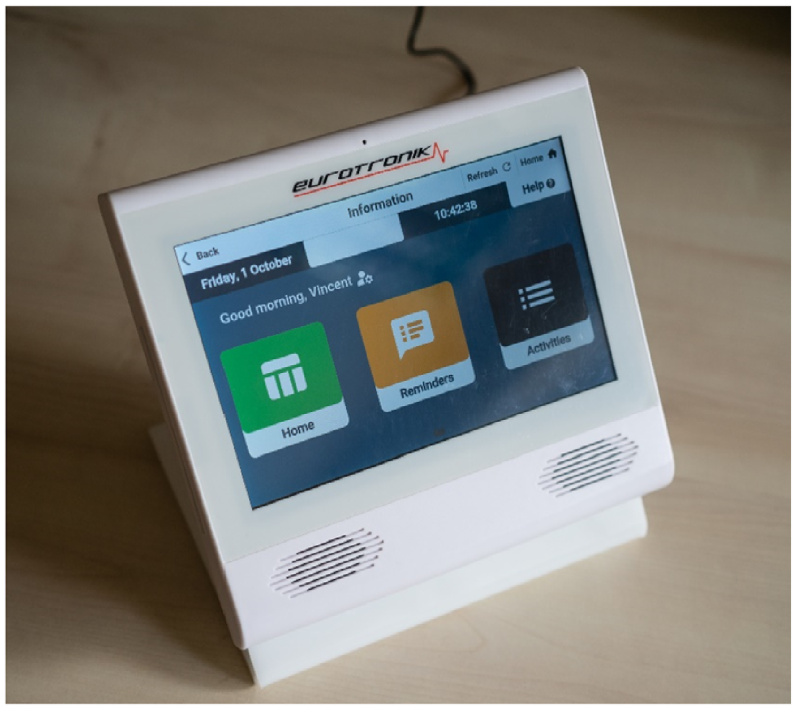
HomeTab – a digital memory device developed by Caretronic that was used for collecting sensor data, and sending it to a cloud database.
A general procedure was developed which the participants followed during the data collection process. After placing the wristband on the dominant arm, the participant pressed a button on the wristband, which connected to the HomeTab via a BLE connection and started recording data. The participant waited for approximately 5 seconds and then started drinking. After finishing drinking, the participant put the container down on the table and waited for 5 seconds. The recording was stopped by pressing the button on the wristband again. HomeTab processed the received data and uploaded it to a Firebase cloud database [11].
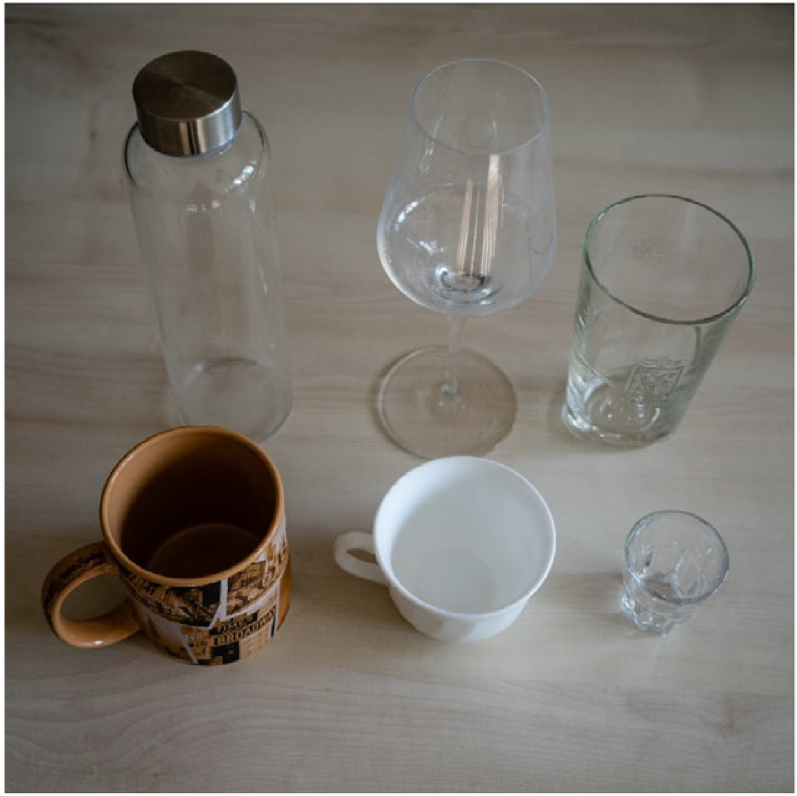
The containers from which the participants drank.
The data collection involved drinking from six different types of containers (Figure 3): a bottle, a cup, a small coffee cup, a glass, a shot glass and a wine glass. Three different fluid levels were used to obtain short, medium and long drinking episodes. Different body positions were also considered. Participants initially performed drinking gestures in a seated position and then repeated the same gestures while standing. For each participant, we collected 36 drinking episodes (6 containers × 3 fluid levels × 2 postures). In addition to the anonymous participant code, the data were also labelled with the type of drinking container, the participant positions and the fluid level. The whole procedure of acquiring the 36 gestures took approximately 60 min. The total duration of the collected drinking data is 2 hours and 30 minutes, where each drinking combination is equally represented.
The described procedure provided only the drinking data. However, to train a classification model, we also need data from the negative class that covers non-drinking hand movements. To reduce the time needed for data collection, we decided to use the EatingDetectionIJS [29] dataset, which contains accelerometer and gyroscope data collected using a wristband. The dataset was recorded completely in real life and contains labelled periods of eating. An application was developed that ran on a commercially available smartwatch, Mobvoi TicWatch S, powered by the WearOS operating system. Participants wore the smartwatch during the day and pressed a button on the watch to mark eating periods during meal times [31]. The application collected data from a three-axis accelerometer and a three-axis gyroscope at a sampling rate of 100 Hz [31]. Since the eating periods in the dataset were labelled, we were able to exclude them and use only periods when people were not eating. We then subsampled the filtered data to 52 Hz to match the drinking data.
This section describes the approach for real-time drinking detection. The approach follows the typical ML paradigm and consists of the following steps: (i) Data preprocessing; (ii) signal segmentation; (iii) feature extraction; (iv) feature selection; (v) model training.
The raw data coming from the wristband includes three signals from an accelerometer and three signals from a gyroscope. The first step in the preprocessing pipeline involves filtering of the signals using a fifth-order median filter. This filter was used to primarily mitigate noise and outliers while preserving the underlying signal characteristics. Next, the signals were processed with a third-order low-pass Butterworth filter with a cutoff frequency of 3 Hz. This choice strikes a balance between noise reduction and preserving the relevant frequency components of the human motion signal. Additionally, the drinking gesture involves relatively slow and smooth motions and the frequency content of the corresponding IMU data is limited to the lower end of the spectrum.
Next, in addition to the raw sensor signals (x, y and z axis) we extracted the magnitude of the acceleration and gyroscope vector. The magnitude vectors can provide useful information about the overall intensity.
The next step in the pipeline was to select the appropriate window size for the sliding-window segmentation technique. This step involves finding a balance between capturing enough motion information and ensuring that the window is appropriately sized for the temporal characteristics of the drinking gesture. The window size used for the analysis was determined experimentally, and it was found that a size of 256 samples, corresponding to 4.92 s, provided optimal results for capturing the relevant gesture patterns. Each window was labeled with the majority class (drinking if more than half the window was drinking), and multiple consecutive windows labeled as drinking count as one drinking event.
Once the data were filtered and windowed, feature extraction techniques were applied to extract relevant information from the IMU data, that can be used by the ML algorithm to distinguish between the motion patterns associated with drinking and those associated with other activities. Computing a large number of features can be computationally burdensome, leading to increased processing times and resource utilization. To address this issue, a feature selection step was implemented to retain only the most relevant and informative features, thus enhancing computational efficiency while maintaining the accuracy of the results.
Feature description
The features can be roughly divided into two categories: time-domain and frequency-domain. The idea was to include multiple views of the signal from which the algorithm could select the most informative features. Time-domain features are used to differentiate persistent patterns or trends over time, while frequency-domain features describe the periodicity of the signal.
These features were calculated using the signals of all axes of the accelerometer and gyroscope.
Feature selection
The use of multiple data streams for feature extraction resulted in a total of 294 extracted features. Consequently, we used a feature selection method to remove those that do not positively impact the model’s performance. In addition to improving the performance, our objective was also to improve the energy efficiency by having to compute fewer features on the wristband. To begin with, we determined the mutual information between the features and the label, which indicates the reduction in uncertainty about the label when the feature is known. Following that, we determined the correlation between each pair of features using the Pearson correlation coefficient. In cases where there was a strong correlation (measured as a correlation coefficient greater than 0.8) between a pair of features, the feature with lower mutual information was removed. This showed that roughly half of the features were redundant, which was expected due to the number of features and the similarity of the data streams. Finally, features were selected using a greedy “wrapper” algorithm that was first trained using only the feature with the highest mutual information. Then the second-best feature was added, and the model was trained again. If the accuracy on the validation set was improved, the feature was kept. This procedure was repeated for all remaining features.
To evaluate the performance of our methods on a general population, we used the LOSO cross-validation, in which the ML model is trained on the data of all subjects but one and tested on the remaining subject, which is then repeated for all subjects. We always used only the training portion of the data for feature selection, so we had a slightly different feature set for each subject. Finally, to generate one set of features that would be used to train the model deployed on the wristband, we used the intersection of all sets of features generated during the above described procedure. We found both time- and frequency-domain features in the intersection. Among the time-domain features, most were generic time-series features; some were also acceleration-specific, such as the difference in velocity over the window, but these were in the minority, possibly because the acceleration features from which they were selected were designed for generic activity recognition, which is typically more dynamic than drinking detection.
Energy efficient detection of potential drinking
Nowadays, continuous sensor sampling, which was once considered inefficient, has become more energy-efficient, thanks to advancements in inertial measurement devices. These advanced sensors provide an “always-on” experience while consuming relatively small amounts of energy. In contrast, the microcontroller itself is less energy efficient, making it desirable to keep it in a sleep state for extended periods of time. Energy saving features of sensors include the ability to trigger interrupt requests based on specific events, dynamically adjust the sampling frequency to optimize power consumption, turn on or off specific components like the accelerometer or gyroscope, and to switch between certain operation modes of the built-in FIFO buffers that can store multiple sensor readings before transmitting them to the microcontroller. These features enable the microcontroller to stay in a low-power sleep state for extended periods of time, resulting in reduced power consumption of the overall system.
The LSM6DSL IMU can autonomously recognize a few different events, which can be used to trigger interrupt requests or operation modes. We used detection of activity and detection of Absolute Wrist Tilt (AWT), to transition from the low-power acceleration-monitoring-only mode to the high-performance motion-monitoring state and drinking detection. Activity detection is based on changes of acceleration on all three axes. AWT is detected when an angle between the selected accelerometer axis and the horizontal plane exceeds a user-defined threshold for longer than the specified time. We used the x-axis of the sensor to detect when the participant is doing hand-to-mouth gestures. The main reason for choosing this axis is that the gravitational pull is mostly present along this axis when the hand is positioned vertically, towards the head. Additionally, Figure 4 shows that the angle between the horizontal plane and the arm changes most along the arm axis, i.e., the x-axis on the wristband. Different angle values were tested, and it was found that the trigger was optimally activated for drinking events when the angle value was set to 30°.

Comparison of the acceleration signal when the arm is at rest (left) and when the arm is in front of the head (right).
The IMU starts operating in activity/inactivity detection mode, prioritizing energy efficiency. During periods of inactivity, only the acceleration sensor of the IMU is enabled with a reduced sampling frequency of 12.5 Hz. This ensures that the sensor remains in the most energy-efficient state most of the time. In this mode, the system monitors the acceleration values, and if they exceed a predefined threshold, the sensor detects “activity.” In response, it increases the sampling rate to 52 Hz and wakes up the microcontroller using an interrupt request, which in turn, enables the gyroscope, reconfigures the FIFO buffers to operate in continuous FIFO mode, enables AWT detection and then returns to sleep state (start of window 1 in Figure 5). Enabling the gyroscope and starting data recording before AWT has been detected, facilitates capture of more motion data during active periods, providing a more comprehensive understanding of the user’s movements. The IMU keeps recording motion data until both the FIFO buffer is full and the AWT event is detected, or timeout occurs. Window 1 in Figure 5 marks the samples acquired during this first stage. When the FIFO buffer is full for the first time, the IMU generates an interrupt request to wake up the microcontroller again, which then reads the data. The IMU proceeds to fill the FIFO buffer three more times (windows 2 and 3 in Figure 5, window 4 is not shown). A predefined set of features is then extracted for each window using the process described in Section 5.1. The feature vector is passed to a pretrained ML model that makes a prediction about drinking.

Display of FIFO buffer filling process before an AWT event and windowing of acceleration sensor signals.
If prediction for at least one window is positive, this is communicated to the central device via the BLE connection. Drinking tends to be a one-off event or a short succession of short sips which is counted as one drinking event. Therefore, the detection procedure is not restarted immediately after each detected event, but only after all four acquired windows of data have been processed. The length of four windows or 20 s is long enough to cover most drinking events and short enough not to waste too much energy. After all four windows have been processed, the microcontroller sets the IMU back into the low-power activity-detection mode and returns to sleep state. A block diagram of the implementation of the drinking detection method is shown in Figure 6, where blue represents the implementation of the algorithm on the IMU and yellow represents the implementation of the algorithm on the microcontroller.

Block diagram of the drinking detection implementation.
This section describes the experiments and their results. The first part covers the evaluation metrics used in the study, the next part the set of experiments that were performed to evaluate the proposed method, and finally, a power consumption analysis is performed and an estimation of the battery life time is given.
Experimental setup
As mentioned in Section 5.2, to evaluate the performance of the proposed method, a LOSO cross-validation technique was performed. The model performance scores were obtained as the average of the performance of all participants. The reason for this is to get a good estimate on how well the developed method will perform in a real life situation where we get data from previously unseen participants. The following evaluation metrics were used to assess the performance of the drinking detection method: Recall, Precision, and F1 score. These criteria are the most commonly used for this type of problem, as they give a realistic estimate of the algorithm’s performance. Each of the mentioned criteria was calculated using drinking events as the positive class. The recall shows how many of the drinking events present in the test were detected by the model as drinking. On the other hand, precision tells us how many of the detected drinking events were actual drinking events. These criteria reflect the ability of the models to detect the periods of drinking at window level. Equations (1)–(3) describe the aforementioned evaluation criteria, where TP (True Positive) represents true detection of drinking activity, FN (False Negative) represents falsely detected non-drinking activity and FP (False Positive) represent falsely detected drinking activity.
Equation (1) describes the recall of a ML model.

Equation (2) describes the precision of the ML model.

Equation (3) describes the F1 score of the ML model.

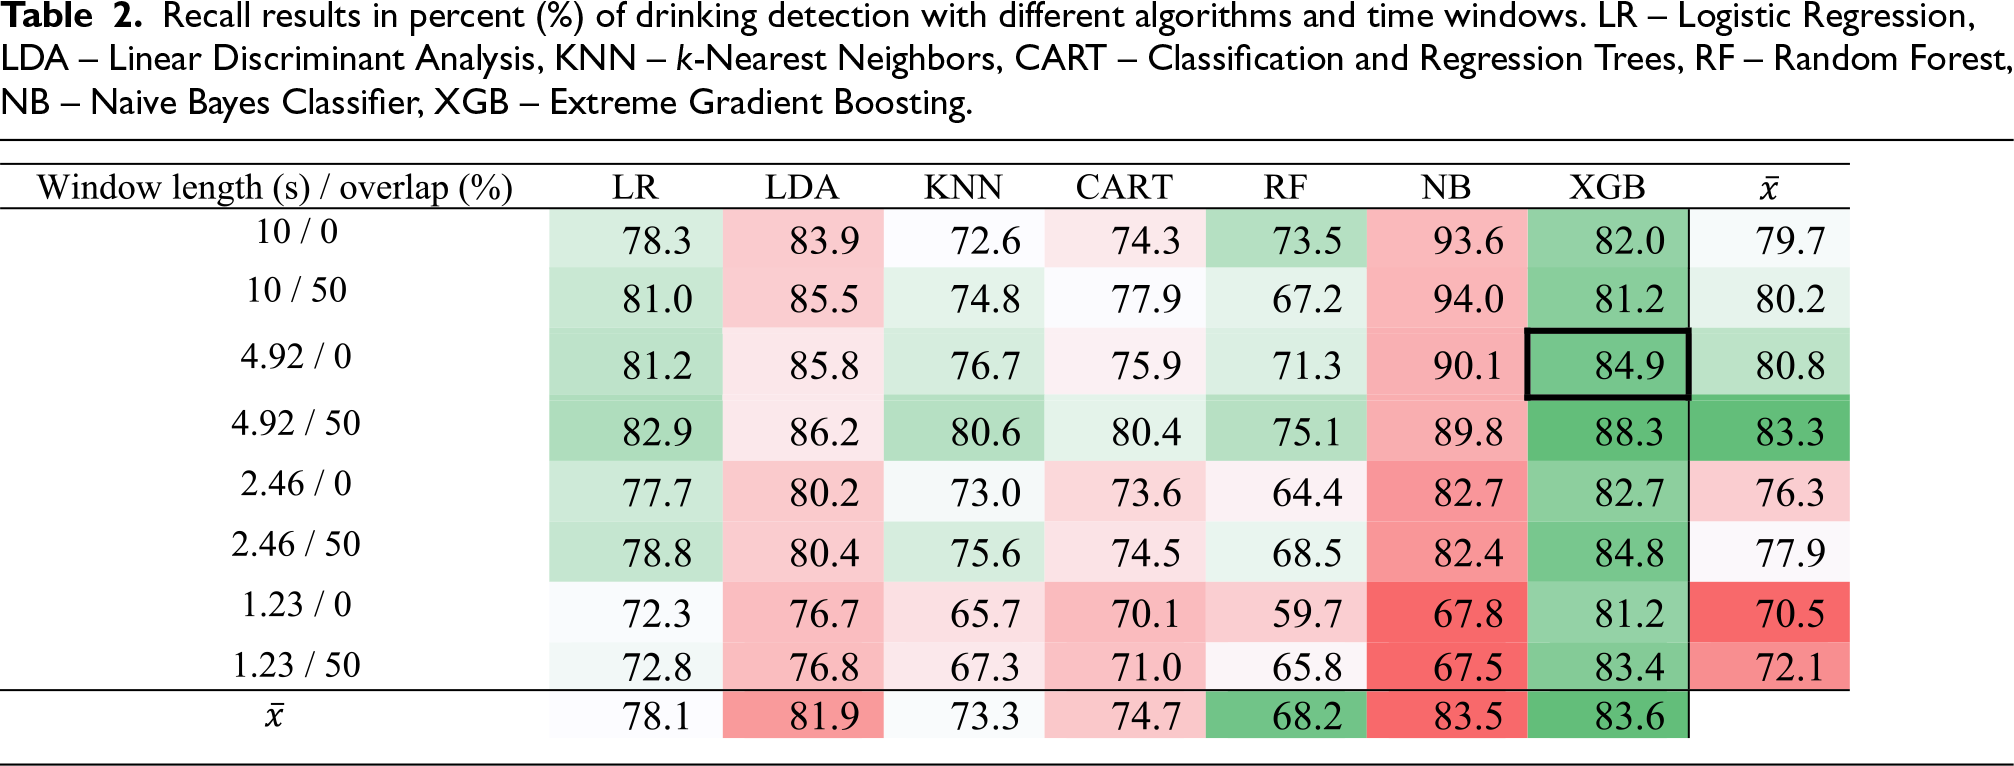
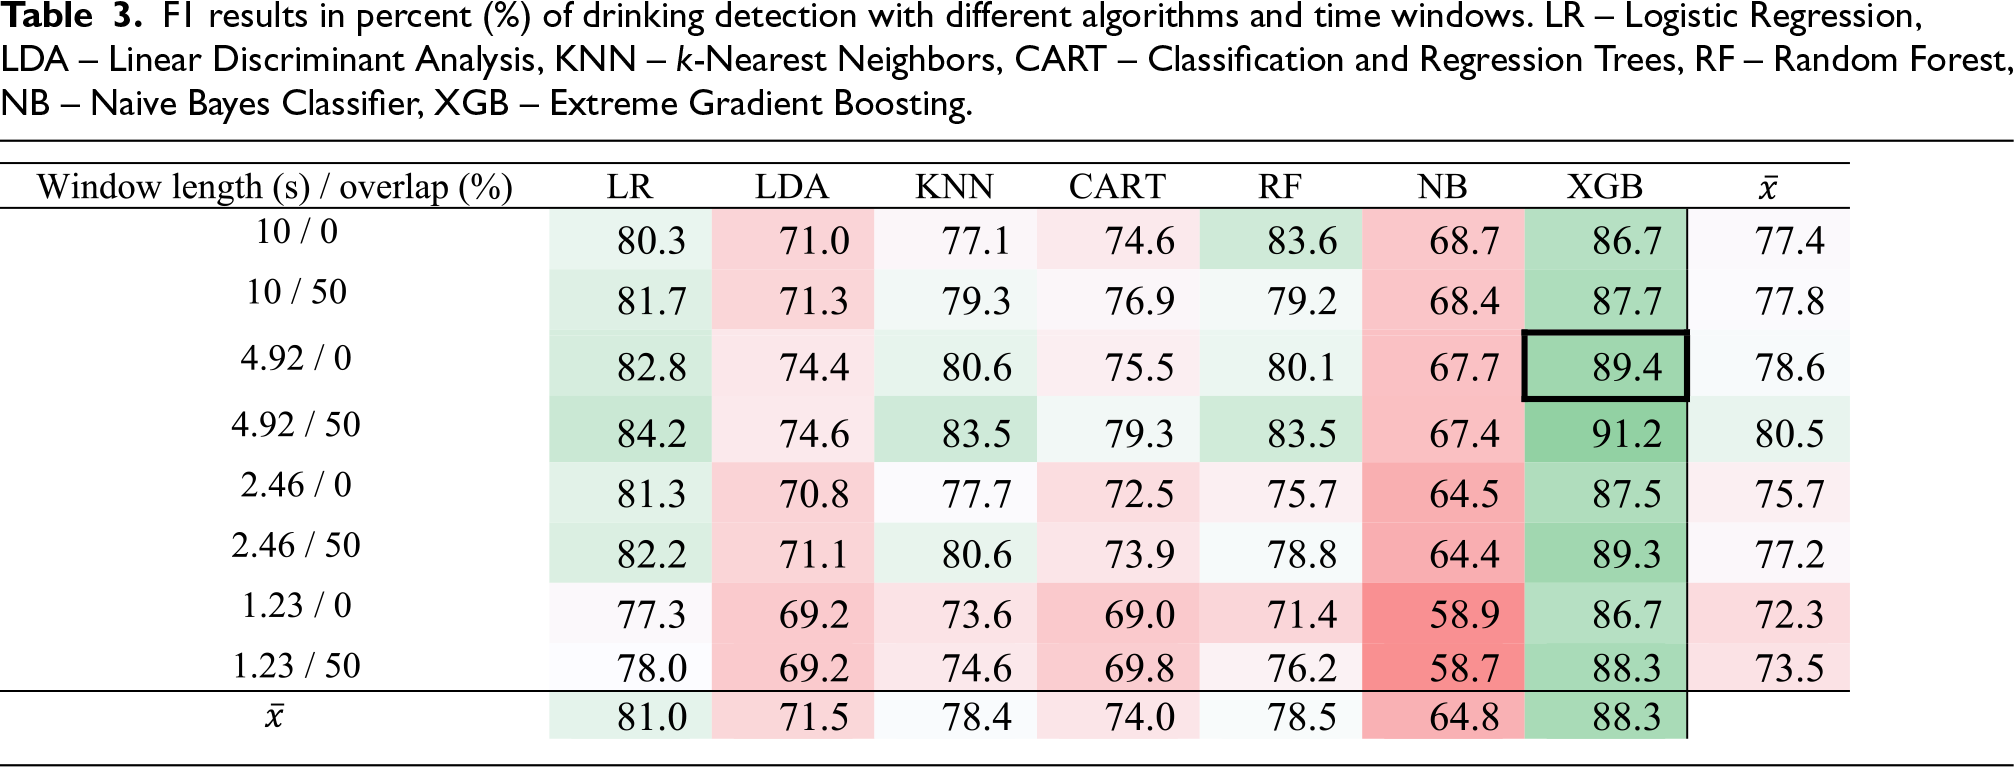
The process of embedding a ML model on a microcontroller required selecting the best performing model as a first step. For this reason, the initial model comparison was performed on a computer, which is faster and more flexible. Tables 1 to 3 show the results of the comparison of different ML algorithms and different time window lengths, which will be discussed in more detail in Sect. 7.2.1 and 7.2.2. The achieved results of the finally selected combination of the window length/overlap and algorithm are highlighted in the tables with a strong cell border: XGB algorithm with window length of 4.92 s and no overlap achieved a precision of 94.5 %, a recall of 84.9 % and an F1 score of 89.4 %.
Precision results in percent (%) of drinking detection with different algorithms and time windows. LR – Logistic Regression, LDA – Linear Discriminant Analysis, KNN – k-Nearest Neighbors, CART – Classification and Regression Trees, RF – Random Forest, NB – Naive Bayes Classifier, XGB – Extreme Gradient Boosting.
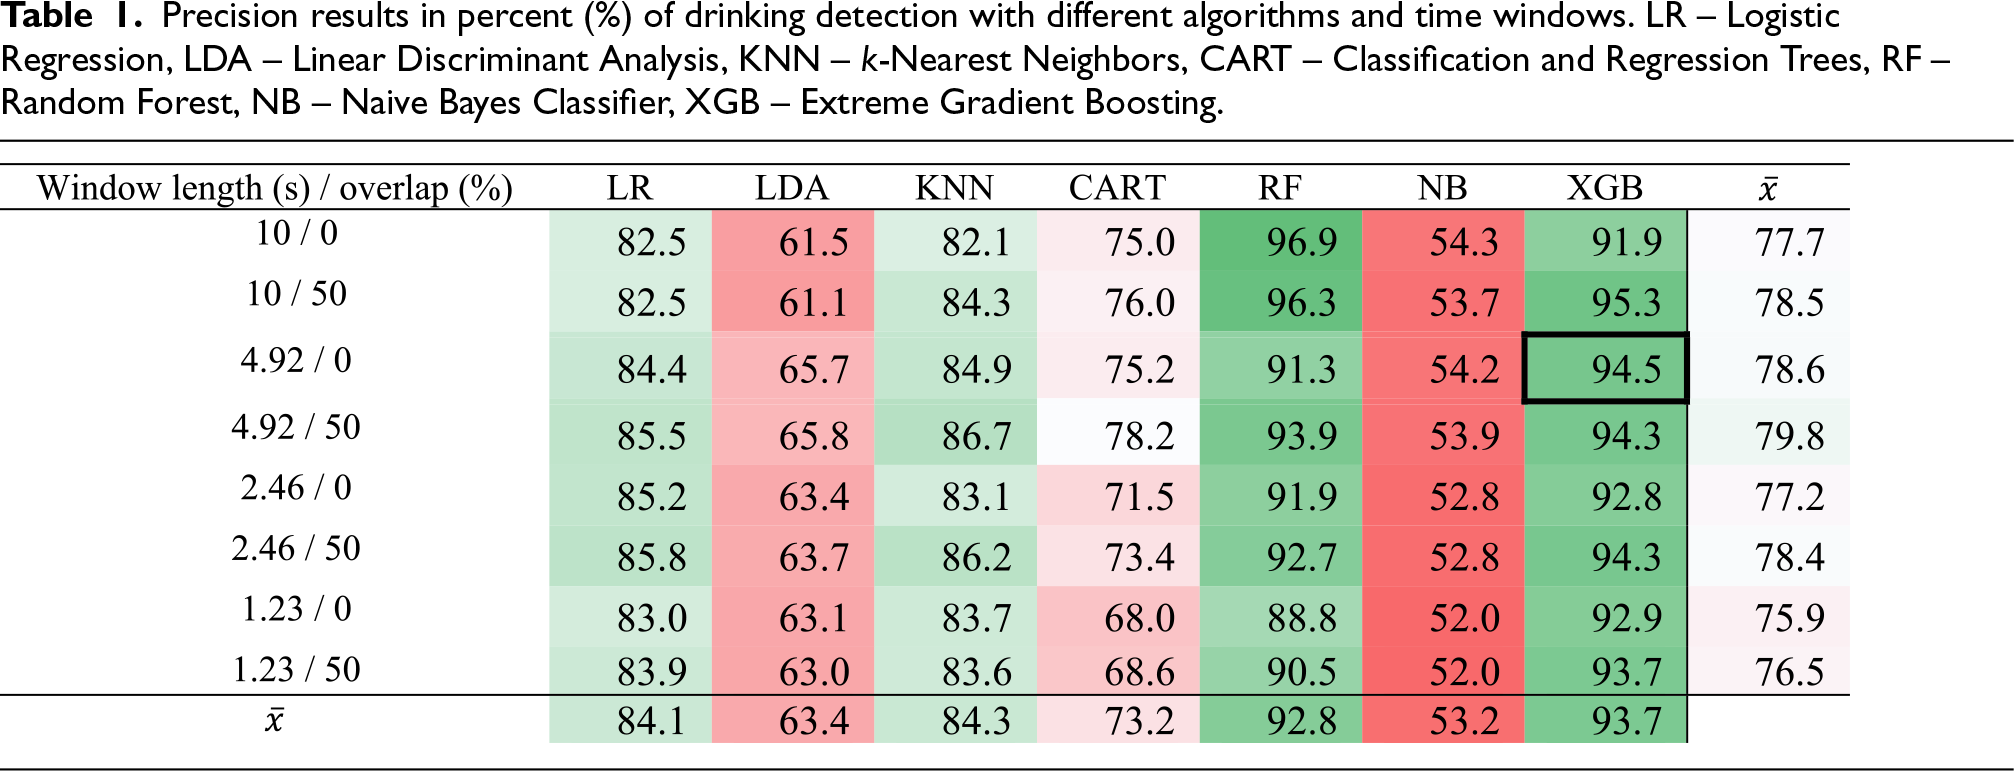
Precision results in percent (%) of drinking detection with different algorithms and time windows. LR – Logistic Regression, LDA – Linear Discriminant Analysis, KNN – k-Nearest Neighbors, CART – Classification and Regression Trees, RF – Random Forest, NB – Naive Bayes Classifier, XGB – Extreme Gradient Boosting.

Recall results in percent (%) of drinking detection with different algorithms and time windows. LR – Logistic Regression, LDA – Linear Discriminant Analysis, KNN – k-Nearest Neighbors, CART – Classification and Regression Trees, RF – Random Forest, NB – Naive Bayes Classifier, XGB – Extreme Gradient Boosting.

F1 results in percent (%) of drinking detection with different algorithms and time windows. LR – Logistic Regression, LDA – Linear Discriminant Analysis, KNN – k-Nearest Neighbors, CART – Classification and Regression Trees, RF – Random Forest, NB – Naive Bayes Classifier, XGB – Extreme Gradient Boosting.
To verify the predictive performance of the proposed drinking detection method, multiple models based on classical ML were compared. We chose some simple algorithms, such as logistic regression, because we wanted to keep the model size as small as possible, and ensemble algorithms because they perform well on unbalanced datasets. Ensemble algorithms can achieve superior performance compared to simple ML algorithms by combining the predictions of weaker models and learning non-linear relationships.
In Table 3, the average result of the model F1 score on windows of different lengths and overlaps can be seen in the bottom row. As expected, the best performing ensemble models were Random Forest and XGB. It can be seen that the precision results are slightly greater than the recall results. This means that the models are good at distinguishing between drinking events and everyday activities that they do not classify as drinking. The lower recall means that the models tended to classify the actual drinking as a non-drinking event. These were often cases where the x- and y-axis data did not change drastically due to small wrist or hand tilts while drinking. From the results in Tables 1 to 3, we can see that the algorithms achieved quite different results, but XGB has a clear advantage. For this reason, we decided to use XGB as our baseline ML algorithm for drinking detection.
Window comparison
When segmenting signals, it is important that the selected window length is optimal for the chosen task. Based on the collected drinking data, whenever we asked the participants to drink, we found that in most cases the drinking event lasted between 3 to 15 seconds. For this reason, we compared windows ranging from 1.23 to 10 seconds, as in this way at least one window can coincide with a drinking event. The window length was dependent on the number of samples suitable for FFT on the microcontroller, which are powers of two.
In Tables 1 to 3, we can see that when window overlap is used, the results are better regardless of the length of the window. By overlapping windows, more data is generated, which means that there is a higher probability of a drinking event occurring in a given window. The last column on the right-hand side of the tables shows the average results of the precision, recall and F1 scores of the models with respect to a window of the given length. It can be observed that the best results are obtained for a window length of 4.92 with 50 % overlap, with a F1 score of 80.5 %. Due to the small difference in the results and better energy efficiency, we chose a window of length 4.92 s without overlap, which corresponds to 256 samples, to be used on the microcontroller.
Online evaluation of the machine learning procedure
This section presents the results obtained from the complete implementation of the energy-efficient drinking detection algorithm, which runs directly on the wristband (Section 6). One of the goals of this evaluation is to assess how the energy-efficient implementation compares to the performance of the offline approach where only an ML-based algorithm for drinking detection was used. Additionally, the energy-efficient implementation running on the wristband was tested to see how the algorithm works on previously unseen data, both in a laboratory and in a free-living environment.
Before running the controlled and real life tests, we assessed the equivalence of the Python model used on the computer, and the C-converted model used on the wristband microcontroller. We selected 10 random signal windows on which we calculated the feature vector. Five feature vectors were generated on the computer and the other five on the microcontroller. We then fed the vectors to the two models and compared the prediction results. Both models’ calculated probabilities of an event being a drinking event matched to two decimal places. The differences are due to the different types of floating-point variables on the microcontroller and the computer. Additionally, this test confirmed that the implementation of the feature extraction procedure running in Python on a personal computer and in C running on the wristband results in the same feature vectors.
Controlled experiment
We used a controlled experiment to test the performance of the drinking detection pipeline on a wristband in a laboratory environment. This allowed us to verify the performance with data like the training dataset, but which was crucially not used for model training. A total of 10 participants with a mean age of 42.2 ± 18.2 (range 22–73) gave informed consent and voluntarily participated in the drinking detection test. These participants were not involved in the collection of the training data. Each person was asked to drink repeatedly from different containers and to perform a series of other activities involving hand movements, namely hand-to-mouth movements in different contexts of whole-body activity (two postures and walking).
Table 4 lists all the activities to be performed by the volunteers. The non-drinking activities were selected so that they require similar movements as drinking activities in order to verify that the model cannot be easily confused. Participants were instructed to be at rest before and after the activity and to perform one of the activities on cue. Participants were free to choose the amount of liquid they drank from the container. Recordings from 3 volunteers were unfortunately unusable, due to technical difficulties, giving us a total of 170 recordings of activities from 7 volunteers, 63 drinking activities and 107 non-drinking activities (2 volunteers performed one of the non-drinking activities twice).
The planned activities to be carried out by each participant during the controlled test.
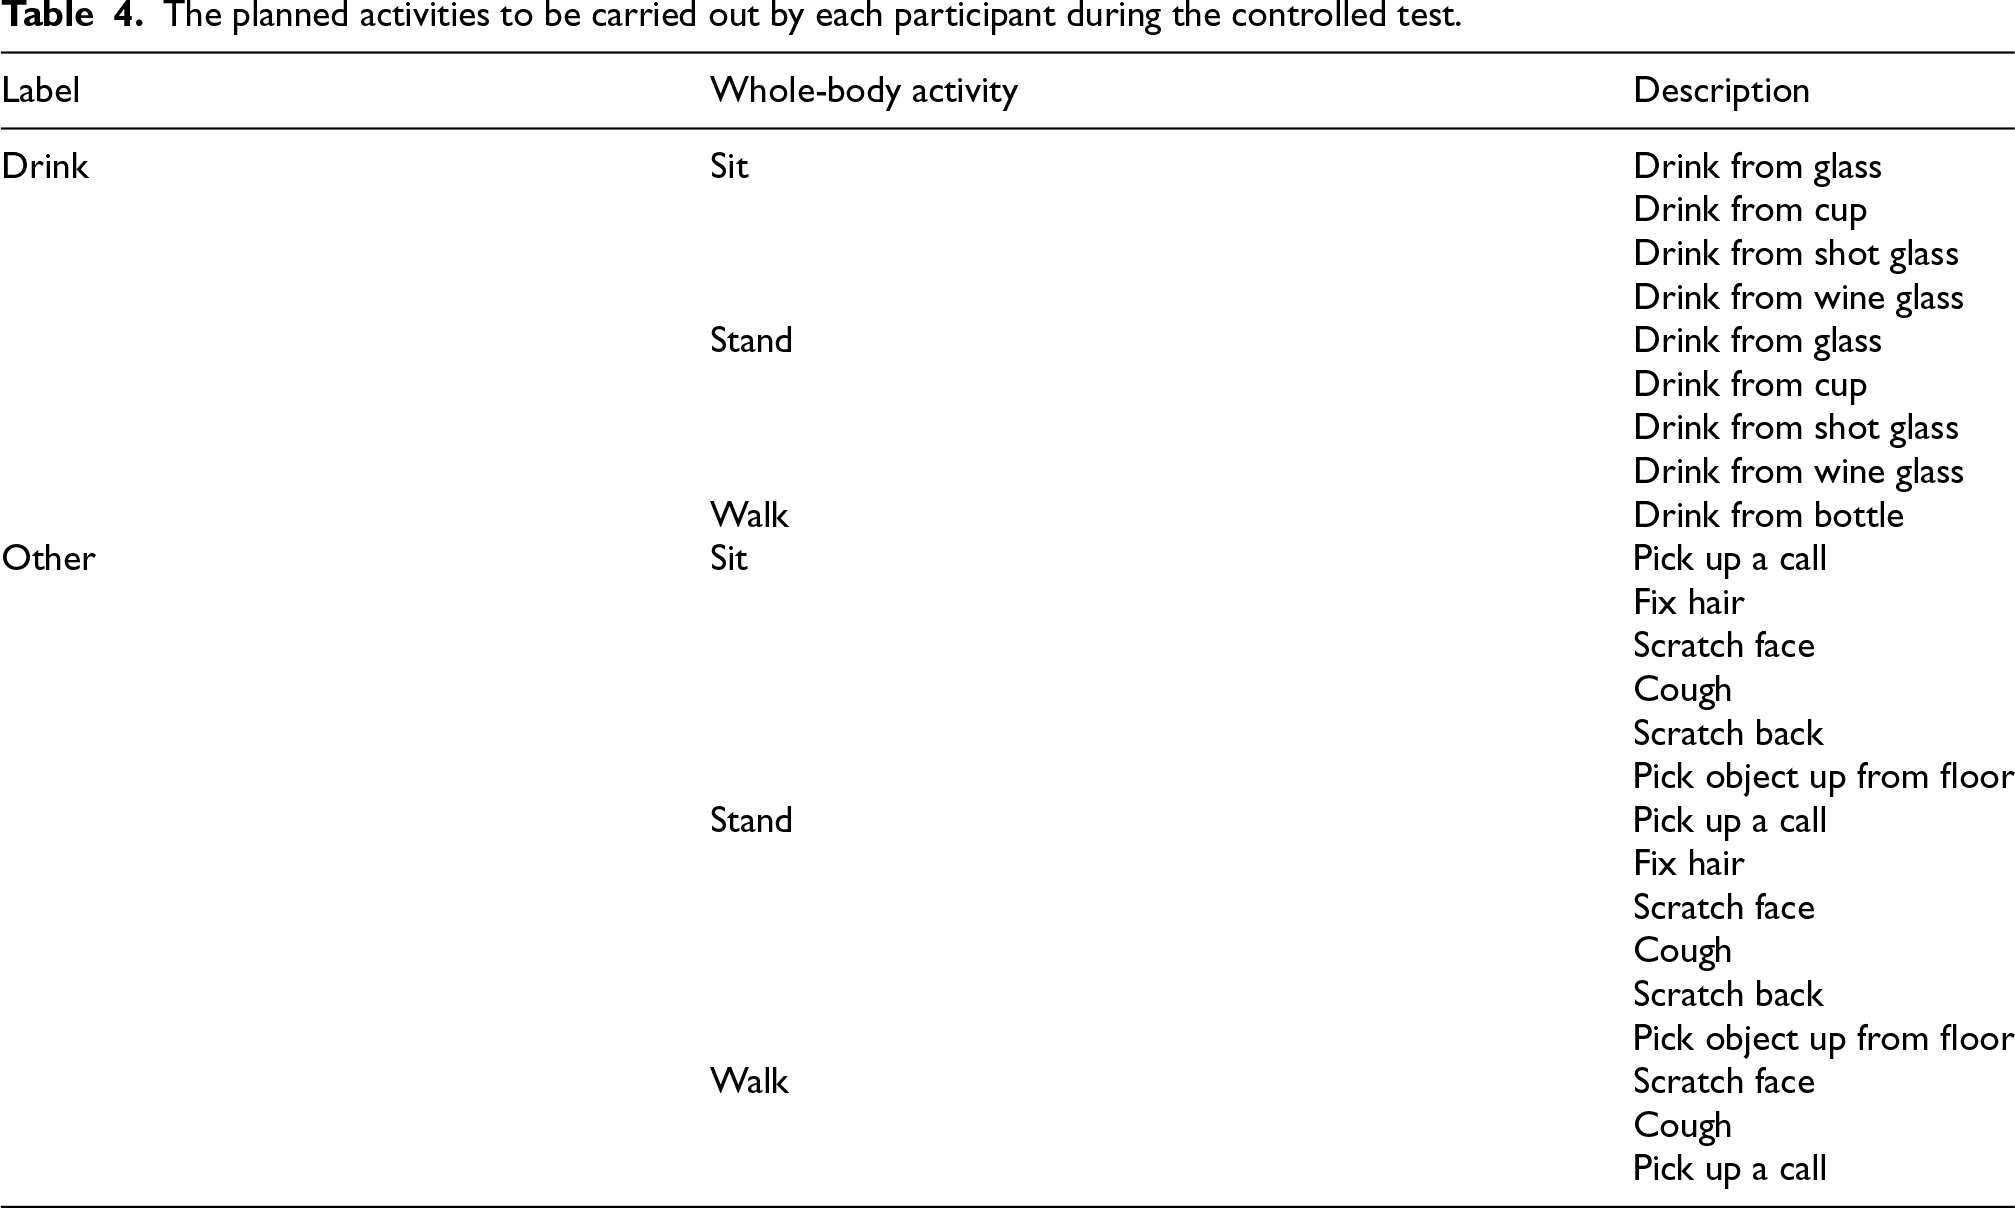
The planned activities to be carried out by each participant during the controlled test.
The wristband was loaded with the program described in Section 6. When analysing the results, we treated the set of four windows as one larger window. A larger window was labelled TP if at least one smaller window was labelled as drinking and coincided with a drinking activity. The same applies to false positives: if one smaller window was classified as FP, the larger window was also labelled as FP.
Using a BLE connection, the prediction results were sent from the wristband to the computer. The researcher added an activity code to the prediction results, visually evaluated each prediction and added the code TP, FN, TN or FP.
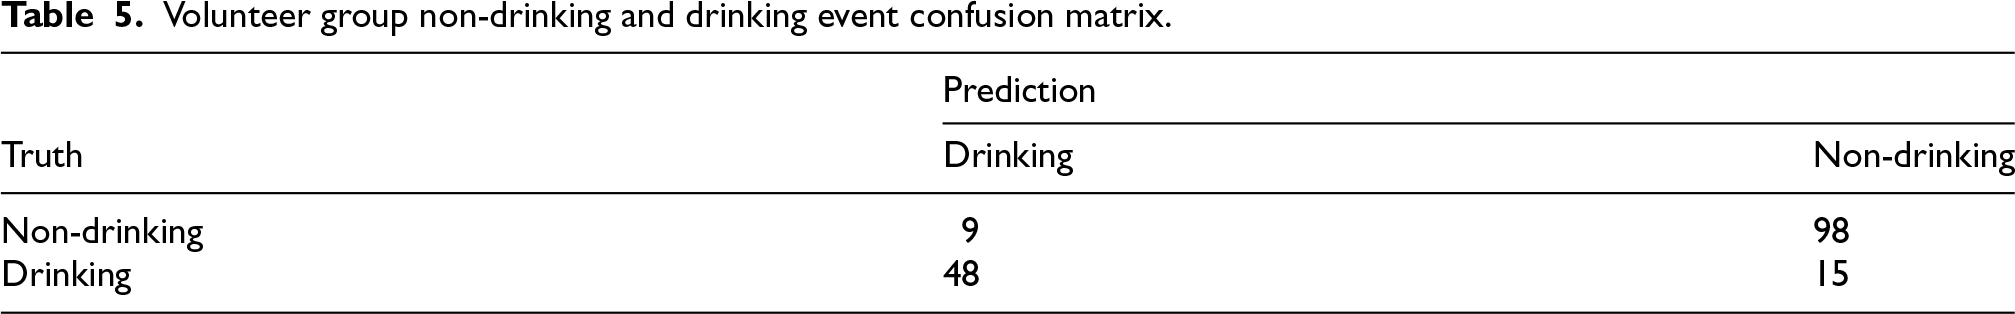
Table 5 shows the confusion matrix of non-drinking and drinking events for the volunteer group. It can be observed that our model easily identified non-drinking events with an accuracy of 91%. There were a few more false positives in drinking events. We observed that the model had a harder time recognising shorter drinking periods, which explains the false positive predictions when drinking from e.g., a shot glass. However, the model detected most drinking events with a recall score of 76% and a precision of 84%. Based on our observations, we can conclude that our model is better at detecting longer and more realistic drinking events. These are more important because they contribute more to fluid intake and thus hydration, which is what we are interested in.
Volunteer group non-drinking and drinking event confusion matrix.
We conducted a test under free-living conditions to predict the effectiveness of the method in meeting the challenges of unrestricted use in the real world. The results of this evaluation are related to a much looser protocol than previous evaluations, as there were no movement restrictions or external people controlling the process. The volunteers were very familiar with the smartphone-wristband system and interacted with the system without any problems. Therefore, it can be assumed that the movements performed were as natural as possible, which posed a greater challenge to the classifier and led to a small reduction in the performance metrics.
Three volunteers with a mean age of 22.6 ± 0.94 years, who had not participated in the previous data collection, were asked, after giving informed consent, to place the wristband on their dominant wrist and use it for 3 to 10 hours without restriction, depending on their availability. During this time, participants were asked to behave normally and drink water as often as possible. Each participant received a smartphone to which the model’s predictions were streamed via a BLE connection. Whenever the participant was drinking a beverage, he or she pressed a button on the wristband after completing a drinking motion to indicate that the drinking event was real. Thus, the user did not need to interact with the phone during the evaluation. This allowed the researcher to later observe the predictions saved on the phone and label them accordingly. An intermediate output of the model is a prediction value, which represents the probability that the processed event was a drinking event. If the prediction value was above 0.5 and was labelled by the user, it would receive a TP label. If it was below 0.5 and labelled by the user, it would receive a FN label. If the prediction value was above 0.5 and not labelled by the user, it would receive a FP label. If it was below 0.5 and not labelled by the user, it would receive a TN label.
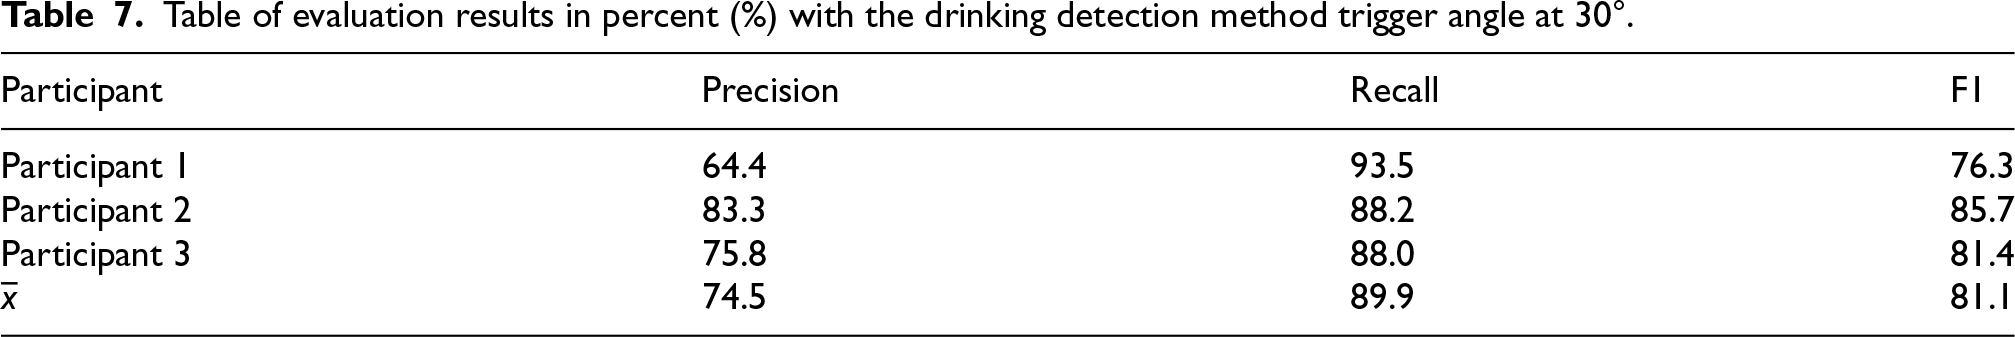
Since the participants went about their private life during the experiment, only very rough descriptions of what they were doing are available. All 3 participants started the experiment by going to work, where they performed a desk job, went to lunch and went home in the afternoon. Participant 1 additionally reported going to the gym. In Tables 6 and 7 we can see the results of the evaluation at two different trigger angles of the drinking detection method. At the smaller trigger angle, the results are worse due to a higher trigger sensitivity resulting in more false positive predictions. Some variation between the results can also be observed due to the different activities of the volunteers during the test, which consequently adds more or less false positive predictions. A particularly large drop in precision is noticeable in the case of participant 1, probably due to their visit to the gym.
Table of evaluation results in percent (%) with the drinking detection method trigger angle at 15°.
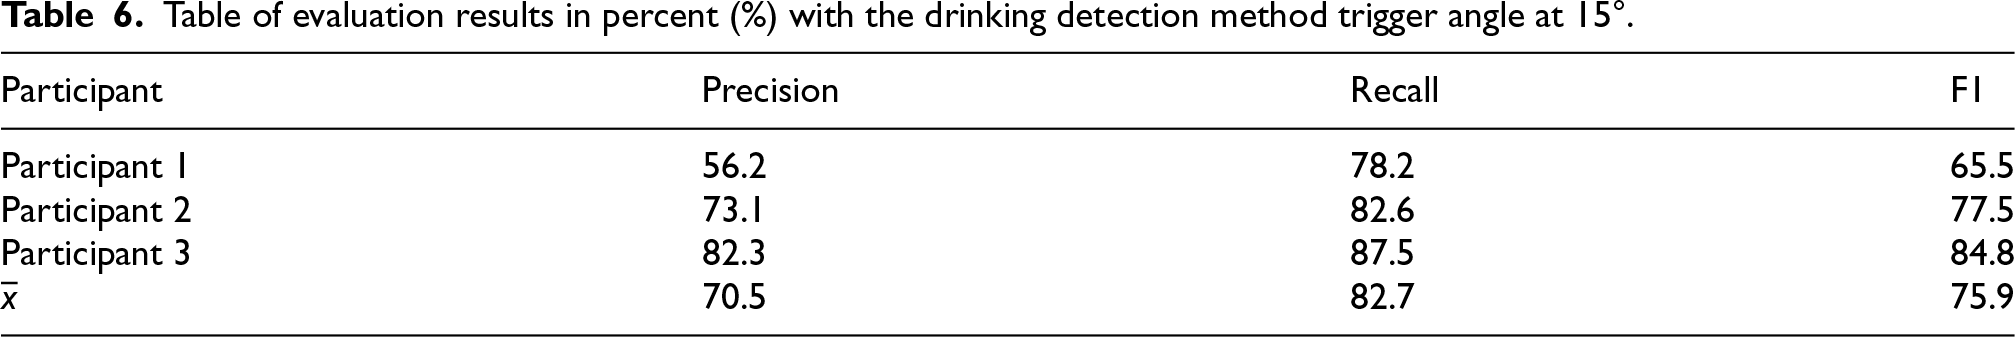
Table of evaluation results in percent (%) with the drinking detection method trigger angle at 15°.
Table of evaluation results in percent (%) with the drinking detection method trigger angle at 30°.
We performed power consumption measurements to assess the autonomous operation of the wristband. While some modern smartwatches, like the Amazfit GTR 3 Pro and Amazfit Bip, can achieve up to 45 days of battery life under specific conditions, it often involves sacrificing advanced functionalities for extended battery life [1,2]. In contrast, smartwatches with powerful processors and feature-rich operating systems tend to have higher power demands and may last only about a week on a single charge. Our wristband prioritizes maximizing battery life while retaining essential features. We achieve this by implementing power-efficient techniques, including minimizing the active time of the ML model and utilizing advanced sensor hardware features. Our goal is to strike a balance between functionality and battery life, ensuring long-lasting operation without frequent charging, making our method commercially attractive.
For the power consumption analysis, we used the Power Profiler Kit II (PPK 2) power analyzer from Nordic Semiconductor and the associated Power Profiler software [24,26]. The power profiler was set to Source Meter Mode, which means that it behaves like a power supply, and at the same time measures the electric current through the device under testing. The device on which the measurements were made was a modified wristband, which had wires soldered to the battery contacts. Figure 7 shows the wristband connected to the PPK 2 and the debugger.

Demonstration of the connection of the wristband to PPK 2 and the debugger for consumption analysis.
It is important to note that the data transfer between the smartphone and the wristband was designed using the Nordic UART Service, which emulates serial communication via BLE. The use of other services for data transfer could further reduce or increase the power consumption.
First, we measured the power consumption needed to maintain the BLE connection. The wristband was running a basic program with the Nordic UART Service, and the microcontroller was in sleep state. Next, we took measurements during the three main stages of our method.
In the first stage, while waiting for activity to be detected, the system operates in the lowest power state. During this stage, the microcontroller remains in a sleep state, conserving energy and minimizing power consumption. In the second stage, the sample rate is increased, and the microcontroller is briefly awakened to enable the Absolute Wrist Tilt (AWT) detection, activate the FIFO buffer, and enable the gyroscope. Once these components are enabled, the microcontroller goes back to sleep while the IMU waits for the AWT event. Finally, when the FIFO buffer is full and the AWT event occurs, an interrupt is generated, activating the microcontroller. The microcontroller then starts processing the captured data from the FIFO buffer and initiates the computation of features. During the feature computation stage, the Floating-Point Unit (FPU) is activated to efficiently perform complex mathematical operations with improved precision and efficiency.
It was found that an average current of 28 μA was necessary to maintain the BLE connection between the phone and the wristband. Figure 8 shows the periodic current spikes that occur when packets are exchanged to maintain the connection. The connection interval can be set between 7.5 ms and 4 s. We experimentally determined that the best connection interval was between 300 ms and 1000 ms, as it allowed low power consumption and adequate response time for sending predictions. The connection interval is inversely proportional to the power consumption; therefore, we wanted an interval that allowed the application to be as responsive as possible while minimizing the power consumption.

Display of the power consumption of the BLE connection between the wristband and the smartphone.
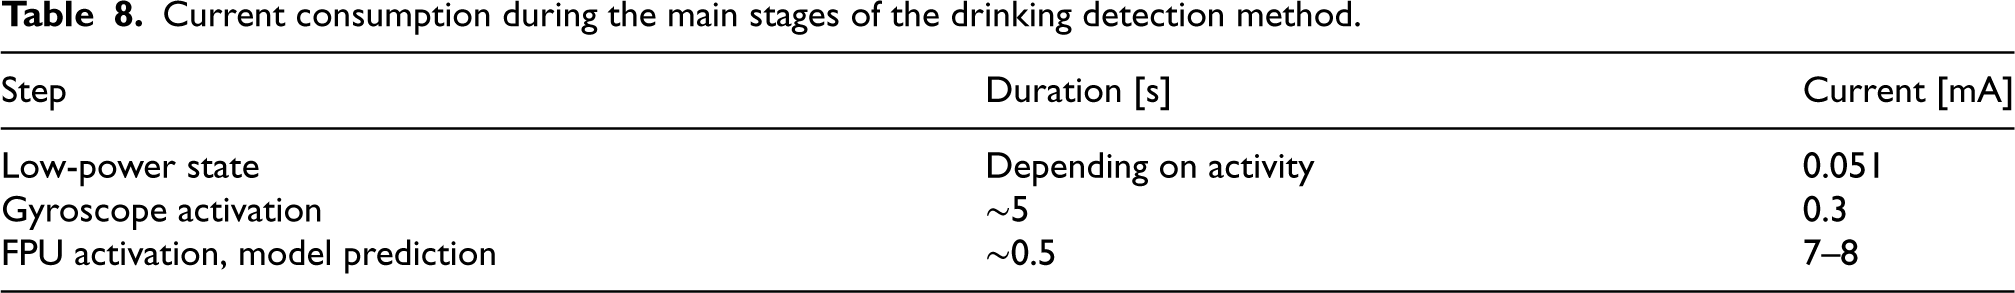
Figure 9 shows an example of the current consumption of the drinking detection method. In the sleep state, 51 μA was measured, with the accelerometer contributing about 10 μA. After activity was detected, the gyroscope was activated, and the current consumption increased to 300 μA. Finally, a peak of high-power consumption was observed due to FPU activation, feature calculation and model prediction. During this period an average current of 7–8 mA was measured. The whole process of data sampling into the FIFO buffer, feature calculation and model prediction consumed an average current of 773 μA. Current consumption during the most important stages of operation is summarized in Table 8.

Energy consumption display of the drinking detection method.
Current consumption during the main stages of the drinking detection method.
Based on these measurements, the introduction of a sleep state and triggered activation of the gyroscope reduces the baseline power consumption from 300 μA to 51 μA resulting in an approximately 5.8 times improvement in power consumption during the periods of inactivity, which does not directly translate into equal improvement of autonomy, but does contribute significantly towards it.
Estimating the autonomy of the wristband is a rather complex task, because power consumption depends on many external influences that cannot be predicted, including the user’s activity, connectivity issues, etc. However, based on the statistics of the performed real life experiments, one activity trigger event can be expected every 0.8 to 1.5 minutes during the day. Using these two edge values for the entire day and assuming no additional consumption due to other possible causes, the average daily consumption is expected to be between 211 μA and 352 μA, which would result in an autonomy of between 72 and 120 days using a 610 mAh battery. Since even less activity can be expected during the night, the autonomy would most likely be longer still. Even in the worst-case scenario, where the drinking detection method would operate continuously, the wristband would last 32 days without battery charging, making the wristband very competitive with commercially available smartwatches with regard to autonomy.
In this paper, we present a novel approach for detecting drinking events with a sensing wristband and ML. We presented the motivation for developing a method to detect drinking events and its application to elderly people or people with cognitive deficits.
For the purpose of the study, we collected a dataset containing labelled drinking events. We recorded drinking events using different containers, body postures and drinking lengths. For the negative class data, we used the dataset obtained during the eating classification research performed at IJS. The total duration of the dataset was 135 hours, of which 2 hours and 30 minutes corresponded to drinking activities. The dataset is publicly available and we hope that it will serve researchers in future research [9].We performed a wide range of computer-based and wrist-worn evaluations of our drinking detection approach. The best model was XGBoost with a precision of 94.3% and a recall of 88.3 % at a window length of 4.92 s and a 50 % overlap. We performed a test in a controlled environment with pre-defined drinking and non-drinking activities and achieved a precision of 84 % and a recall of 76 %. Finally, some volunteers wore the wristband throughout the day in free-living conditions, where the results were a precision of 74.5 % and a recall of 89.9 %. The performance of our approach is comparable to the related work, where the precision/recall in a controlled environment ranged from 83.6 %/87.3 % [14] to 97 %/97 % [13], and in free-living conditions from 81.7 %/77.5 % [14] to 84 %/85 %. The comparison can only be approximate, as these authors did not publish their datasets.
It should be noted that none of the related work featured drinking detection on an embedded device, so energy efficiency was not among their objectives. We described an energy-efficient implementation of the drinking detection method, which is our key contribution. Energy efficiency was achieved by exploiting the capabilities of the microcontroller on our wristband, as well as a threshold-based trigger that activated the ML process only when hand-to-head movements were detected. We estimated that in the worst-case scenario, where the drinking detection method is continuously triggered, the wristband could operate autonomously for up to 32 days. In the case where the method is triggered every 1.5 minutes, it could last up to 120 days.
Although the results shown in this study are promising, there are a few possible limitations of the presented work. As one of the main motivations, we stressed that the assessment of fluid intake is important for people with different health conditions, but the dataset used does not contain data from these categories of people. This is a limitation, as their drinking gestures may be different, which could lead to less accurate detection of drinking events. The differences may arise from certain health conditions as well as age, since older people tend to have slower gestures. This suggests that the reliability of the proposed method should be checked before applying it to these different categories of people.
Another limitation of the proposed method is the detection of very small amounts of fluid intake. The challenge arises as a consequence of the short duration of the activity and the relatively longer window. This leads to a calculated feature vector that is similar to non-drinking. However, drinking detection for typical drinking duration underperformed with shorter windows.
Yet another limitation of the proposed system is the use of only one wrist-worn device on the dominant wrist. There are situations where drinking gestures are performed with the non-dominant hand, in which it is very likely that the drinking event will not be detected. The easiest solution to this limitation is to use wrist devices on both wrists. However, this may be unacceptable for most people, although new trends and device developments may overcome this barrier.
Despite the limitations, the performance is good enough that we judge the method useful, and the energy consumption is quite low. We are currently exploring the integration of the described method with the software already running on the wristband to enhance its functionality.
Footnotes
Acknowledgements
The research described in this paper was a part of the CoachMyLife project, which received funding from the AAL programme (AAL-2018-5-120-CP) and the Ministry of Public Administration of Slovenia. It was also supported by the Artificial Intelligence and Intelligent Systems research programme (P2-0209) funded by the Slovenian Research and Innovation Agency.
We sincerely thank Caretronic for their generous support and provision of the wristband hardware, which has greatly contributed to the development and implementation of our system. Their partnership has been invaluable in enhancing the capabilities of our solution.
Conflict of interest
The authors have no conflict of interest to report.