Numerical simulation of dielectrophoretic separation of live/dead cells using a three-dimensional nonuniform AC electric field in micro-fabricated devices
Available accessResearch articleFirst published online May, 2015
Numerical simulation of dielectrophoretic separation of live/dead cells using a three-dimensional nonuniform AC electric field in micro-fabricated devices
BACKGROUND: The analysis of cell separation has many important biological and medical applications. Dielectrophoresis (DEP) is one of the most effective and widely used techniques for separating and identifying biological species.
OBJECTIVE: In the present study, a DEP flow channel, a device that exploits the differences in the dielectric properties of cells in cell separation, was numerically simulated and its cell-separation performance examined.
METHODS: The samples of cells used in the simulation were modeled as human leukocyte (B cell) live and dead cells. The cell-separation analysis was carried out for a flow channel equipped with a planar electrode on the channel’s top face and a pair of interdigitated counter electrodes on the bottom. This yielded a three-dimensional (3D) nonuniform AC electric field in the entire space of the flow channel.
RESULTS: To investigate the optimal separation conditions for mixtures of live and dead cells, the strength of the applied electric field was varied. With appropriately selected conditions, the device was predicted to be very effective at separating dead cells from live cells.
CONCLUSIONS: The major advantage of the proposed method is that a large volume of sample can be processed rapidly because of a large spacing of the channel height.
The separation and identification of cells from a biological sample are among the first crucial processes in many biomedical applications. Dielectrophoresis (DEP) is one of the most effective and widely used techniques for separating and identifying biological species [1–8]. DEP is the motion of a polarized but electrically uncharged particle in a suspension medium caused by the presence of a nonuniform electric field. The essential feature distinguishing dielectrophoretic effects from electrophoretic ones is that the former involve AC, rather than DC, electrical fields. The physical and electrical properties of the cell, the conductivity and permittivity of the suspension medium, as well as the gradient of the electric field and its applied frequency are substantial parameters determining a cell’s DEP response. The most prominent advantage of DEP over existing cell-separation methods is that the DEP force is strongly dependent on cell viability.
The key feature of the cell processing in clinical and biotechnological applications is the ability to discriminate and isolate target cells within their suspending medium rapidly and automatically. When the DEP devices are applied to the detection of, for instance, rare cancer cells in blood, the first step of the analysis would be filtering out and concentrating the small fraction (<0.001%) of abnormal cells including cancer cells [9]. After this step of the cell separation, further fractionation is still needed to discriminate finally the suspect cancer cells from normal cells. A similar situation occurs in water analysis that requires high fluid throughput and the ability to selectively concentrate pathogenic live bacterium from dead and inert ones.
Several approaches have demonstrated the ability of DEP to manipulate live and dead cells [10–15]. In those methods, electrodes inserted into a micro flow channel create an electric field that is distorted by the presence of insulating structures. Moreover, the regions where DEP forces work effectively are limited to sites within, at most, several tens of microns from the electrode surface in this type of DEP device. It is also difficult to utilize DEP for biological fluids because a highly conductive fluid easily causes joule heating and bubble formation in the extremely narrow spaces of micro channels [16,17]. In order to avoid the thermal effects that seriously damage cells, the electrodes are often placed in large reservoirs at the channel inlet and outlet. Without an additional channel for the concentrated sample, this could lead to the re-mixture of the sample after it has passed through a cell-separation region.
In the present study, a simple and effective technique is proposed to separate dead cells from live cells by DEP. A three-dimensional (3D) nonuniform AC electric field established in the entire space of a flow channel, even when the channel height is >0.1 mm, is utilized for the cell separation. For cell separation aimed at medical applications, the ideal device would be one that takes best advantage of the field gradient established in the channel to manipulate cells but without damaging the cells by joule heating. In this method, dead cells traveling in the channel are effectively separated from live cells by the presence of the 3D nonuniform electric field created in the whole region of the channel because the channel height can be much larger than the conventional DEP devices; about more than 10 times as large as that of the conventional ones, that can accomplish the rapid cell discrimination and isolation with a straightforward way. Another advantage of the proposed device is that a large volume (>several ml/min) of sample suspension can be processed rapidly without increasing the AC voltage to be applied. The excess flow-resistance and temperature increase caused by the narrow spacing of the channel height, those are the bottlenecks of the conventional type of DEP devices when the rapid process of a large volume of the sample is required, can also be avoided. Thus the proposed method is quite different from conventional ones, which utilize local field gradients generated at the immediate vicinity of the electrode surface for cell separation.
Numerical analysis
Mathematical model formulation
In the present study, cells dispersed in the suspension medium were assumed to be elastic spheres with diameter d and density . For cells in suspension medium with viscosity μ and density exposed to a nonuniform AC electric field, the motion of the cell i is described by the equation of motion where m is the mass of the cell, is the positional vector of cell i, the electro-mechanical force acting on cell i, and g the vector of the acceleration of gravity. The second term in the RHS, , is the Stokes drag force exhibited on cell i due to its motion relative to the suspension medium. The Stokes drag force, , acting on cell i is given by where is the local fluid velocity of clear fluid evaluated at the center of cell i. The last term in Eq. (1) is the external force that arises due to the difference in densities between cell i and the suspension medium. The electro-mechanical force, , in Eq. (1) is given by the expression where is the long-range dipole–dipole interaction force acting between cells i and j, and is the DEP force induced on cell i resulting from the application of the nonuniform AC electric field. Force is derived from the expression where θ is the azimuthal angle between the field direction and the line connecting the two centers of a pair of cells i and j, and and are unit vectors parallel to the directions of the relative positional vector and θ, respectively. The value is the dipole–dipole interaction potential between cells i and j, denoted by where the dipole moment of cell i, , is defined as and the term of the DEP force, , is expressed by where is the real part of the Clausius–Mossotti factor [18]: between the cell and the suspension medium, ∇ is the Nabla operator and is the AC electric field at position . Values , and are the vacuum permittivity, the relative dielectric permittivity of the suspension medium (distilled water; , at room temperature), and the relative dielectric permittivity of the cell, respectively, and the superscript “” means that the value is a complex number. The complex value of permittivity is defined as: where σ is the electric conductivity of materials, ω is the angular frequency, and . The relative dielectric permittivity of the medium used was .
The force acting on a single cell was evaluated by summing the dipole–dipole interactions and DEP forces acting on the corresponding cell. The dipole–dipole interaction was established by the surrounding polarized cells. Equation (3), omitting terms of higher orders of multipolar expansions that are directly amenable to intercellular force determination, serves to approximate the total force on cells because the field polarity reversals of the AC electric field are too rapid for any cell’s response. The frequency dependence of the higher-order force components is also a minor contribution because the field frequency in the present study is high enough to allow us to ignore the effects of corresponding forces. The DEP force, Eq. (7), is a force proportional to , the real part of the Clausius–Mossotti factor, Eq. (8), and to the spatial nonuniformity of the electric field, . This force causes cells to move toward strong or weak electric field regions in accordance with whether is positive or negative, reflecting whether the cells polarize more or less than their suspending medium in the applied field. Therefore, it allows cells to be attracted to or repelled from electrode edges. The difference of the dielectric property between live and dead cells is caused by the difference of the conductivity of cell membranes between them. When a cell dies, the cell membrane becomes permeable and its conductivity can increase significantly due to the cell contents exchanging freely material with the external medium. In addition, the sign and magnitude of the DEP force depends strongly on the field frequency, allowing DEP to be utilized in the cell isolation.
Schematic illustration of proposed DEP flow channel, dimensions of the computational “unit volume” (dashed lines), and the distribution of the strength of the nonuniform AC electric field () over a cross-section of the unit volume. The spatial resolution of the electric field was one-fourth of the cell diameter, d. The value of the electric field strength is normalized to that of the average value. The positions of the electrodes at the bottom and top faces are also indicated.
Cell-separation channel structure and setup
Figure 1 is a schematic illustration of the DEP flow channel and the distribution of the strength of the nonuniform AC electric field (). The top face of the channel is supposed to be a planar transparent glass electrode that allows the transient behavior of suspension in the channel to be clearly observed. On the bottom face of the channel, linear and flat interdigitated counter electrodes (0.125 mm wide) are installed in parallel at 0.125 mm intervals in the lateral (y) direction. The planar glass electrode and grounded electrodes at the bottom are electrically connected and grounded. The electrodes at the top and bottom create a 3D nonuniform electric field having extremely steep field gradients around the edges of the electrodes at the bottom while establishing a zone of a mild field gradient along the flow direction at the vertical position slightly below the centerline of the channel. This establishes a 3D nonuniform electric field extending the full height of the channel. The cells used in the numerical simulation are modeled as live and dead B cells with a mean diameter [19]. The cell density is assumed to be . An AC field with a root mean square (r.m.s.) voltage of at frequency is applied between high-voltage electrodes and grounded electrodes. This frequency was chosen so as to induce the distinctive DEP responses between live and dead cells for effective cell separation. The real part of the dielectric mismatch factors between the live cell and the suspension medium (supposed to be an isotonic solution of sucrose), and that between the dead cell and the suspension medium used, were and at , respectively [20].
Numerical analysis procedure
To conserve computation resources, simulations were performed in a rectangular unit volume, as indicated by the dashed lines in Fig. 1. The unit volume measures . The height of the unit volume taken was identical to the channel height. In this unit volume, the flow of suspension in the channel is laminar (Reynolds number, (: mean velocity, h: channel height) is on the order of ) and is fully developed [21], and the cross section of the channel is rectangular, with a high aspect ratio. Therefore, it can be assumed that the velocity profile has only a single component, u, with velocity in the x direction; this is described as the two-dimensional Poiseuille flow of the function of the z coordinate only where Q, A, are the volumetric flow rate of the suspension, the cross-sectional area of the unit volume, and the nondimensional z coordinate normalized to the channel height, h, respectively. The Stokes drag force acting on a cell was evaluated using the flow velocity at the center of the cell through Eq. (2). To measure the effect of the drag forces present between clustered cells at the electrodes on the bottom face, the corresponding effect was not taken into account in the model. Because the flow velocity is quite low near the wall surface of the channel, where cells closely accumulate, drag forces between cells are thought to have a secondary effect on the movement of cells, whereas the dominant driving forces in this case are the DEP force and dipole–dipole interaction among cells. For the governing equations, a periodic boundary condition (B.C.) was applied over x–z planes on both lateral sides of the unit volume, perpendicular to both the channel top and bottom faces. At the inlet boundary of the unit volume, a cell leaving the unit volume through the outlet boundary was replaced by another cell that simultaneously entered the unit volume through the inlet boundary at the position with the same y and z coordinates as those of the departing cell. Once a cell reached the edges of the high-voltage electrode at the bottom where the field gradient peaked, it was regarded as trapped and its further displacement along and away from the bottom surface was not allowed.
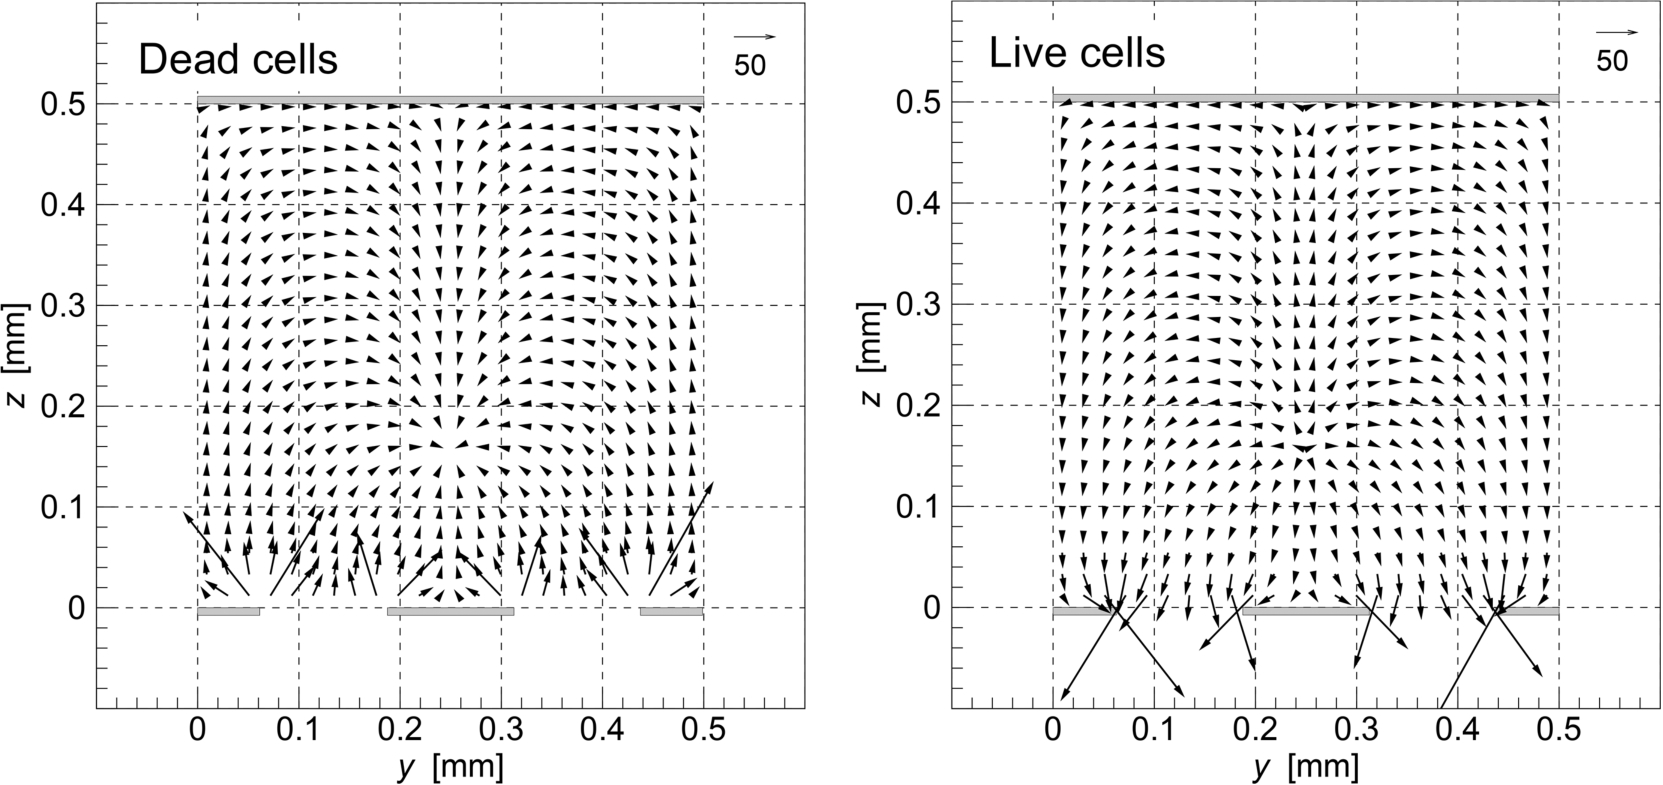
For the electric field distribution in the unit volume, since there is no variation along the flow direction, the two-dimensional electric field approximation in a y–z plane was adopted. At the beginning of the numerical computation, the Laplace equation of the two-dimensional electric potential distribution over the cross section in the y–z plane was solved using a finite difference method. The sizes of the finite difference mesh used in the electric field computation in the y and z directions were . As the electric field was symmetric about the vertical plane of symmetry in the unit volume along the flow direction, only the electric potential in half of the symmetry area was computed under the boundary condition of on the corresponding plane of symmetry. The number of grids of the numerical mesh was 84 (half of the symmetry) and 168 in y and z directions, respectively. Forces in Eq. (3) were calculated using the converged solution of the electric field distribution. The right-bottom panel in Fig. 1 shows the distribution of the strength of the electric field, , in a cross-sectional area of the flow channel. Field strength peaks at the edges of the high-voltage electrodes at the bottom face, whereas it is lowest at a height of ∼0.2 mm right above the center of the grounded electrode at the bottom face. Figure 2 shows the force field distributions indicated by force vectors induced on (left) dead cells having negative DEP properties and (right) live cells having positive DEP properties under exposure to the nonuniform AC electric field at . The force vectors were drawn on the representative grid points of the numerical grid for clear visibility. The dead cells are likely to move toward the center area due to the presence of mild attractive forces directed to this area and, in turn, to experience strong repulsive forces against the electrode at the bottom, while very strong attractive forces toward the electrodes at the bottom face are induced on live cells when they approach the bottom face.
Force field distributions indicated by force vectors induced on (left) dead cells having negative DEP properties and (right) live cells having positive DEP properties under exposure to nonuniform AC electric field. The force vectors were drawn at the representative grid points of the numerical grid for clear visibility. The positions of the electrodes at the top and bottom faces are also indicated.
Numerical simulations were conducted for a fixed number of cells. In the initial state, cells were randomly distributed in a small region at the upstream end of the unit volume. The number of cells was determined by the value of the volume fraction of cells, φ, in this small region. In performing the numerical simulation, a modified BBK method [22,23] was used. For the numerical integration of Eq. (1), the time step of , which ensures that both the cell trajectory and the average kinematic energy of all the cells become independent of the size of the time step, was used for the transient simulations. The shifted-force version of the usual electrostatic potential was used for the wall-cell and intercellular force calculations to prevent cells from overlapping or running through each other or the channel walls. The shifted-force potential and its first derivative go to zero continuously at the cutoff radii of and for wall-cell and intercellular repulsive interactions, respectively. To determine the dipole–dipole interaction energy, the value of cutoff , which ensures that the value of the potential decreases to less than of its value at the cell surface (), was applied. To calculate the total electromechanical forces acting on the cell, the periodic BC was also applied to cells located by planes of the periodic boundary to eliminate the boundary’s surface effect. The computer program was parallelized and computations were performed on clusters of the National Defense Academy of Japan.
Numerical simulations of Al2O3 particles (positive DEP property) suspended in corn oil were compared with the experiment. The figure shows the time course of the fraction (percentage) of the particles reaching the edges of the high-voltage or grounded electrodes with two applied voltages. The suspension was static (in the absence of liquid flow), and the volume fraction of the particle was .
To validate the simulation code, numerical simulations of Al2O3 particles (positive DEP property) suspended in corn oil were compared with the experiment [24]. Figure 3 shows the time course of the fraction (percentage) of the particles that reached the edges of the high-voltage or grounded electrodes for two applied voltages. The suspension is static (in the absence of liquid flow), and the volume fraction of the particle is . The time scale is normalized to the representative time [25]
The symbols indicate the experimental data, while the solid and dashed lines indicate the computational data. The results of the numerical simulations were the averaged values of six computation batches with six different initial configurations of particles, whose x, y, z coordinates were generated using six different sets of random numbers. The standard deviations of the computed values were less than 5% of their mean values. Most of the particles begin to move toward the electrodes immediately after the application of the electric field. The number of particles attaching to the edges of the high-voltage electrodes is greater than that of grounded electrodes because the gradient of the electric field is highest at the edges of high-voltage electrodes. This causes the difference in the number of attached particles. Numerical prediction shows good agreement with the experimental results.
Results and discussion
In the numerical simulation, the volume fraction of the cell in the small region, φ, was fixed as . The fraction of the dead cells in the mixed suspension was set to 5%. The mean velocity of the Poiseuille flow of the cell suspension in the unit volume was set to , where h is the channel height. Thus the Reynolds number is . The strengths of the r.m.s. of the applied voltage were chosen as , and 20 V.
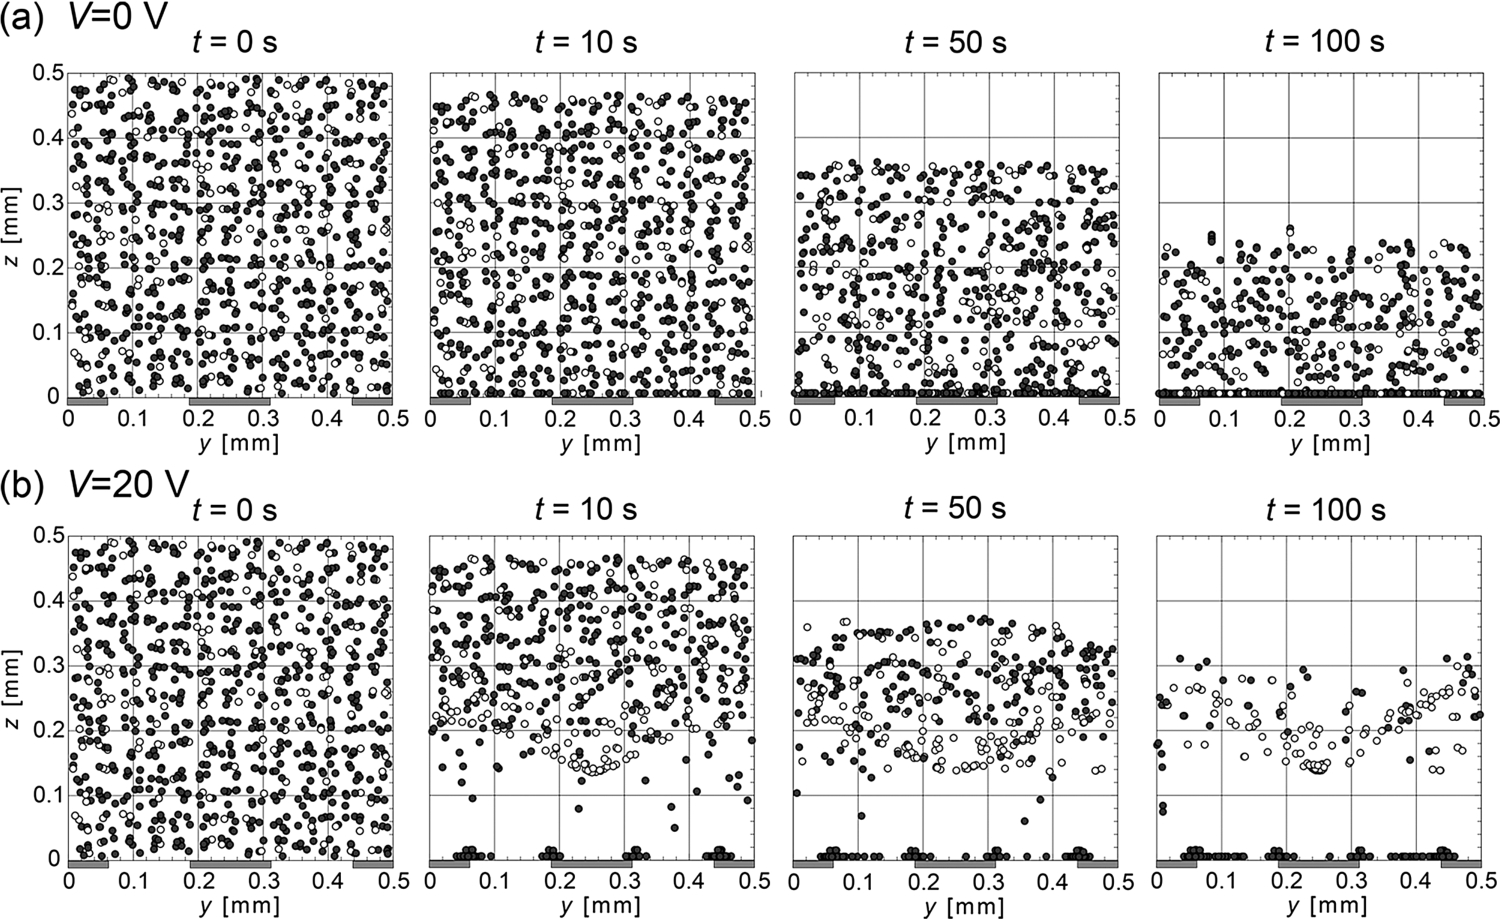
Time evolutions of the distribution of cells traveling through the unit volume with the applied voltages of (a) (no electric field application) and (b) .
Figure 4 shows the transient distribution of cells traveling through the unit volume with the applied voltages of (a) (no electric field application) and (b) . The closed circles and the open circles in the figure are the live and dead cells, respectively. For the case of no electric field application (top panel (a)), the cell suspension simply moved toward the downstream of the unit volume with the velocity distribution of a fully developed Poiseuille flow, and gradually settled down as the cells traveled through the unit volume. However, for the case of (bottom panel (b)), the live cells in the suspension, having positive DEP property, began to migrate downward and to attach to the electrodes at the bottom face due to the presence of the attractive forces induced on the edges of the electrodes. The dead cells, having a negative DEP property, began to gradually concentrate in the site slightly below the longitudinal centerline of the unit volume, where the electric field gradient took the minimum. Finally, most of the live cells were trapped on the edges of electrodes at the bottom surface where the DEP force is highest. Dead cells traveling in the direction of the flow were further concentrated into the narrower spot of the minimum field gradient. This implies that dead cells can be effectively separated from live cells by the use of the proposed DEP channel device.
Time variation of the distribution of cells traveling through the unit volume viewed from the downstream end toward the upstream end at times (a) 0 s, (b) 10 s, (c) 50 s and (d) 100 s. The applied voltage was . Closed and open circles indicate live and dead cells, respectively. The positions of electrodes at the bottom face are also indicated.
Figure 5 shows the time variation of the distribution of cells in the unit volume viewed from the downstream end toward the upstream. The closed and open circles are the live and dead cells, respectively, and the positions of electrodes at the bottom are indicated. The applied voltages were (a) (no electric field application) and (b) . When no electric field was applied (top panel (a)), all the cells distributed in the unit volume gradually and simultaneously settled down with time regardless of the cell’s DEP property. When the voltage of was applied (bottom panel (b)), in the first 10 seconds of the field application the live cells that had initially distributed within the lower half of the unit volume immediately moved down to the bottom face, where strong attractive DEP forces were present on the edges of electrodes at the bottom face. The rest of the live cells that had initially distributed in the upper half gradually settled down due to the gravitational force, because the magnitude of the electro-mechanical force is smaller than that of the gravitational force in the upper-half site of the unit volume (see Fig. 2). Subsequently, the live cells were attracted downward and finally attached to the edges of the electrodes at the bottom face. Dead cells that had begun to move down in earlier stages after the application of the electric field were soon lifted upward by the repulsive DEP forces induced at the electrodes on the bottom face. Consequently, dead cells traveling through the unit volume were accumulated at the site where the electric field gradient is lowest. Finally, most of the live cells were captured on the edges of electrodes at the bottom face while the dead cells, which continued to travel through the channel, were gradually accumulated at the particular site and separated from the live cells until .
Snapshots of the distribution of cells traveling through the unit volume, viewed from the downstream end toward the upstream, at time 100 s for four applied voltages: (a) , (b) , (c) and (d) . Closed and open circles indicate live and dead cells, respectively. The positions of electrodes are illustrated at the bottom face.
Figure 6 shows snapshots of the distribution of cells traveling through the unit volume, viewed from the downstream end toward the upstream at for four applied voltages: (a) , (b) , (c) and (d) . It is found that the cell-separation ability of the proposed device depends simply on the strength of the applied electric field. The 3D nonuniform electric field lifted dead cells from the bottom face and sustained them in the middle of the unit volume at a height slightly below the centerline, while the most of the live cells were captured at the bottom face. The dead cells were concentrated in a narrower region as the magnitude of the applied field strength increased. It is interesting to note that the height of the site where the dead cells aggregated varies with the horizontal (y) position across the width of the unit volume. At around the center space (), the dead cells were lifted by the DEP repulsive force; however, at both ends of the width ( and 0.5 mm), the dead cells stayed at higher vertical positions than those in the center region (). This is because the Stokes drag force is only the dominant force to sustain the dead cells traveling near both side boundaries (vertical planes along the centerlines of the high-voltage electrodes on both ends in the figure) upward. Moreover, the negative DEP forces that drive dead cells upward and sustain them at the vertical position in the center region () are weakened around these sites. However, there were still quite number of live cells in the center of the channel. The primal reason is that most parts of the cell-attraction sites (edges of electrodes at the bottom face) were occupied by other live cells in earlier stage of the electric field application. Live cells those could not attach the bottom face bounced upward as soon as they touched down the bottom face, and then they moved to the center region of the channel which were subjected to the mainstream velocity.
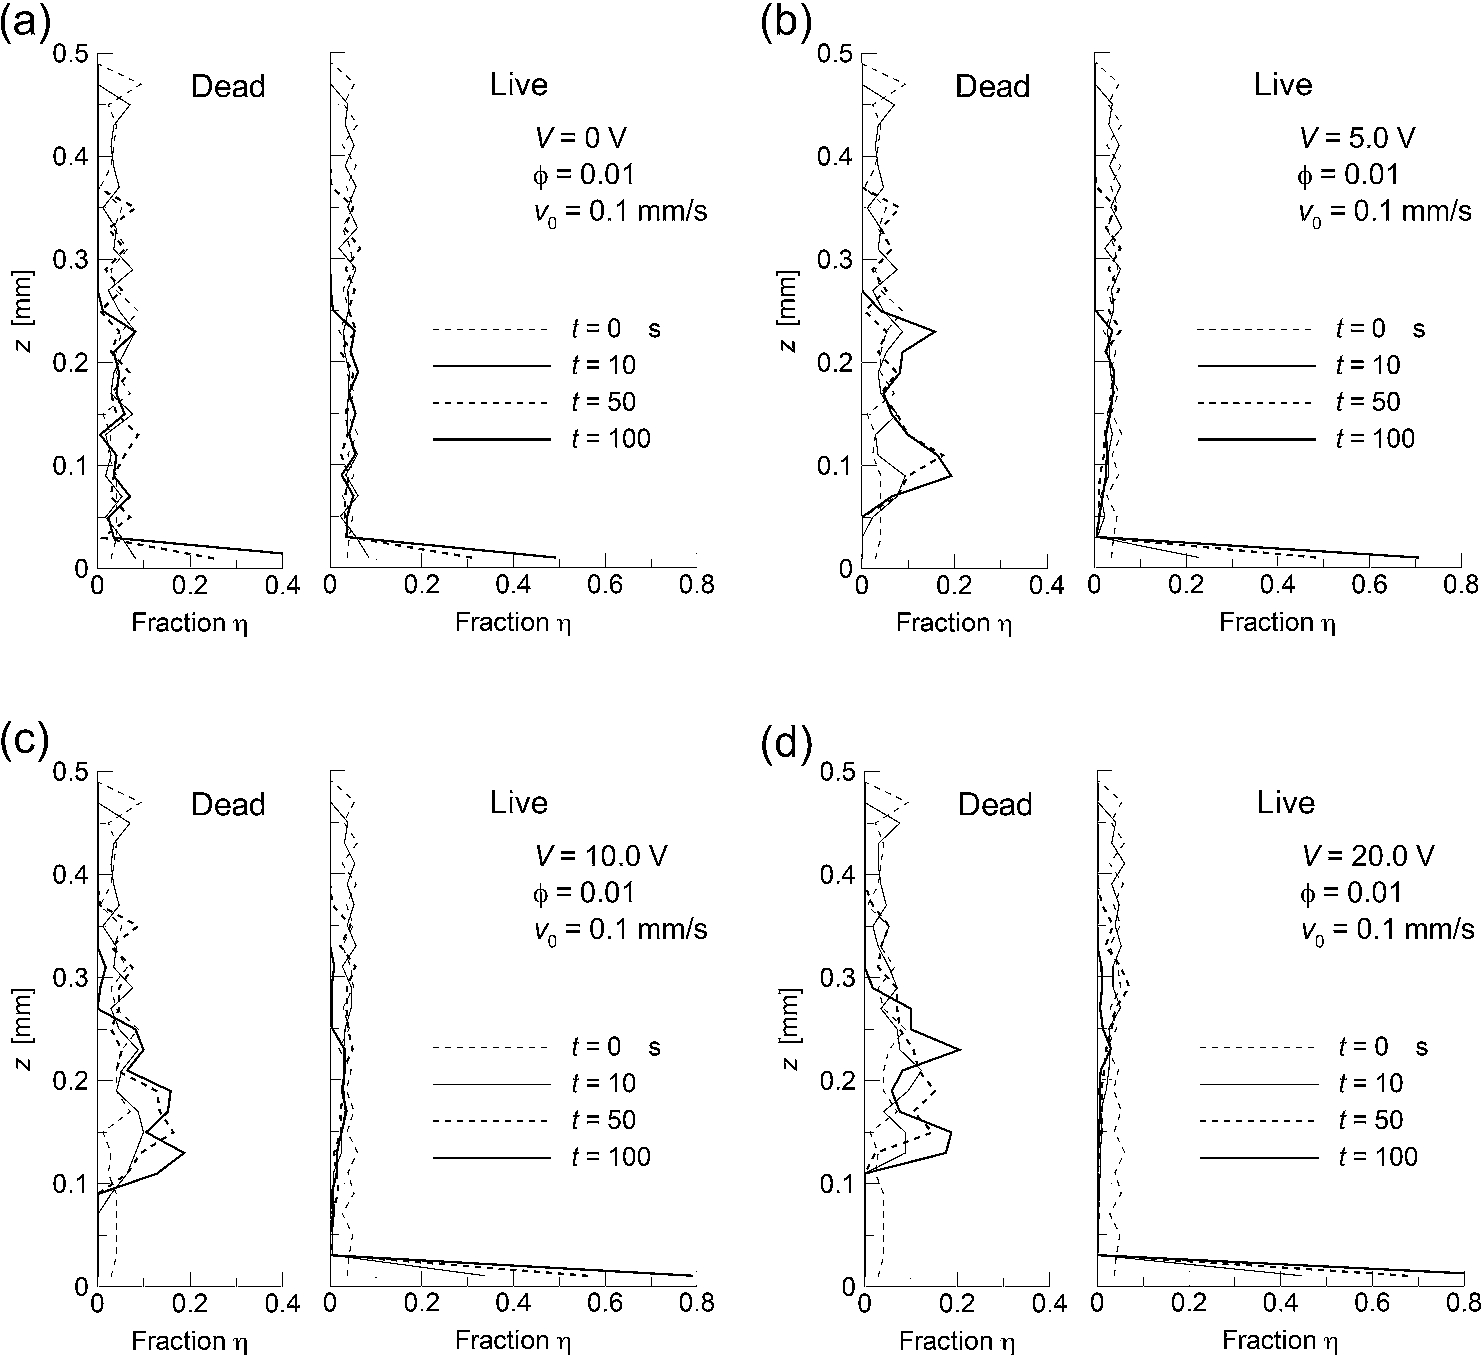
Relationship between the time course of the fractions of the number of cells, η, and the vertical position of the live (right) and dead (left) cells in the unit volume, z, for four field strength: (a) , (b) , (c) and (d) . The numbers of live and dead cells are normalized to the total number of respective cells.
Figure 7 shows the relationship between the time course of the number of cells, η, and the vertical positions of the live (right) and dead (left) cells in the unit volume, z, for four applied voltages: (a) , (b) , (c) and (d) . The value of η is defined as:
For higher applied voltages, most of the dead cells were concentrated within the region . The vertical position of corresponds to the height of the longitudinal centerline of the unit volume where the flow velocity is highest. During the time evolution of the dead cell distribution, two peaks of η appeared at the vertical positions and 0.25 mm. This phenomenon can be explained as follows. In a cross section of the unit volume, the dead cells travel faster at around , where the Poiseuille flow profile peaks. Simultaneously, they also laterally migrated toward where the electric field gradient is lowest: the vertical position of . This implies that there exist two cell-focusing sites in a cross section of the unit volume for the dead cells. The dead cells changed their positions between these two sites alternately while they traveled through the unit volume (not shown). The live cells gradually settled down with time. However, very few live cells () traveling in the upper-half region of the unit volume continued to levitate in the upper-half region, since the presence of the very weak attractive force induced on the top face (the grounded electrode) lifted them.
Relationship between the time course of the distributions of the flow velocity of cells, v, and the vertical position of the live (right) and dead (left) cells in the unit volume, z, for four applied voltages: (a) , (b) , (c) and (d) .
Figure 8 shows the relationship between the time course of the distributions of the cell flow velocity, v, and the vertical positions of the live (right) and dead (left) cells in the unit volume, z, for four applied voltages: (a) , (b) , (c) and (d) . When the electric field was not present (panel (a)), both the live and dead cells gradually settled down at a constant sedimentation velocity, both of them while moving axially at a velocity of less than about 0.005 mm/s, ∼1/20 of the local velocity of the pure fluid, associated with the parabolic axial flow profile. However, the transient variation of both the magnitude and the profile of the flow velocity of dead cells showed significantly different features from those of live cells due to the presence of the electric field. The dead cells were accelerated in the flow direction with time as they gradually concentrated at the site of the minimum field gradient. This acceleration of the axial velocity of a dead cell was caused by the elimination of forces acting on the dead cell in the vertical direction. The gravitational force acting on the dead cell was canceled by the lift force due to the negative DEP effect. Therefore, most of the dead cells traveled faster through the unit volume with their vertical positions maintained at around the site where the minimum electric field gradient was achieved; simultaneously, this site was close to the site of the maximum axial velocity of the parabolic flow profile. Thus the dead cells that continued to levitate at the corresponding site were further accelerated while others, staying outside this site, were decelerated due to the hydraulic drag force in the vertical direction during their migration downward (sedimentation) or upward (lifting due to the repulsive DEP force) in the unit volume.
Concluding remarks
The present study has numerically predicted the ability of the proposed DEP device to selectively concentrate specific cells from diverse populations through the separation of nonviable (e.g., tumor or dead) cells from a sample containing both viable (e.g., healthy or live) and nonviable B cells. The proposed flow-channel-type DEP device consists of a planar electrode on the top face, and an array of narrow, linear interdigitated electrodes on the bottom face, thus creating a three-dimensional nonuniform AC electric field throughout the entire space of the flow channel. The results demonstrated that the DEP cell separation by the use of the three-dimensional nonuniform AC electric field selectively concentrated nonviable cells in the trapping site where the electric field gradient was lowest, while viable cells were trapped over the surfaces of electrodes on the bottom face. The proposed device has the potential for use in cell sample isolation as well as disease detection and treatment, along with other microfluidic applications.
References
1.
DemircanYÖzgürEKülahH. Dielectrophoresis: Applications and future outlook in point of care. Electrophoresis. 2013;34:1008–1027.
2.
KhoshmaneshKNahavandiSBaratchiSMitchellAKalantar-zadehK. Dielectrophoretic platforms for bio-microfluidic systems. Biosens Bioelectron. 2011;26:1800–1814.
3.
KarimiAYazdiSArdekaniAM. Hydrodynamic mechanisms of cell and particle trapping in microfluidics. Biomicrofluidics. 2013;7:021501.
4.
HultgrenATanaseMChenCSMeyerGJReichDH. Cell manipulation using magnetic nanowires. J Appl Phys. 2003;93:7554–7556.
5.
GrayDSTanJLVoldmanJChenCS. Dielectrophoretic registration of living cells to a microelectrode array. Biosens Bioelectron. 2004;19:1765–1774.
6.
LeuTSLiaoZF. Separating plasma and blood cells by dielectrophoresis in microfluidic chips. Intl J Mod Phys Conf Ser. 2012;19:185–189.
7.
HungSHHuangSCLeeGB. Numerical simulation of optically-induced dielectrophoresis using a voltage-transformation-ratio model. Sensors. 2013;13:1965–1983.
8.
PethigR. Dielectrophoresis: Status of the theory, technology, and applications. Biomicrofluidics. 2010;4:022811.
9.
GascoynePRCVykoukalJV. Dielectrophoresis-based sample handling in general-purpose programmable diagnostic instruments. P IEEE. 2004;92:22–42.
10.
GascoynePRCWangXBHuangYBeckerFF. Dielectrophoretic separation of cancer cells from blood. IEEE Trans Ind Appl. 1997;33:670–678.
11.
LiHBashirR. Dielectrophoretic separation and manipulation of live and heat-treated cells of Listeria on microfabricated devices with interdigitated electrodes. Sensors Actuators B. 2002;86:215–221.
12.
HensleeEASanoMBRojasADSchmelzEMDavalosRV. Selective concentration of human cancer cells using contactless dielectrophoresis. Electrophoresis. 2011;32:2523–2529.
13.
PatelSShowersDVedantamPTzengTRQianSXuanX. Microfluidic separation of live and dead yeast cells using reservoir-based dielectrophoresis. Biomicrofluidics. 2012;6:034102.
14.
ShafieeHSanoMBHensleeEACaldwellJLDavalosRV. Selective isolation of live/dead cells using contactless dielectrophoresis (cDEP). Lab Chip. 2010;10:438–445.
15.
ShimSStemke-HaleKTsimberidouAMNoshariJAndersonTEGascoynePRC. Antibody-independent isolation of circulating tumor cells by continuous-flow dielectrophoresis. Biomicrofluidics. 2013;7:011807.
16.
KangYLiDKalamsSAEidJE. DC-dielectrophoretic separation of biological cells by size. Biomed Microdevices. 2008;10:243–249.
17.
GielenFPereiraFdeMelloAJEdelJB. High-resolution local imaging of temperature in dielectrophoretic platforms. Anal Chem. 2010;82:7509–7514.
18.
JonesTB. Electromechanics of particles. New York: Cambridge Univ. Press; 1995. p. 34–48.
19.
MonroeJGCambierJC. Sorting of B lymphoblasts based upon cell diameter provides cell populations enriched in different stages of cell cycle. J Immunol Methods. 1983;63:45–56.
20.
OhtaAT. Optofluidic devices for cell, microparticle, and nanoparticle manipulation [PhD thesis]. Berkeley, CA: University of California; 2008.
21.
SchlichtingH. Boundary-layer theory. New York: McGraw-Hill; 1979. p. 185–187.
22.
BrüngerABrooksCLIIIKarplusM. Stochastic boundary conditions for molecular dynamics simulations of ST2. Chem Phys Lett. 1984;105:495–500.
23.
TadaSNatsuyaTTsukamotoASantoY. Contactless cell trapping by the use of a uniform AC electric field. Biorheol. 2013;50:283–303.
24.
QiuZYMarkarianNKhusidBAcrivosA. Positive dielectrophoresis and heterogeneous aggregation in high-gradient AC electric fields. J Appl Phys. 2002;92:2829–2843.
25.
KumarAKhusidBQiuZYAcrivosA. New electric-field-driven mesoscale phase transitions in polarized suspensions. Phys Rev Lett. 2005;95:258301.