
Abstract
Background:
Fluid flow plays an important role in vascular development. However, the detailed mechanisms, particularly the link between flow and modulation of gene expression during vascular development, remain unexplored. In chick embryo, the key events of vascular development from initiation of heart beat to establishment of effective blood flow occur between the stages HH10 and HH13. Therefore, we propose a novel in vivo model to study the flow experienced by developing endothelium.
Objective:
Using this model, we aimed to capture the transcriptome dynamics of the pre- and post-flow conditions.
Methods:
RNA was isolated from extra embryonic area vasculosa (EE-AV) pooled from three chick embryos between HH10–HH13 and RNA sequencing was performed.
Results:
The whole transcriptome sequencing of chick identified up-regulation of some of the previously well-known mechanosensitive genes including NFR2, HAND1, CTGF and KDR. GO analyses of the up-regulated genes revealed enrichment of several biological processes including heart development, extracellular matrix organization, cell-matrix adhesion, cell migration, blood vessel development, patterning of blood vessels, collagen fibril organization. Genes encoding for gap junctions proteins which are involved in vascular remodeling and arterial–venous differentiation, and genes involved in cell–cell adhesion, and ECM interactions were significantly up-regulated. Validation of selected genes through semi quantitative PCR was performed.
Conclusion:
The study indicates that shear stress plays a major role in development. Through appropriate validation, this platform can serve as an in vivo model to study conditions of disturbed flow in pathology as well as normal flow during development.
Introduction
Normal vascular development is influenced by blood flow. The development of the cardiovascular system, kidneys and nervous system are highly dependent on blood flow [1–4]. The flow of blood imparts three stresses on the vessel wall, namely orthogonal blood pressure, the associated circumferential stretch and the frictional force called shear stress, which acts in parallel with the blood flow [5]. The flow exerts a mechanical force, whose magnitude is dependent on the blood viscosity, which is necessary and sufficient to induce vascular remodeling in the yolk sac of mouse embryos [6] and other developmental process.
Key events in the development of the cardiovascular system take place at very early stages of chick embryonic development. In the chicken, the development of the heart starts by Hamburger Hamilton (HH) stage 8 or embryonic day 2 and continues till stage HH 39 or day 13 [7]. However, the heart beats for the first time at 29th hour (HH11), when it exhibits an irregular pattern of beating that gradually becomes regular with an increase in the number of beats per minute. At this stage, area vasculosa (AV) consists of 1) AV membrane cells 2) vascular cells and 3) circulating blood cells. The capillary plexus network formation by endothelial cells occurs in the extra-embryonic region as the heart forms. At stage HH12, the excitation waves sweep forward from the caudal pacemaker leading to contraction of the muscle which in turn forms the cue for blood flow to begin [8]. However, the flow is irregular. During the transition to HH13 stage, regular circulation gets established between the embryo and extra-embryonic region.
Reports show that 3% of genes under investigation showed up- or down regulation by laminar shear stress in isolated human umbilical vein endothelial cells (HUVEC) [9]. Most of the shear responsive genes remained unaltered by stretch forces, suggesting endothelial cells discriminate in sensing shear and stretch forces [10]. Hogers et al. (1997) reported that ligation of right lateral vitelline vein resulted in serious intracardiac and pharyngeal arch artery malformations [11]. Connecting the gene expression pattern under disturbed shear conditions and cardiac development, it seems likely that changes in shear stress alter gene expression, which in turn influence cardiovascular malformations.
To elucidate the differential expression of genes and how expression is regulated by flow conditions, we propose a novel in vivo model of chick embryo AV which facilitates the real time tracking of blood flow. The study depends on the gene modulation in the extra-embryonic vasculature during the embryonic development. The cardiovascular system attains stability at HH13. Stability denotes a rhythmic cardiac beat and the rhythm is synchronised with pulsatile flow. During the transition from HH12 to HH13, the circulation becomes established; therefore we compare those two stages specifically. The present study will serve as a source file of flow responsive genes during HH10–13 stages of development, facilitating the researchers to study the abnormal flow patterns and the origin of congenital malformations. Further, the study compares the shear stress associated gene expression profile of developing chick embryo before and after the flow initiated in AV.
Materials and methods
Materials
Trizol reagent was from Invitrogen Life Technologies. cDNA M-MuLV reverse transcriptase and Taq polymerase were acquired from Applied Biosystems.
Methods
Biological sample – Chick embryo
Fertilized white and brown leghorn chicken eggs (Gallus domesticus L.) were purchased from Poultry Research Station, Potheri, Chennai and incubated in a sterile humidified incubator at 37°C. Staging of embryos was performed by counting the number of somites (Hamburger Hamilton Stage). All the experiments in chick embryos were performed between HH10 and HH13 stages.
mRNA sequencing
Experiments were performed on three AV of embryos from each stages from embryos of HH10, HH11, HH12 and HH13. Next, all the three samples were pooled for RNA isolation (TRIzol method). Pooled RNA from three different experiments was subjected to RNA sequencing. Transcriptome sequencing was performed using Illumina HiSeq 2500 ® platform and the data have been submitted to GEO (GSE60497). The sequence reads were aligned to the reference genome of chicken (Galgal4) downloaded from Ensembl Release 75 database. Alignment was performed using TopHat (v2.0.8) program to the Ensembl Release 75 gene model of chicken with default parameter settings. The differentially expressed genes were identified using Cuffdiff (v2.2.0) program with default settings. The geometric mean normalization method present in Cuffdiff program was used for normalizing gene expression. Gene Ontology Enrichment analyses of the differentially expressed genes before (HH12) and after flow (HH13) were performed using GeneCodis (http://genecodis.cnb.csic.es/) and DAVID (https://david.ncifcrf.gov/) online tools [12–14]. The default parameter settings were used for enrichment analysis. For GeneCodis: Minimum number of genes: 3; Statistical Test: hypergeometric; p-value correction: FDR. For DAVID, the following settings were use: Classification Stringency: Medium; Kappa Similarity – Similarity Term Overlap: 4; Similarity Threshold: 0.35; Classification: Initial; Group Membership: 4; Final Membership: 4; Multiple Linkage Threshold: 0.5.
Semi-quantitative reverse transcriptase PCR
Total RNA was isolated from chick extra-embryonic tissues of three embryos from each stage between HH10–HH13 using TRIzol method. Total RNA was quantified using Nanodrop and normalized accordingly. Briefly, 200 ng of RNA was reverse transcribed and PCR was performed using cDNA. β-actin was used as internal control to compare the expression of genes under study. The reaction conditions, product size and primer sequences have been summarized in Table 4. The reactions were carried out for 45 cycles for all the genes. The products were resolved in 1.5% agarose gel at 100 V using an agarose gel electrophoresis unit. Densitometry analysis was done using ImageJ and the relative KLF2, AQP-1, KDR, GATA4 band intensity was normalized with β-actin.
Results
Cardiac development and heart beat
We confined our study between HH10–13 stages of heart development, as we attempted to evaluate the changes occurring between the first heart beat and the establishment of effective blood flow. We calculated the rate of heart beat across the stages for the interpretation of cardiac function which is linked with shear stress. The recordings of heart beat were done for 2 min and calculated manually. We observed an increase in heart beat per min across the developmental stages (HH10–HH13) from 0 beats/min to 58 beats/min (Fig. 1).

Heart Beat profile across the stages: Chick AV was cultured ex vivo along with embryo between HH10–HH13 stages. The heart beat was video recorded for 5 min. The number of heart beats per min was calculated manually.
Expression of KLF-2, a well known mechanosensitive gene was down-regulated by 0.62-fold from HH12 to HH13. In addition, KLF4 and KLF5 were also found to be down-regulated by 0.52- and 0.26-fold respectively at HH13 stage compared with stage HH12. AQP1, another shear sensitive gene was found to be significantly up-regulated by 11.7-fold from HH12 to HH13 stage, however the fold change was 201 fold between HH10–HH13 stage. HAND1 was found to be significantly up-regulated at HH13 stage, though we could not find any expression of HAND2, a major flow responsive gene. A common mechanosensitive gene, CTGF showed 3.84-fold gene up-regulation once the blood flow started at HH13 stage. Other mechanosensitive genes, CTPS1 was found to be down-regulated under shear stress in our model. KDR was increased by 2.2-fold under shear stress at HH13 stage. Another flow sensitive transcription factor GATA-binding protein 4, showed 0.2-fold decrease in expression at HH13 stage compared to HH12 (Table 1). The expression of RUNX1, a hematopoietic master regulator was not modulated across the stages (Table 1). The gene expression modulation observed during early vasculogenesis between HH10–HH13 stages is expressed in terms of a scatter plot in Fig. 2.
Modulation of shear stress related genes expression between HH12–HH13 stages
Modulation of shear stress related genes expression between HH12–HH13 stages
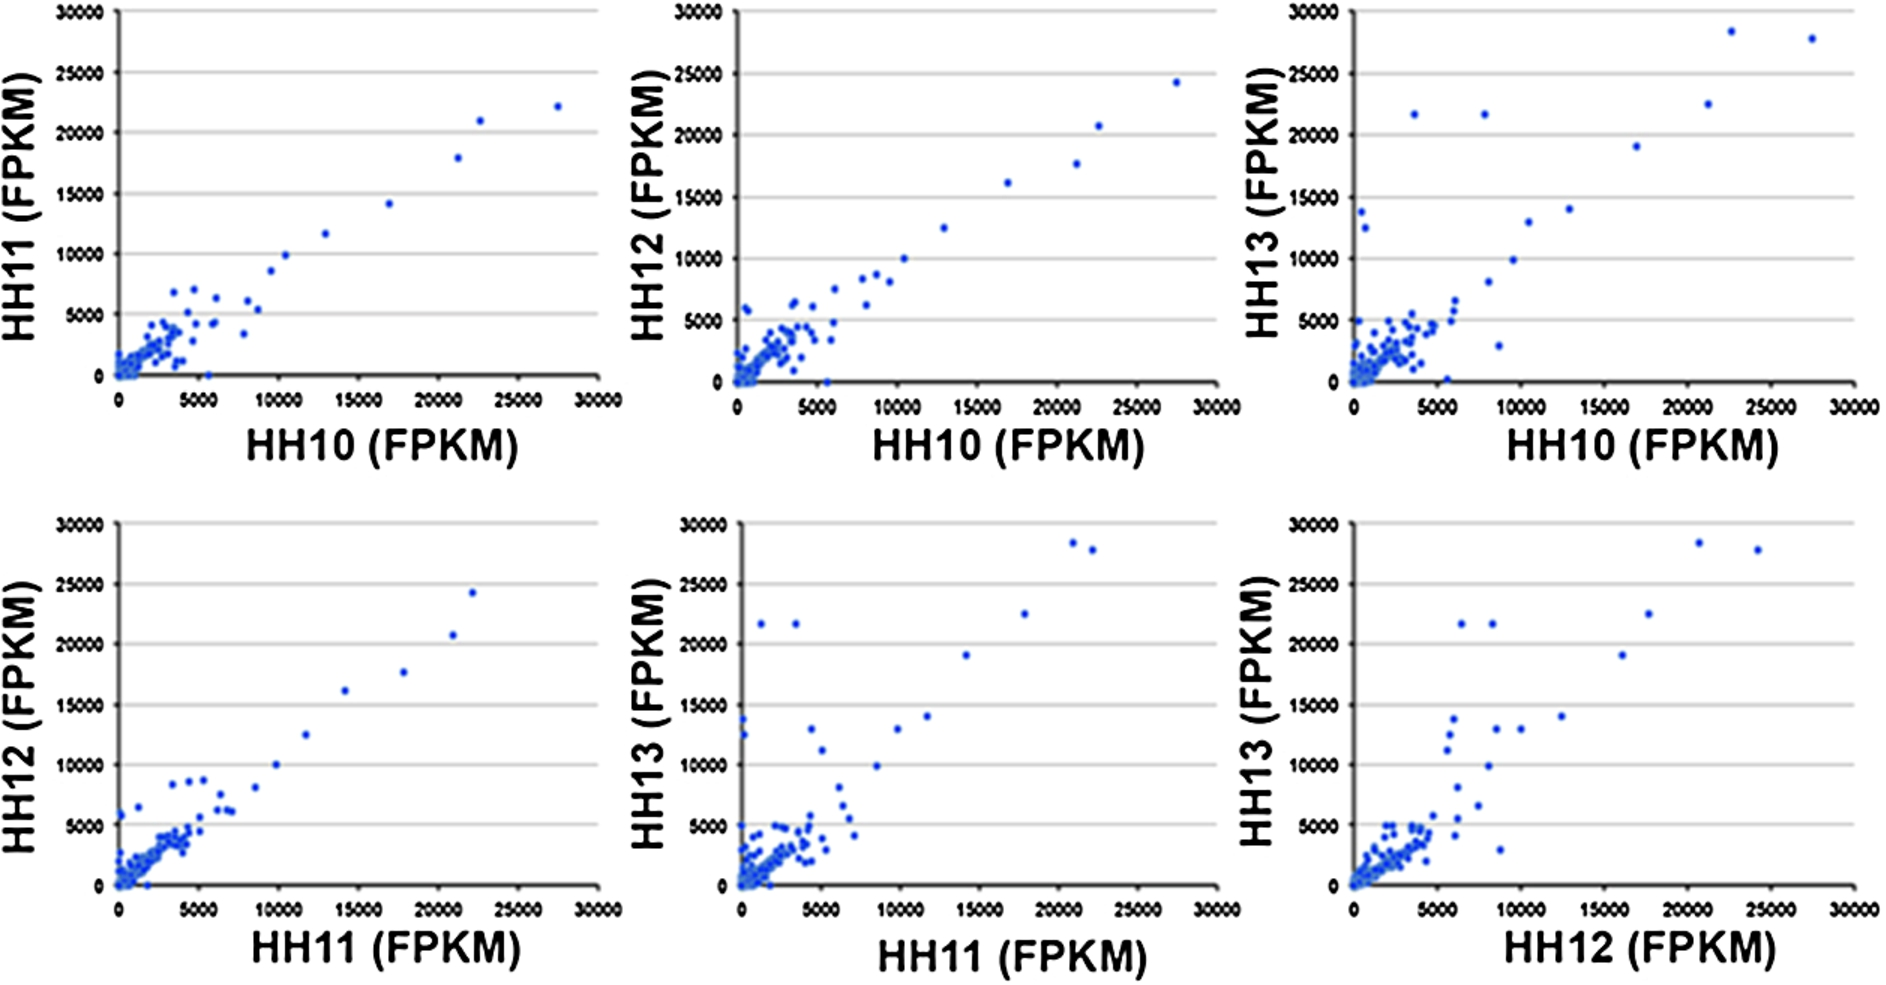
Gene expression of one stage compared to other stage in bins of 17,000 genes by length, for chick early vasculogenesis between stages HH10–HH13.
In an attempt to examine the expression of genes responsible for arterial specification, we first evaluated DLL4, GJA5, NOTCH1 and NRP1 expression, which were up-regulated significantly by 3.1, 27.2, 2.7 and 3.98 fold respectively between HH12 and HH13 stages (Table 2). In addition, gap junction proteins that include GJA1, GJA4, GJB2 and GJC2 were up-regulated by 3.9, 6.95, 2.2 and 4.5-fold respectively at HH13 stage compared to HH12. EPHA3, a gene essential for endothelial-to-mesenchymal transition during heart development was found to be significantly up-regulated by 4.9 fold under shear in our model.
Expression of markers of arterial–venous specification
Expression of markers of arterial–venous specification
Next, we aimed to examine the expression of genes involved in venous specification. In our study, NRP2 was up-regulated by 2.6-fold under shear stress at HH13 stage. Similarly TEK gene, that encodes for Tie2 protein showed 2.2-fold up-regulation under shear at HH13 stage.
The expression of collagen I-alpha-2, encoded by COL1A2 gene was found increased 7.9 fold at HH13 stage in our model suggesting the necessity for the up-regulation of extracellular matrix protein once blood flow starts (Table 3; Fig. 3). The expression of MMP2 gene in our model showed 3.06 fold increase at HH13 stage compared to HH12. Tenascin C (TN-C), a glycoprotein in humans is up-regulated by 4.2-fold at HH12 stage compared to no shear stages, however the gene was down-regulated at HH13.
Expression of genes involved in ECM remodeling
Expression of genes involved in ECM remodeling
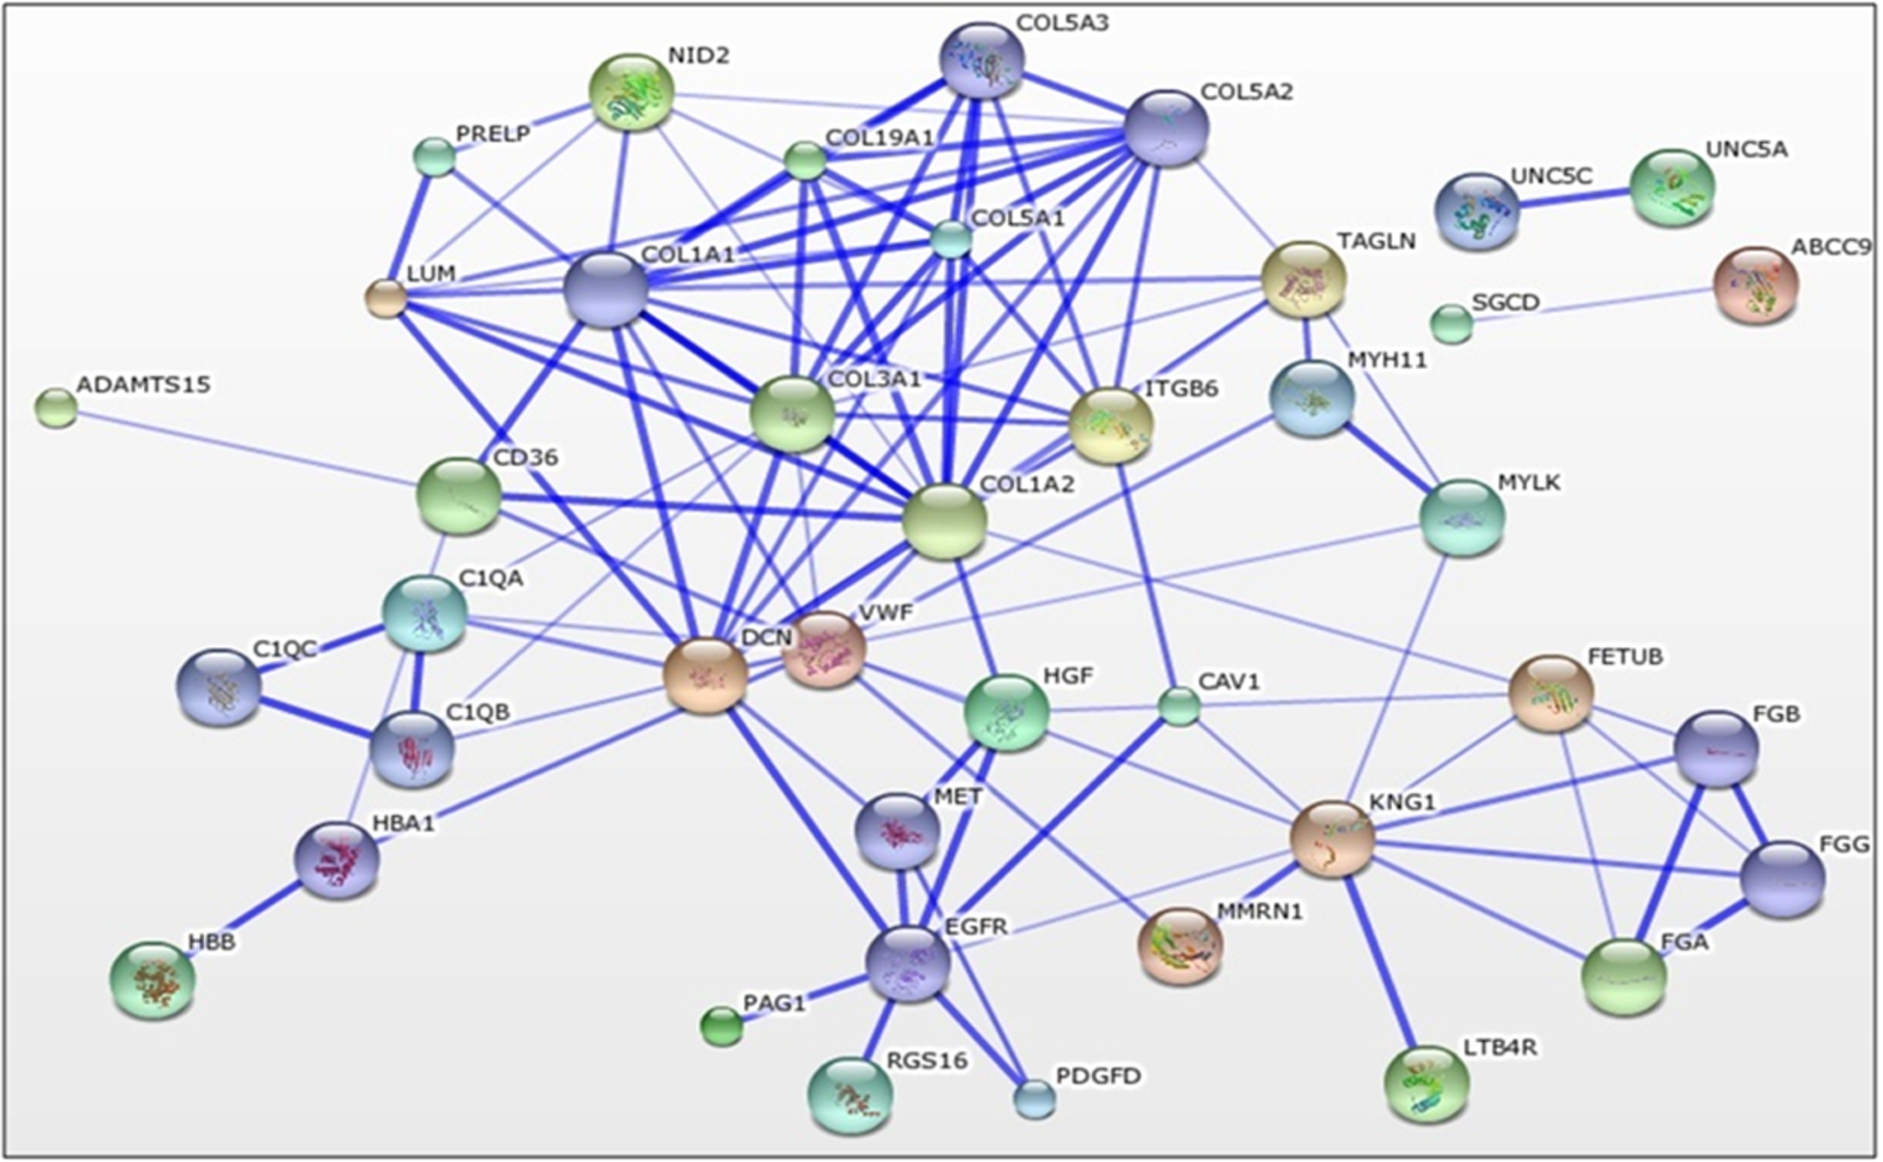
Figure showing a network of predicted associations involved in collagen fibril organization in chicken (Gallus gallus) generated by the STRING Database v9.1 for a particular group of proteins which is predicted to be involved in collagen fibril organization. The network edges represent the predicted functional associations. The different size of the node only reflects that there is structural information associated with the protein. Lines represent associations based on experimental data, co-expression, databases and/or homology.
We examined the gene expression of nidogen-2 (NID2), a cell adhesion glycoprotein involved in cell-matrix interaction. The expression was increased by 6.2-fold at HH13 stage. Papilin (PAPLN), a proteoglycan like sulfated protein interacts with several extracellular matrix components and ADAMTS enzymes. This gene was found to be up-regulated by 4.4-fold at HH13 stage. Lumican and decorin, members of the small leucine-rich proteoglycan (SLRP) family were found to be significantly up-regulated under shear by 8.1 and 9.26 fold respectively (Table 3).
Among the enriched GO Biological Processes with significantly up-regulated genes terms, cell adhesion, heart development, extracellular matrix organization, cell-matrix adhesion and collagen fibril organization were enriched significantly with 32 (25%), 15 (11.7%), 13 (10.2%), 8 (6.3%) and 6 (4.7%) genes respectively. Patterning of blood vessels and blood vessel development were enriched significantly as well (Fig. 4). GO Molecular Function analysis of the genes up-regulated during HH12–13 transition showed enrichment of the terms, calcium ion binding, extracellular matrix structural constituent, extracellular matrix binding which were enriched with 44 (40.7%), 8 (7.4%) and 5 (4.6%) genes respectively. Vascular endothelial growth factor-associated receptor activity accounted for 3.7% of genes enriched (Fig. 5). Among the enriched GO cellular components, up-regulated genes related to extracellular components contributed to more than 20% of enriched cellular components.
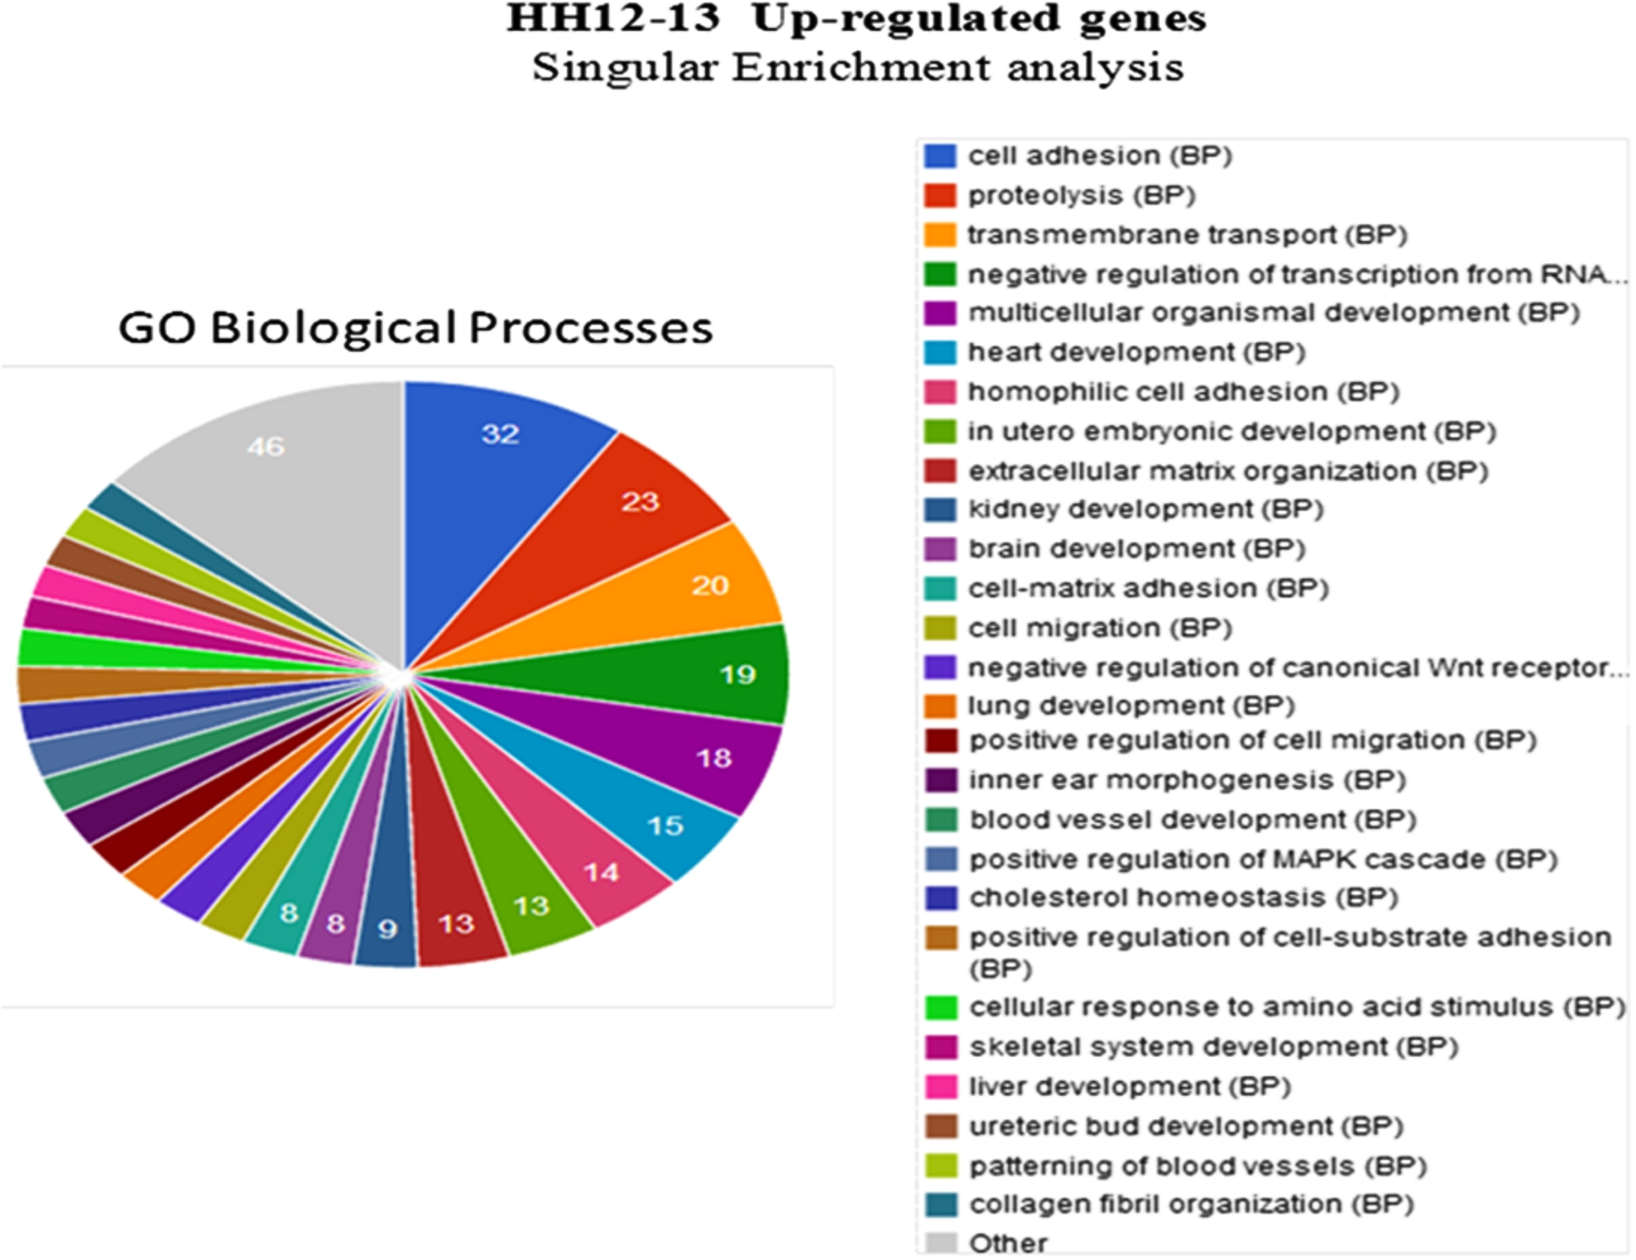
Biological function of differentially regulated genes: Significantly enriched GO terms of up-regulated genes during HH12–13 transition as revealed by GeneCodis analysis. 27 significantly enriched signalling pathways are shown along with the number of genes contained in each pathway (right).
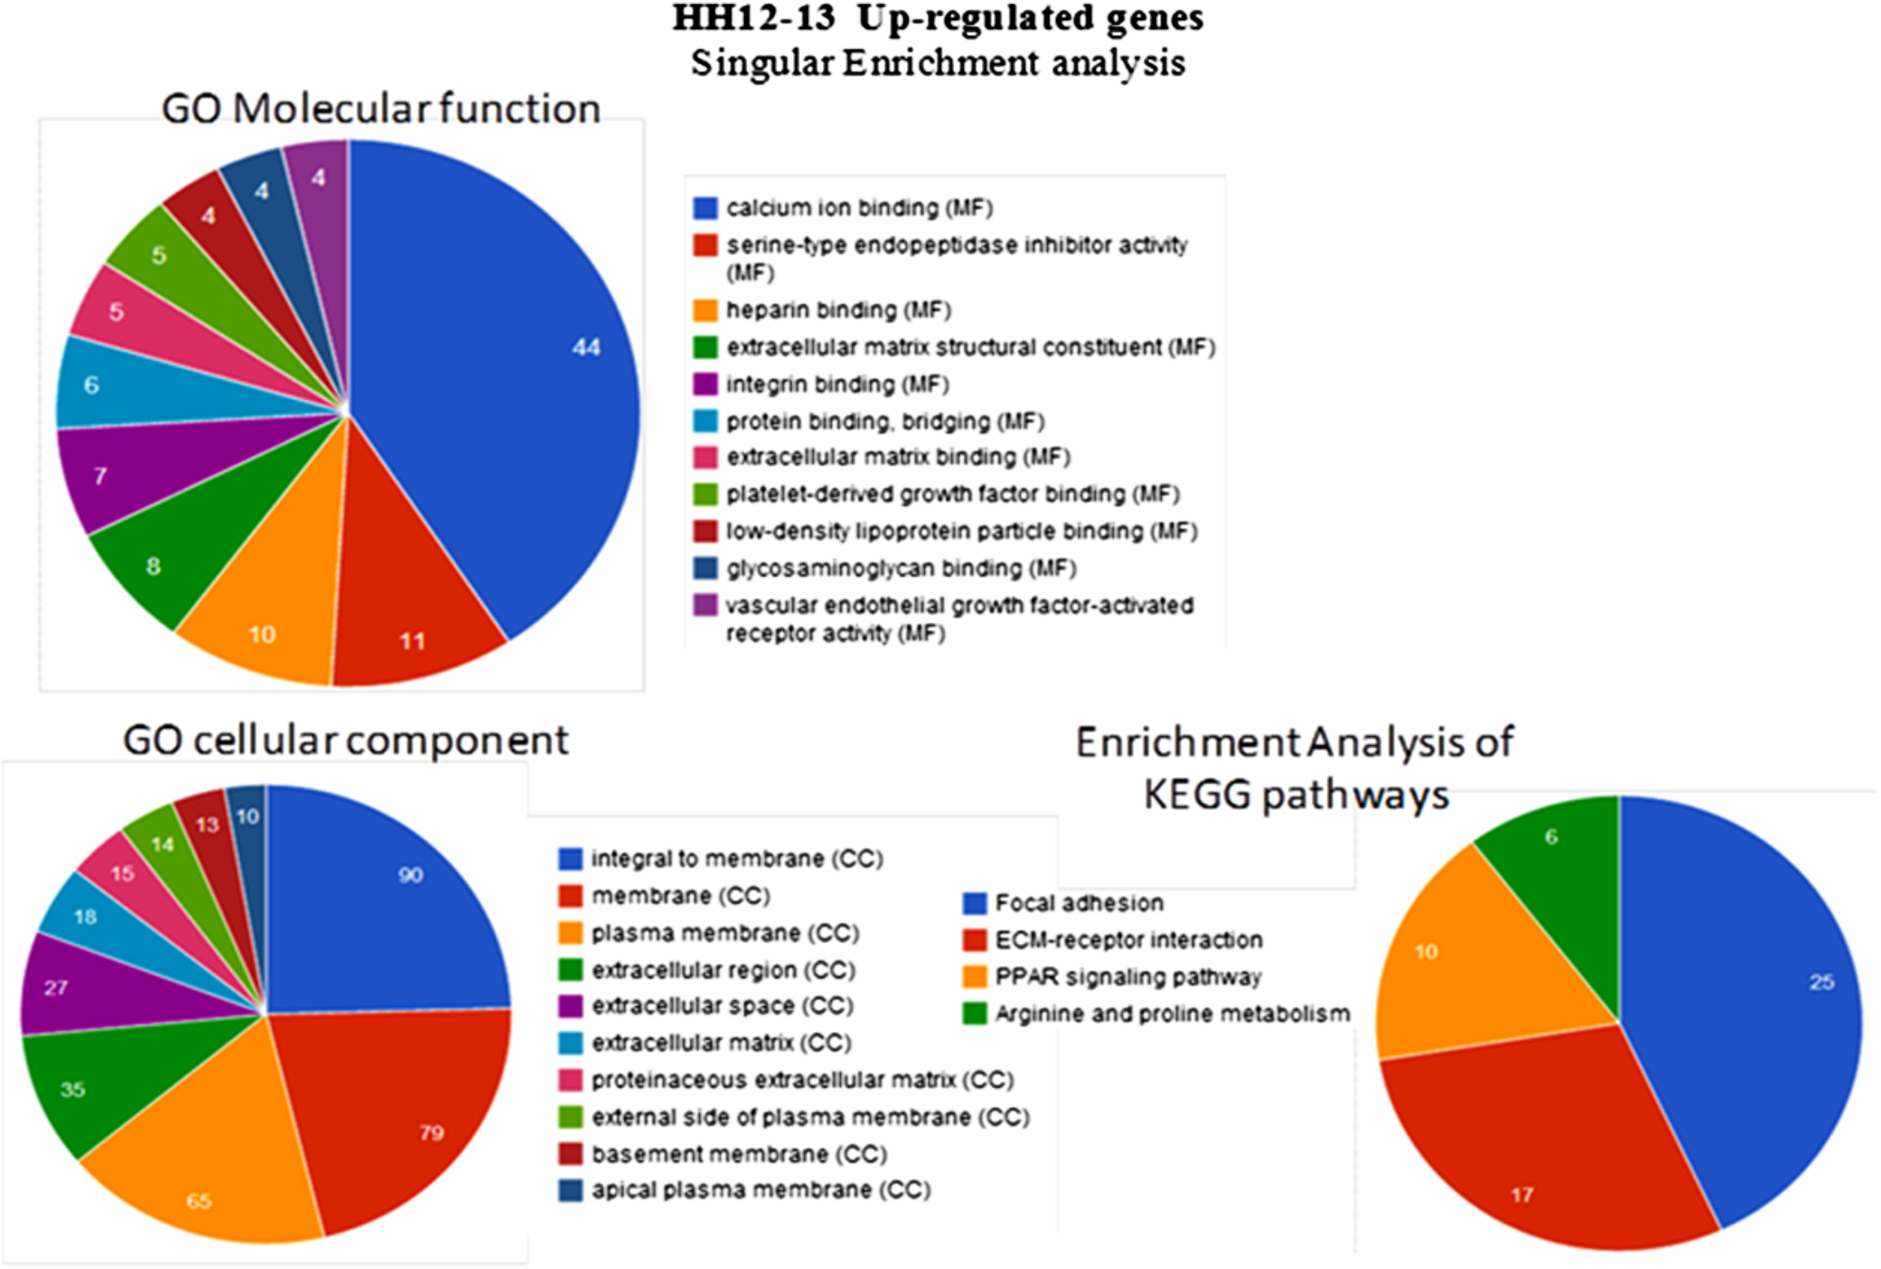
Molecular and Cellular component functions of differentially regulated genes: Significantly enriched GO terms of up-regulated genes during HH12–13 transition as revealed by GeneCodis analysis. The up-regulated genes between HH10–HH13 were subjected to a pathway enrichment analysis by using the KEGG database. Only significantly enriched KEGG functional categories (
Annotation clustering analysis showed 78 clusters. A cluster related to extracellular matrix components and organization showed an enrichment score of 4.09, that included terms, extracellular region part, extracellular matrix, collagen, secreted and triple helix repeat. Another cluster related to blood vessel development and vascular patterning with an enrichment score of 3.12. This cluster included terms blood vessel development, vasculature development, blood vessel morphogenesis, tube development, angiogenesis, patterning of blood vessels.
Among GO KEGG Pathways, the terms “ECM–receptor interaction” was remarkably enriched with 17 genes accounting for 29.3% of differentially regulated genes (Fig. 5).
A systematic analysis of the inflammation-related gene expression in extra embryonic membrane between HH10–HH13 showed no significant difference in genes such as ICAM-1, VCAM-1, NK4, COX2. PPARs are a subfamily of the nuclear receptor family of transcription factors that control the expression of key genes that are implicated in the regulation of macrophage and endothelial cell inflammatory responses. Among GO KEGG Pathways, PPAR signalling pathway was remarkably enriched with 10 genes accounting for 17.2% of differentially regulated genes. vWF, another key player recognized as proinflammatory protein which promotes adhesion of platelets to the sites of vascular injury was up-regulated by 5.9-fold at HH13 stage.
Validation of gene expression by semi-quantitative PCR:
In order to validate the RNA-seq data, we performed semi quantitative PCR for the genes GATA4, KDR, KLF2 and AQP-1 with β-actin serving as internal control. The PCR conditions and primers are given in Table 4. Confirming our RNA-seq data, PCR results also showed an increase in KDR expression and decrease in GATA4 at HH13 stage as compared to other stages and slight decrease in KLF2 expression, however AQP-1 did not show significant difference in expression (Fig. 6(a)). Densitometric analysis of the gel images was done and graphs plotted against RNA-seq data (Fig. 6(b)–(e)).
Primers used for semi quantitative PCR analysis
Primers used for semi quantitative PCR analysis
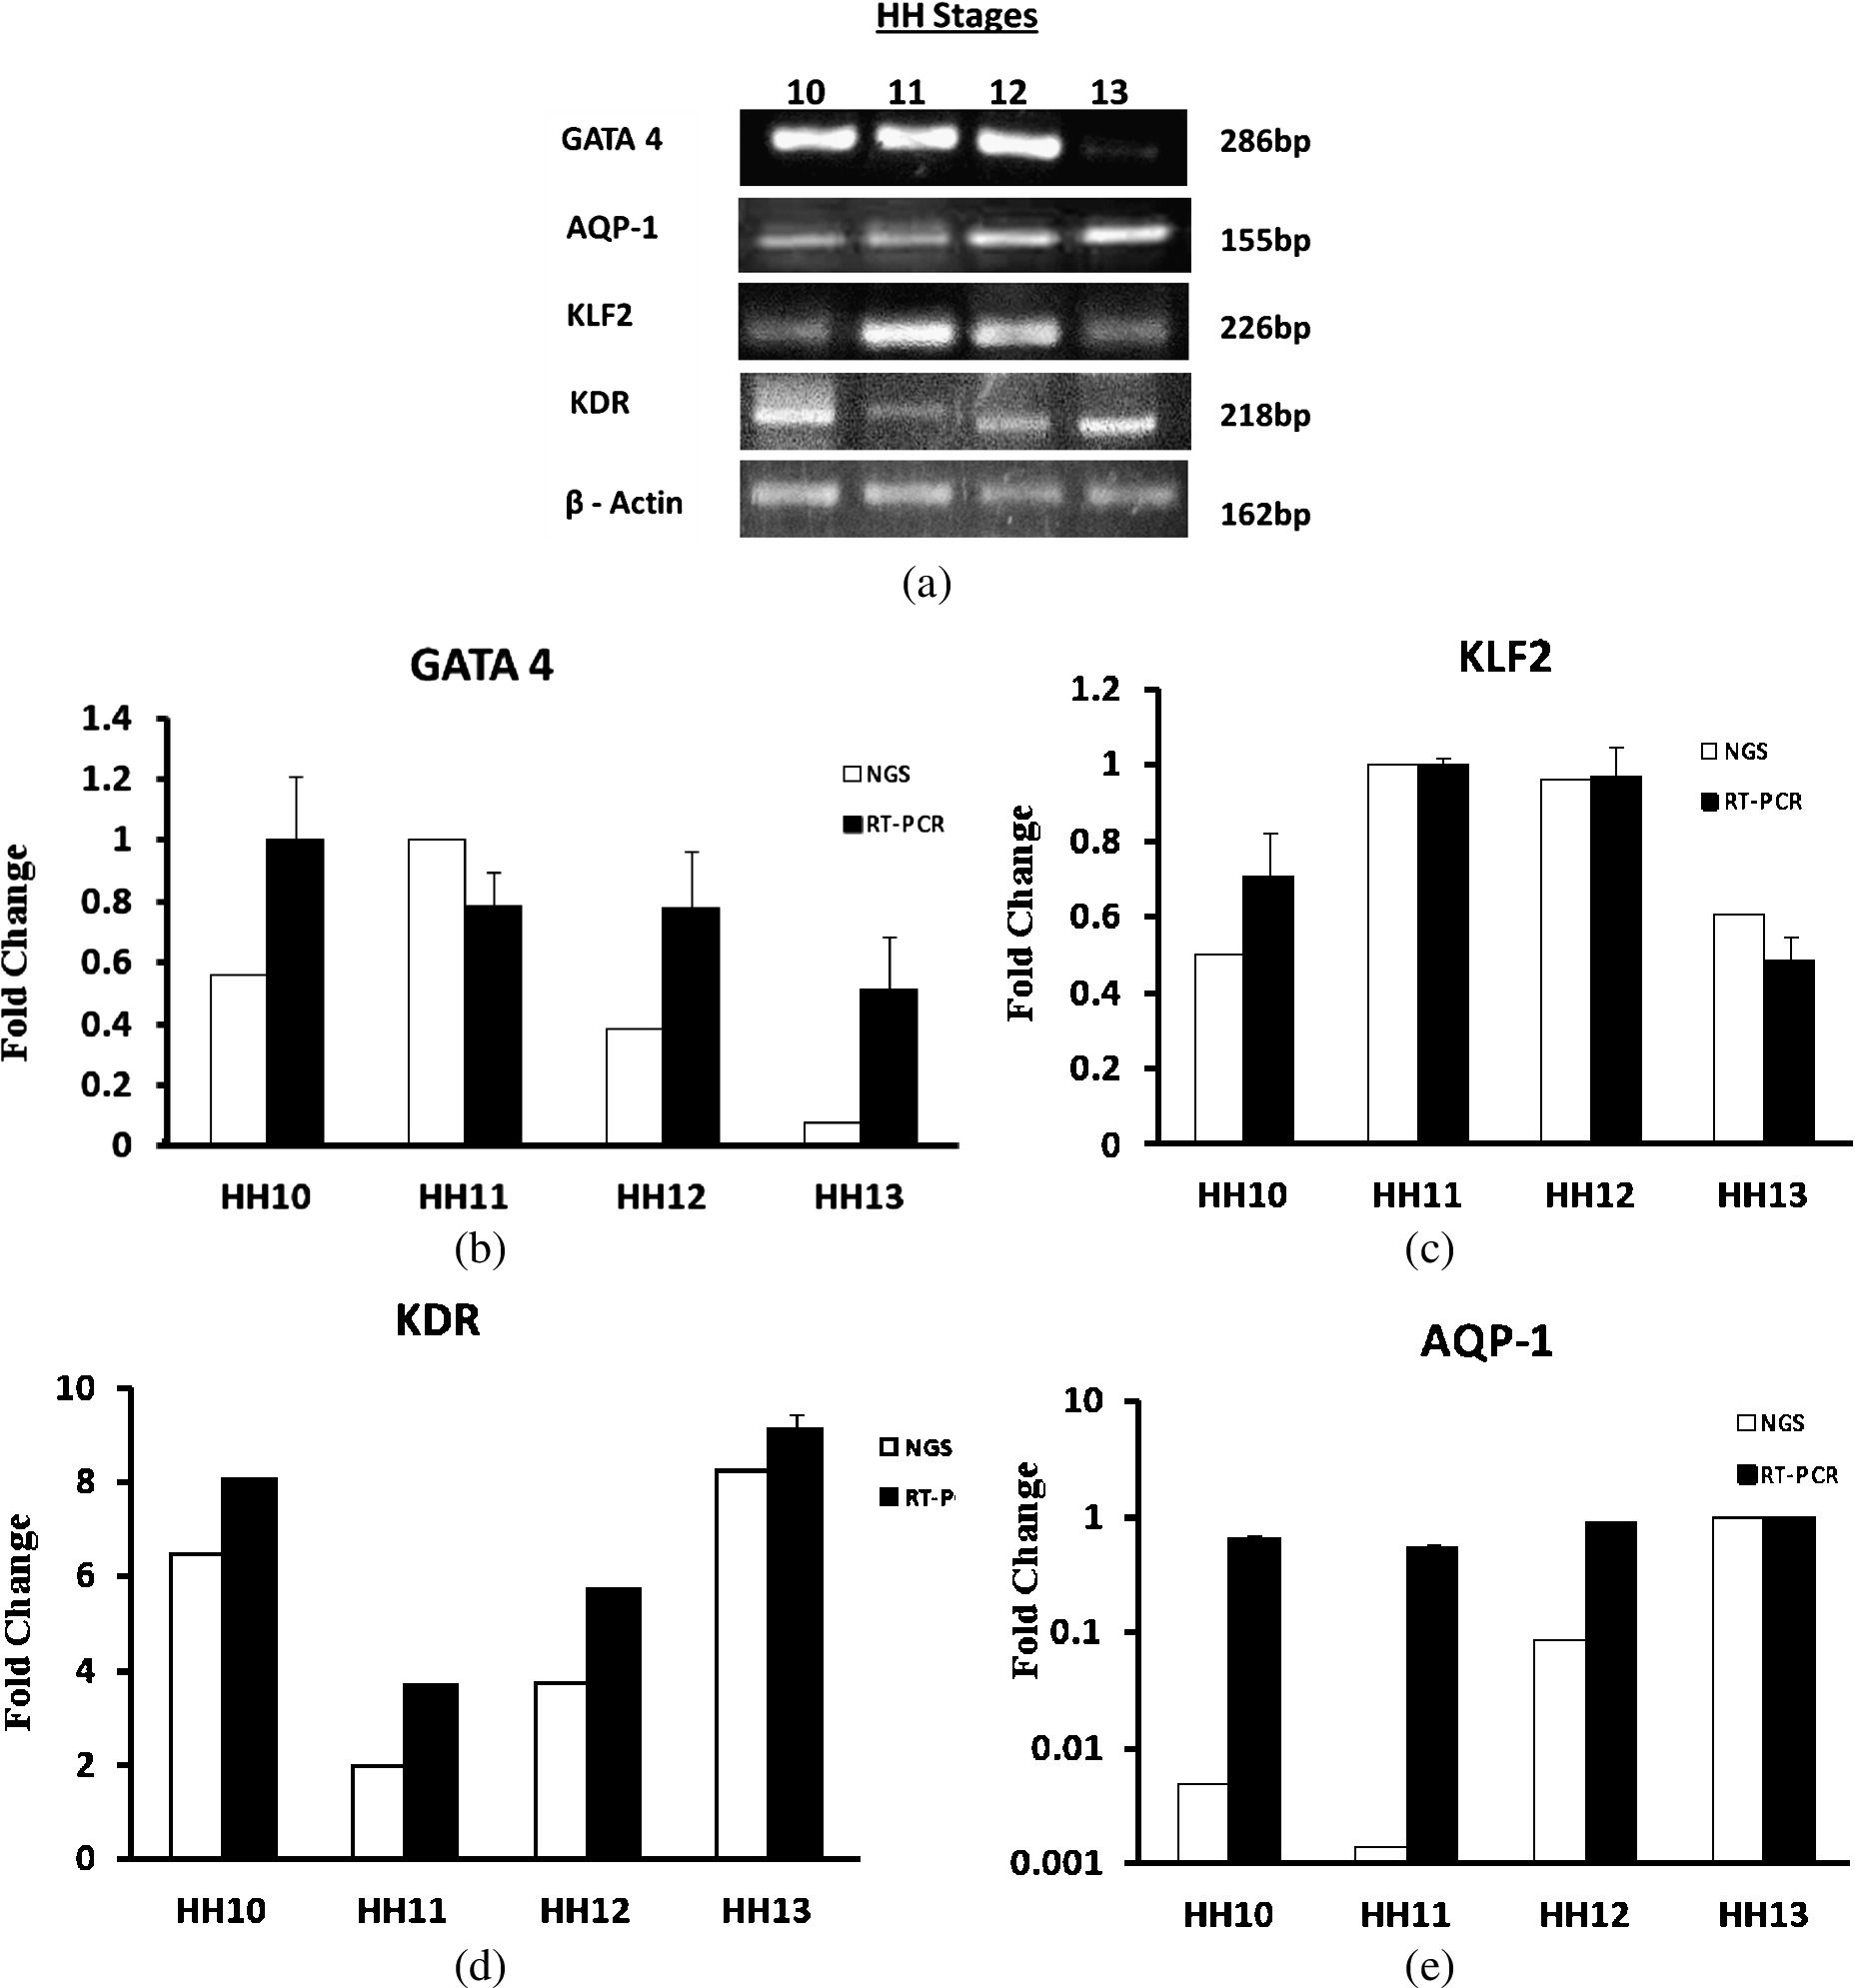
Gene Expression studies: (a) Total RNA of extra embryonic membrane between HH10–HH13 was isolated and evaluated for GATA4, AQP-1 and KLF2 expression profile. cDNA was amplified with respective primers and run on 2% agarose gel. As an internal control β-actin mRNA was measured in parallel. Images were captures using Sony Coolpix 10X optical zoom camera. (b)–(e) Correlation between RNA-Seq and Semi-quantitative PCR: Black bar represents densitometric analysis of gel images showing changes in mRNA levels of extra embryonic membrane between HH10–HH13. Expression was normalized using β-actin as a reference gene. Results represent mean values ± SEM (
No report to date has described the gene expression profile in relation to the initiation of the heart beat. However, cell based fluidic studies [15,16] reported that there are three stages at which one may expect changes in gene expression profile; 1. Immediately after flow begins [17]; 2. In minutes (a delayed effect) [18]; 3. Sustained effects in hours [19,20]. The present study investigated the flow effects in minutes to hours. For this study, RNA was extracted from EE-AV, which mostly comprised of blood vessels and connective tissues. Therefore, we have categorically analyzed the genes relevant to endothelium, connective tissues and extra-cellular matrix. Several studies have demonstrated that endothelial KLF-2 is an important transcriptional regulator during heart development and regulates several endothelial genes that control vascular tone in response to flow [19,21–23]. Although KLF-2 has been reported to get up-regulated under shear stress in many studies [15,19,24], down regulation of KLF2 by 0.3-fold was observed under disturbed flow conditions [25]. Wang et al. (2006) showed that KLF-2 expression was differentially regulated by pulsatile flow and oscillatory flow with temporal and spatial specificities. Investigation of the signaling pathway demonstrated that inhibition of Src in endothelial cells led to up-regulation of KLF-2 gene expression under basal condition, while the inactivation of Src pathway inhibited the suppressive effect of oscillatory flow on KLF-2. This clearly demonstrated that Src/KLF2 provides a pathway for the signaling divergence of the effects of oscillatory and pulsatile flows [15]. Aquaporin-1 (AQP-1), an intrinsic membrane protein, is a downstream target of KLF2 [26]. It has also been shown that laminar shear stress increased AQP-1 gene expression and KLF2 expression profile [19,27]. Furthermore, it is known that human AQP1 promoter contains nine CACCC regulatory elements which are known to be a consensus motif for KLF-2 [28]. As there is an intricate link between KLF-2 and AQP1, we attempted to investigate the expression of AQP1 to understand the modulation of this gene across the stages. We expected no significant change in AQP1 expression across the stages similar to KLF-2. In contrary, we observed a significant increase in AQP1 expression at HH13 stage compared to other stages. Though, the results were in accordance with the literature, showing activation of AQP1 expression upon the onset of flow, we speculated that this modulation in expression may be due to other mechanism rather than KLF-2 mediated activation.
Connective tissue growth factor (CTGF) which is produced by endothelial cells plays a major role in chondrocytes proliferation and differentiation and also in cell adhesion. It has been reported that shear stress down regulates the expression of CTGF in endothelium [29].
GATA4, another flow sensitive transcription factor has been implicated in mechanical load-responsive mediator of transcription by regulating the gene expression that contributes to cardiac remodeling and ventricular hypertrophy [30,31]. It has been shown that global knock-out of either GATA4 or GATA6 resulted in embryonic lethality during gastrulation [32,33]. Our results showed a decrease in expression of GATA4 at HH13 stage suggesting that modulation of GATA4 expression is associated with extra-embryonic flow dynamics.
Arteriovenous differentiation is a key event during vascular development and flow patterns play an important role. Although arteriovenous specific markers are expressed before flow initiates, the gene expression will be greatly varied once the flow begins. This study includes a set of markers that specifies: 1) first arteries and veins, 2) stage of their specification. Among the genes tested, NRP1 and GJA5 showed significant up-regulation. Gap junction proteins were also found to be up-regulated across HH12–13 stages. GJA5 along with GJA4 is expressed especially in arteries [34]. GJA5 gets expressed in the arterial network and plays a major role in flow induced arterial patterning and it has been suggested to modulate the adaptation to flow in ligation–reperfusion models [35]. Once the blood flow begins, the expression of GJA5 increased by 27-fold, which suggests that fluid flow triggers the expression of GJA5 for further fortification of vascular structure and cell–cell interactions. Nrp2, a prominent venous marker strongly expressed in sinus venous at E8.5 in mouse embryos [36] is up-regulated at HH13 stage in our study. Although both arterial and venous specific markers Nrp1 and Nrp2 were respectively found to be significantly up-regulated at HH13 stage compared to no flow (HH11) or irregular flow state (HH12), the time of differentiation of artery and veins remains elusive.
Extracellular matrix provides a structural framework essential for the functional properties of vessel walls [37]. Collagen is one such major insoluble fibrous protein in the extracellular matrix. Collagen form the main protein constituents of vessels. The biomechanical properties of vessels are largely dependent on the absolute and relative quantities of collagen and other extracellular matrix components [38]. In addition, to understand the ECM gene regulation in our models, we evaluated ECM related gene expressions. MMP2, showed up-regulation at HH13 stage. Although reports suggest laminar shear stress down regulates MMP2 expression in endothelium [39,40], others suggest that increased shear stress might stimulate MMP production by endothelial cells [41,42]. The observed discrepancies in MMP2 production might be due to the magnitude of wall shear stress.
Tenascin C (TN-C), a glycoprotein in humans is up-regulated by 4.2-fold at HH12 stage compared to no shear stages, however the gene gets down-regulated once blood flow starts. This differential expression could be explained by the fact that tenascin exists in two forms, tenascin-C (TNC) and tenascin-X (TNX). TNC is expressed in a spatiotemporally restricted pattern associated with tissue remodeling during embryonic development, whereas TNX, is found in most tissues but most predominantly in heart and muscle, often complementarily to TNC. TNC is tightly regulated dependent on the cell type and tissue microenvironment [43]. Mackie et al. in 1992 proposed that high expression of TNC is often observed at the branching point of arteries, although the expression level of TNC is generally low in adult blood vessels [44]. These results clearly demonstrate the temporal gene expression pattern of TNC during heart development. However, as being a continuously developing system, the physiological manifestation like flow and flow-associated changes, have a transition phase and many times the physical transition time and effects are overlapping and vaguely categorized in the time scale. Therefore, we propose that at HH12, the expression of TN-C reached its peak and once the flow starts at the critical junction point of HH12–13, the expression of TN-C begins to fall. The present study extends those findings in demonstrating the up-regulation of focal adhesion molecules at HH13 stage, once the blood starts to flow.
Observations of the present study suggest that AV of chick embryo from HH10 to HH13 can be proposed as a model for detailed study of flow-associated events in the early embryonic development, specifically the development of the cardiovascular system. Moreover, this time window gives the opportunity to study shear effects on the vascular system before and after flow initiates in the vasculature with the very first heart beat of the embryo. With the advent of RNA Sequencing, it is important to conduct such experiments and extract results under different conditions to give a global idea of gene modulation under shear conditions, but each one must be clearly documented for future data mining and analysis using blood flow controlling apparatus. The justifications for the development of the proposed model of the chick embryo AV are that the system is easy to set up and accessible to manipulate. Analysis of individual genes may provide us with major clues of shear-stress responsive genes during development. This in vivo, strictly in ovo, model has several advantages over in vitro culture models. For instance, there are certain limitations in the in vitro culture models such as loss or dysregulation of mechanosensitive genes during extraction and culture. This study provides additional evidence that flow plays a major role in development and ensures dynamic re-modeling of AV to house, grow and maintain a functional vasculature, which provides appropriate nutrition to the growing embryo.
Footnotes
Acknowledgements
This work was partially supported by a grant from University Grant Commission Faculty Recharge Programme (UGC-FRP), Government of India and KBC Research Foundation, India to SC. LS received financial support from Department of Biotechnology – Junior Research Fellowship Programme, Government of India.