
Abstract
Background:
Ultrasound elastography has been widely used to measure liver stiffness. However, the accuracy of liver viscoelasticity obtained by ultrasound elastography has not been well established.
Objective:
To assess the accuracy of ultrasound elastography for measuring liver viscoelasticity and compare to conventional rheometry methods. In addition, to determine if combining these two methods could delineate the rheological behavior of liver over a wide range of frequencies.
Methods:
The phase velocities of shear waves were measured in livers over a frequency range from 100 to 400 Hz using the ultrasound elastography method of shearwave dispersion ultrasound vibrometry (SDUV), while the complex shear moduli were obtained by rheometry over a frequency range of 1 to 30 Hz. Three rheological models, Maxwell, Voigt, and Zener, were fit to the measured data obtained from the two separate methods and from the combination of the two methods.
Results:
The elasticity measured by SDUV was in good agreement with that of rheometry. However, the viscosity measured by SDUV was significantly different from that of rheometry.
Conclusions:
The results indicate that the high frequency components of the dispersive data play a much more important role in determining the dispersive pattern or the viscous value than the low frequency components. It was found that the Maxwell model is not as appropriate as the Voigt and Zener models for describing the rheological behavior of liver.
Keywords
Introduction
Elastography is an emerging branch of medical imaging for noninvasively quantifying the biomechanical properties of soft biological tissues [1]. A number of elastography techniques, primarily based on a variety of imaging modalities such as ultrasound, magnetic resonance imaging (MRI), and optical coherence tomography (OCT), have been developed over the past two decades [1]. Because ultrasound has unique advantages such as being noninvasive, applicable to real time imaging and ease of accessibility, elastography based on this modality has attracted considerable attention. A diversity of ultrasound elastography methods have been proposed, including quasi-static elastography [2], transient elastography (TE) [3], sonoelastography [4], acoustic radiation force impulse imaging (ARFI) [5], shear wave elasticity imaging (SWEI) [6], supersonic shear imaging (SSI) [7], harmonic motion imaging [8], shear wave induced resonance elastography (SWIRE) [9], vibro-elastography [10] and shearwave dispersion ultrasound vibrometry (SDUV) [11]. Some of these have been integrated into commercial ultrasound systems and have been widely applied in clinical applications [12,13].
Elastography has been applied to measure the mechanical properties of various human tissues and organs, including muscle, breast, brain, liver, etc. [12,14]. Assessment of liver status is one of the most successful applications of elastography and is becoming a common application in clinical practice [15,16]. Studies using ultrasound elastography demonstrated that the mechanical properties of liver have significant correlations with diseases such as fibrosis [17–19] and non-alcoholic fatty liver disease (NAFLD) [20,21]. Most studies applying elastography to liver assessment used a linear elastic model that contains only elasticity. However, living liver contains fluid and, thus, naturally exhibits both elastic and viscous (i.e. rheological) behavior. Hence, a viscoelastic description of the mechanical behavior of liver is more accurate and physically correct than a linear elastic one. Furthermore, the viscosity, as well as the elasticity, can provide useful information about liver status [21]. Several ultrasound elastography methods have been developed to measure the viscoelastic properties of soft tissues [8,11,22,23], and a few of them were applied to the assessment of liver [18,19,21]. These methods have usually been applied in a multi-frequency approach to measure the dispersive shear-wave properties. Some representative frequencies were 95–380 Hz [18], 60–600 Hz [19], and 100–400 Hz [21],
The ultrasound elastography methods that measure the viscoelastic properties of tissues usually involve fitting the dispersive shear-wave velocity and attenuation coefficients to a rheological model [24]. Several models, including Voigt [18], Maxwell [25], and Zener [26] models have been applied to the assessment of liver properties. However, most of the studies assumed a specific model in advance and did not investigate the issue of model selection. A few preliminary studies, however, investigated different rheological models for liver characterization. For instance, ultrasound elastography was used to measure the propagation velocity of shear waves in porcine liver and evaluated the performance of three models, Voigt, Maxwell, and Zener, in fitting the measured shear wave velocity [25,27]. Nevertheless, insofar as we are aware, no general agreement has been reached as to which model is the most appropriate for the application of ultrasound elastography to liver.
Conventional methods for investigating the biomechanical properties of soft tissue include rheological tests such as dynamic mechanical analysis (DMA) and oscillatory rheometry. Some studies have compared elastography techniques with these conventional methods for assessing the viscoelastic properties of biological tissue. For example, Chatelin et al. [28] measured the shear modulus of liver by both transient elastography (TE) (50 Hz) and dynamic mechanical analysis (DMA) (0.1–4 Hz) and studied the influence of the test conditions on the liver viscoelastic properties. Klatt et al. [29] investigated bovine liver specimens by oscillatory rheometry and multi-frequency magnetic resonance elastography (MRE) in a common frequency range between 25.0 and 62.5 Hz and validates MRE as a method for investigating the rheology of liver tissue. Bernal et al. [30] used SSI (20–400 Hz) to measure the viscoelastic properties of blood clots and carried out classical rheometry experiments (0.25–25 Hz) on the same blood samples taken within the first few seconds of coagulation. A similar work was conducted earlier by Schmitt et al. to characterize blood clot viscoelasticity by dynamic ultrasound elastography [31].
The studies mentioned above showed that elasticity measured by elastography was in good agreement with that measured by rheological tests. However, few studies have tried to validate the viscosity obtained by elastography. Specifically, elastography and rheological tests usually use different frequency bands that typically range from 100 to 600 Hz for elastography and 0 to 50 Hz for rheometry. This raises the question of the effect of frequency on the viscoelastic results as measured by the two methods. More importantly, with complementary frequency ranges, would the two methods provide mutual information about the rheological behavior of the tissue, and better characterize its elastic and viscous components, compared with a single method? Addressing these questions could considerably advance the development and application of ultrasound elastography and, consequently, contribute to better understanding of the rheological behavior of the tissue.
The present study used an ultrasound elastography method called shearwave dispersion ultrasound vibrometry (SDUV) and classic rheometry test to measure the shear viscoelastic modulus of rat liver. Because the frequency ranges of the two methods were different, we could not directly compare the results of the two methods. Instead, the dispersive data from the two methods were combined to assess the viscoelastic properties of liver in a reasonable way. The goal was twofold. First, we aimed to demonstrate the validity of SDUV for quantitatively measuring liver viscoelasticity by correlating it with the conventional rheometric techniques. Second, we combined the dispersive data from both methods to explore the rheological behavior of liver over a broader frequency range.
Methods
Theory
Rheological tests measure the dynamic mechanical behavior of biological tissues. A sinusoidal shear strain
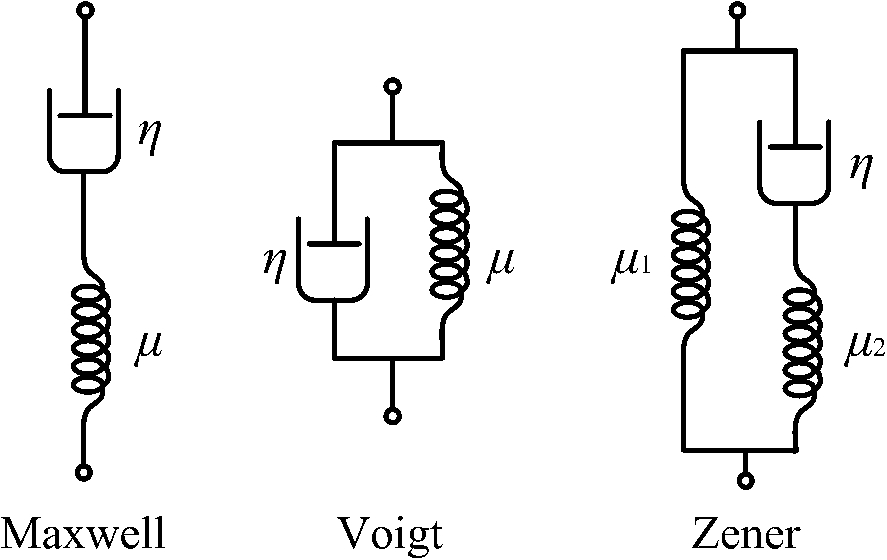
The three rheological models used in this study.
The relationship between the complex modulus and the viscoelastic parameters are as follows [33]:
Six male Sprague–Dawley rats (Guangdong Medical Laboratory Animal Center, Guangdong, China) were used in this study. The rats were sacrificed to harvest the liver. The left and right lobes of the liver were used for ultrasound measurement and rheometry, respectively. All procedures in these studies were approved by the Animal Care Committee of Shenzhen University and the Guangdong Medical Laboratory Animal Center.
SDUV measurement
The liver sample was measured in vitro by a custom-made ultrasound system which can produce a radiation force and track the shear wave propagation. The excitation sequence for the radiation force consisted of 10 pulses of tone bursts, with a central frequency of 1.04 MHz, a pulse width of 200 microseconds, and a pulse repetition frequency of 100 Hz. Each excitation pulse sequence was followed by 20 tracking A-lines with a central frequency of 5 MHz and a PRF of 2 kHz. To monitor the shear wave propagation away from the center where the radiation force is applied, a series of detection locations laterally offset to one side of the center were used. The details of the system setup and timing of data acquisition were described in our other reports [27,34]. For each liver sample, six to eight (depending on the liver size) measurements were obtained across the liver to provide a comprehensive evaluation.
Rheometry
Rheometry tests were carried conducted using a strain-controlled rheometer (AR1000, TA Instruments, New Castle, DE, USA) with a 25 mm diameter parallel plate configuration. The liver sample was processed to extract one or two
Data analysis
The radiofrequency echo signal captured by the ultrasound system was processed to extract the shear wave vibration. Received echo
The complex shear modulus measured by rheometry was substituted into Eq. (2) to solve for the elasticity and viscosity corresponding to each model. The same curve-fitting method as that for the ultrasound measurements was used. The complex shear moduli were then substituted into Eq. (3) to calculate the shear wave velocities in the frequency range of 1–30 Hz. Three sets of dispersive shear wave velocities from two different data sources plus their combination were substituted into Eq. (4) to calculate the viscoelastic parameters for each model: the data from the rheometry in the low frequency range of 1–30 Hz, the data from the SDUV in the high frequency range of 100–400 Hz, and the combined data from the rheometry and the SDUV in the entire frequency range from 1–400 Hz. Then the resulting viscoelastic parameters were substituted into Eq. (4) to obtain the velocity values at each frequency. These points formed a fitted curve based on the original dispersive data. Such a fitted curve can demonstrate the performance of viscoelastic parameters for predicting the dispersive behavior of liver beyond the frequency range of the original dispersive data.
Results
Figure 2 shows the mean storage modulus and loss modulus of the complex shear modulus over the six rats, as measured by rheometry. A typical shear wave displacement measured by SDUV and its amplitude in frequency domain are shown in Fig. 3. This figure also shows the corresponding k-space spectra which are obtained by constructing the two-dimensional Fourier transform (2D-FT) of the temporal-spatial signals of shear wave displacement. The k-space spectral can also be used to calculate the phase velocities of shear wave by measuring the peak spatial frequency at discrete temporal frequencies. The corresponding phase shifts at different distances for the frequencies of 100–400 Hz is illustrated in Fig. 4. The lines of linear regression and results of shear wave velocities were also shown in this figure. Table 1 lists the coefficient of determination (
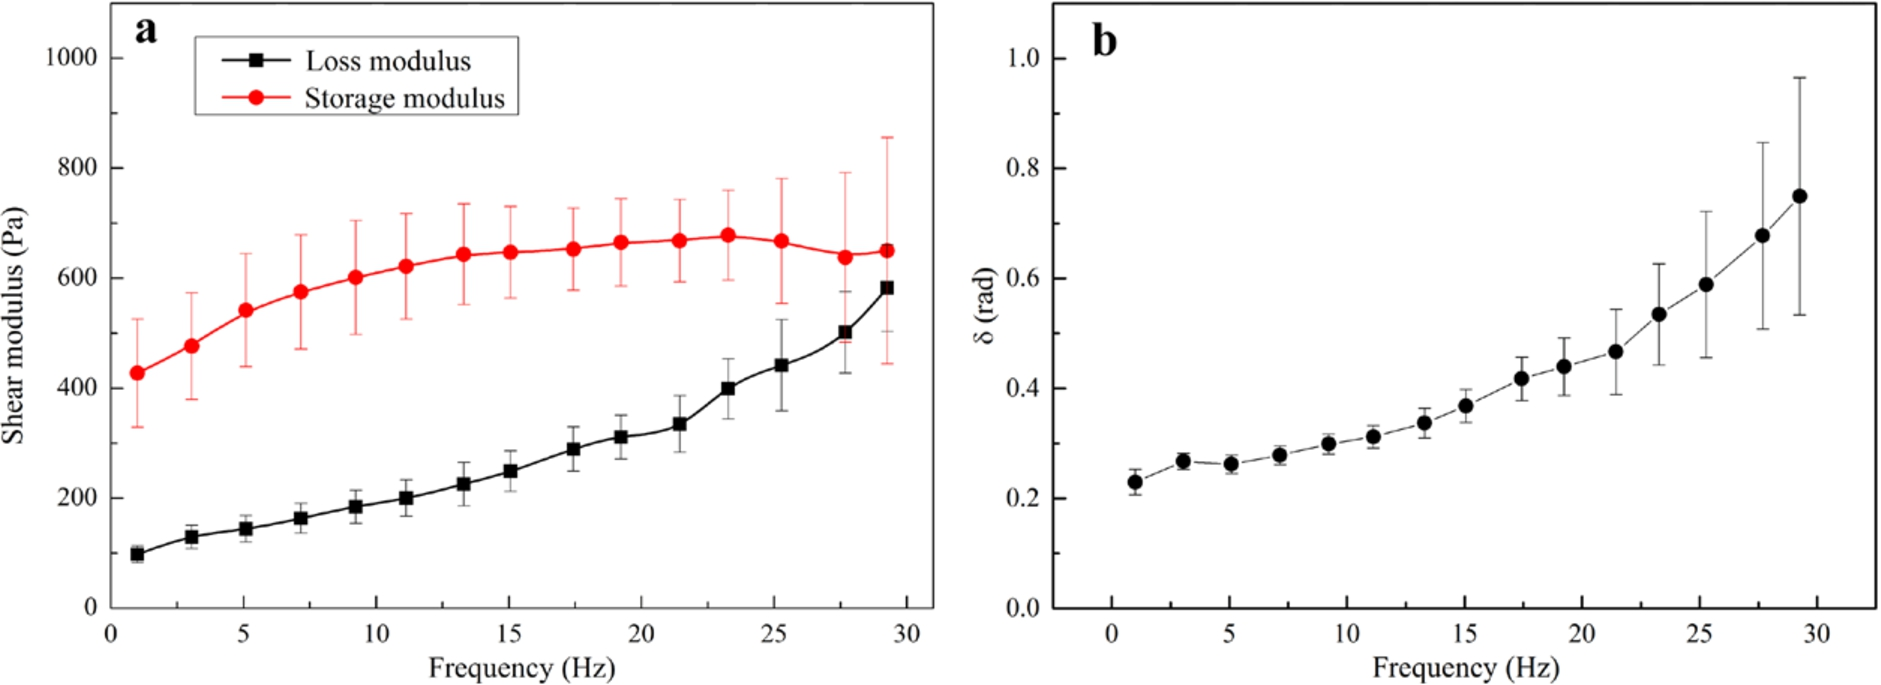
Shear moduli in the frequency range 1–30 Hz obtained by rheometry. The definitions of shear moduli and phase shift angle are given in Eq. (1). The circles or squares are the mean values over the six rats and the horizontal bars are the standard deviations.
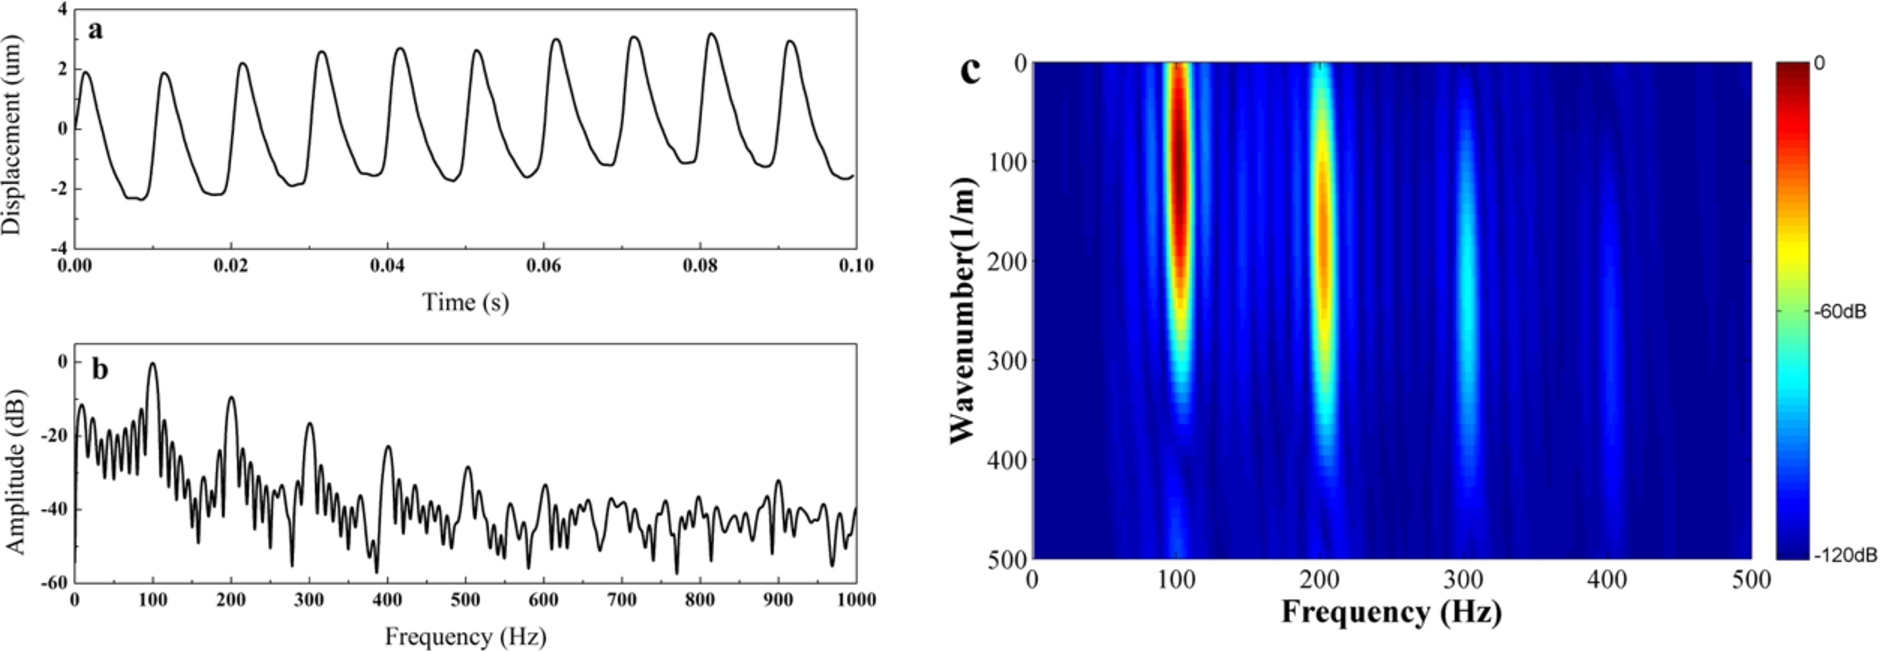
(a) Tissue displacements over time (b) frequency spectrum of a typical vibration displacement and (c) two-dimensional k-space spectra.
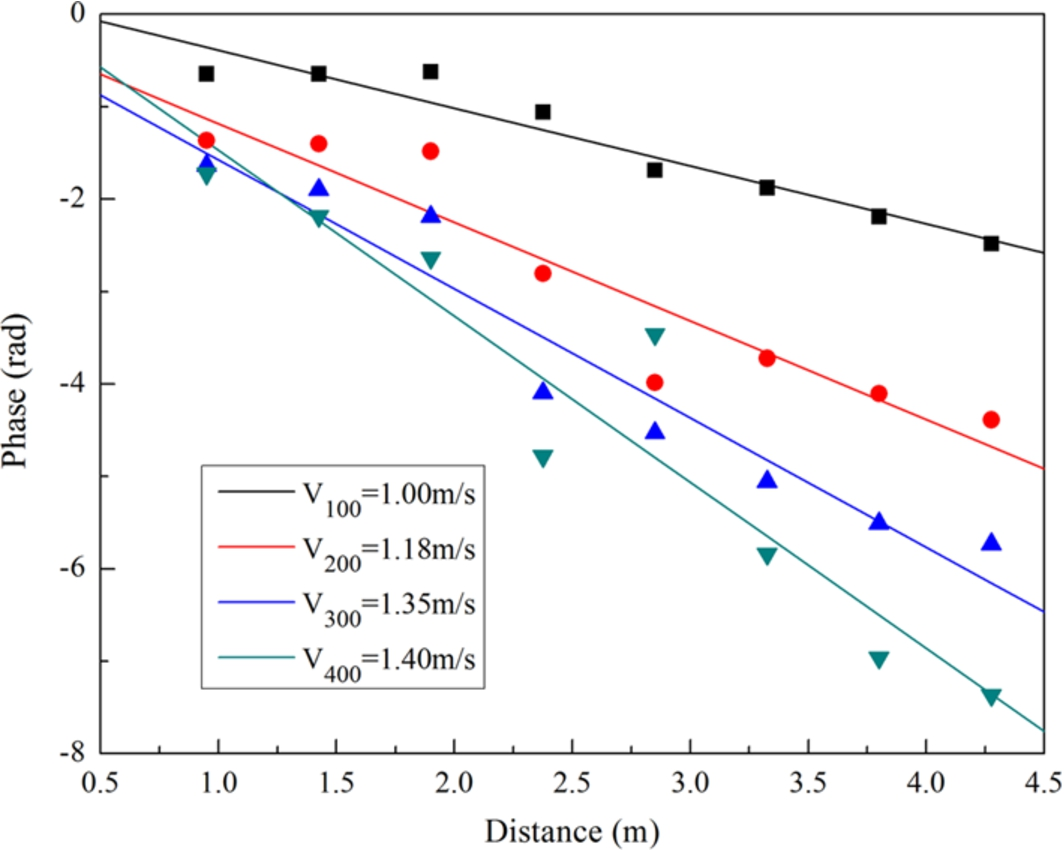
Phase shifts at different locations and the results of linear regressions for the frequency of 100, 200, 300 and 400 Hz.
The coefficient of determination (
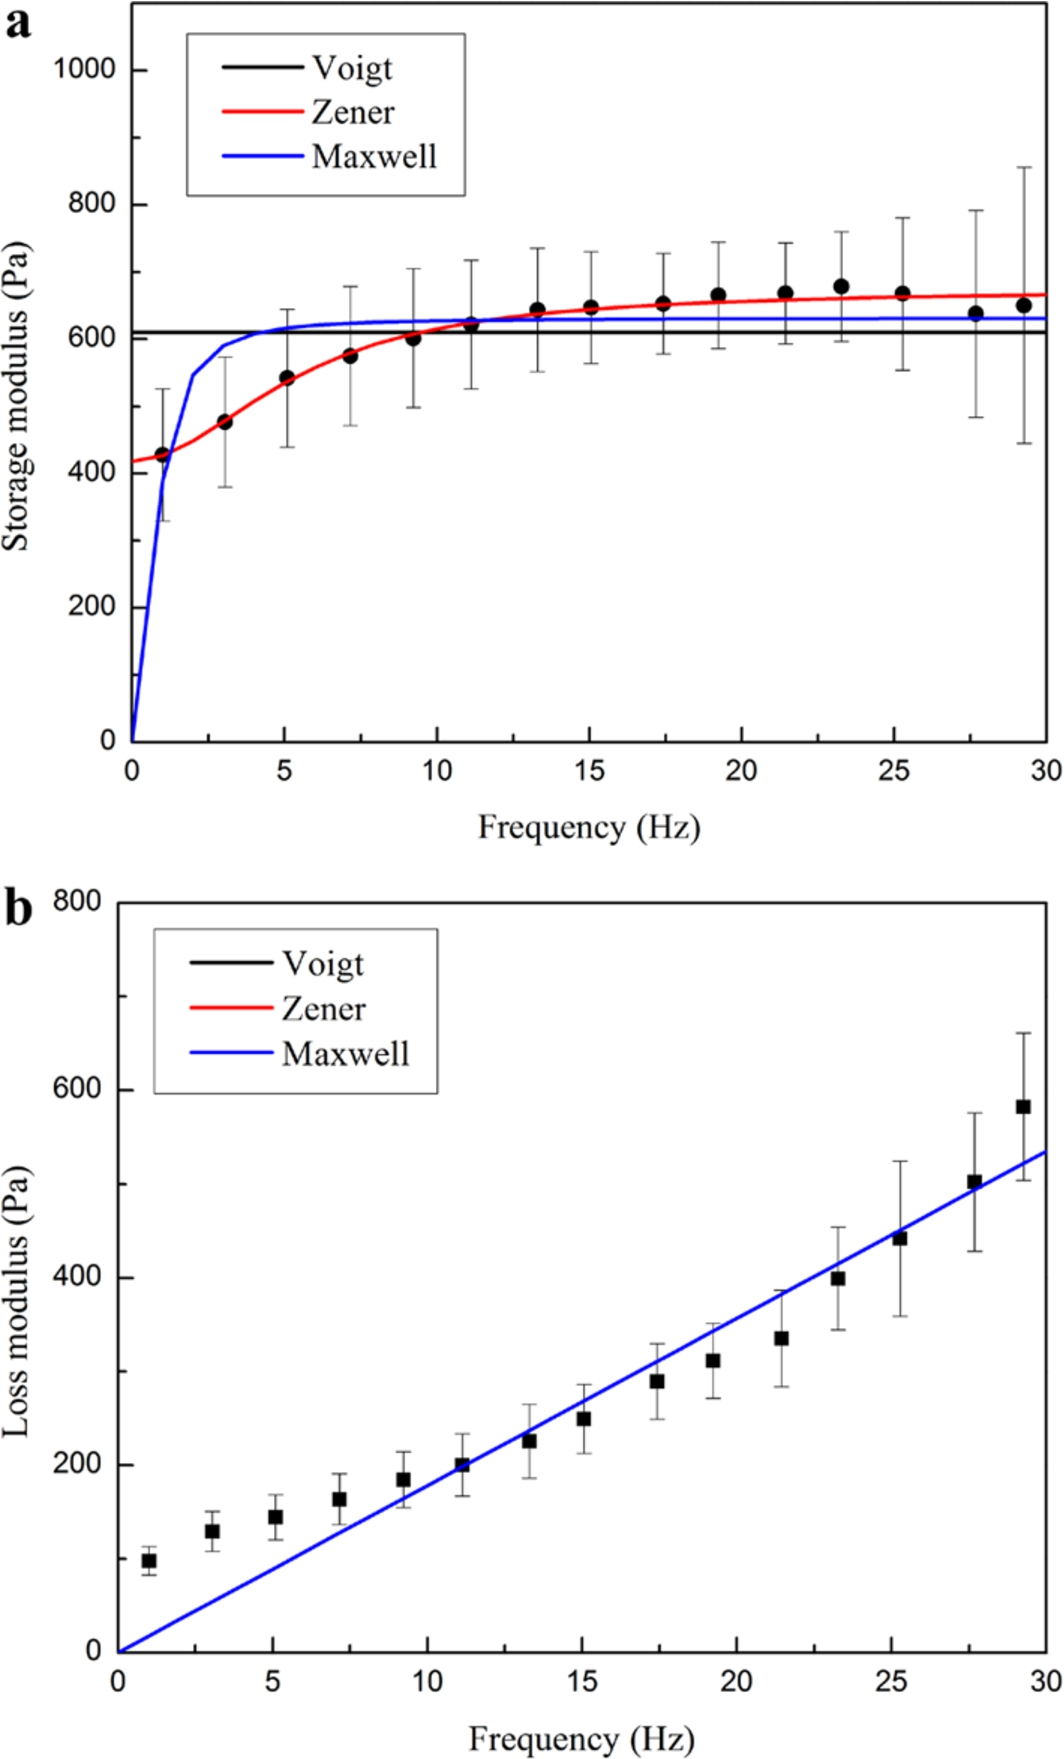
The storage and loss shear moduli measured by rheometry and the corresponding fitted curves for each model. The circles are the mean values over the six rats and the horizontal bars are the standard deviation. The three fitted curves in (b) are almost coincident.
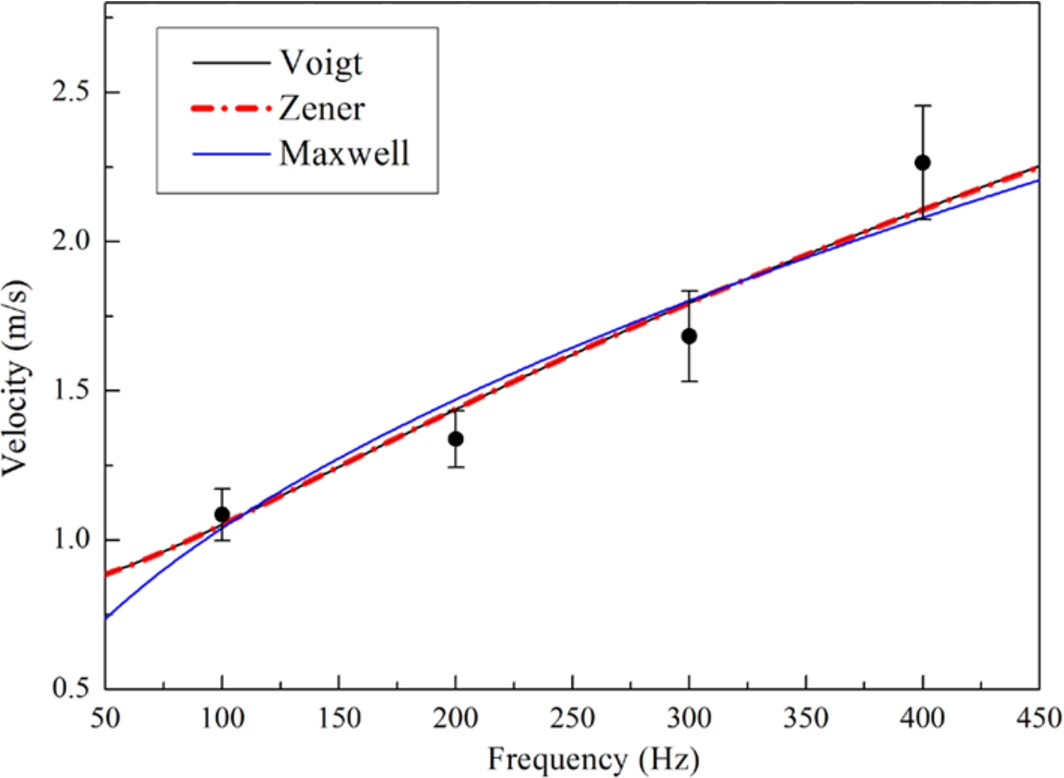
Dispersive velocity data measured by SDUV and the corresponding fitted curves for the models. The circles are the mean values over the six rats and the horizontal bars are the standard deviations. The curves for the Voigt (black solid line) and Zener (red dash-dot line) models are very close.

Fitted curves using the combined data from the rheometry and the ultrasound for each model. The circles are the mean values over the six rats and the horizontal bars are the standard deviations. The curves for the Voigt (black solid line) and the Zener (red dash-dot line) models are almost coincident.

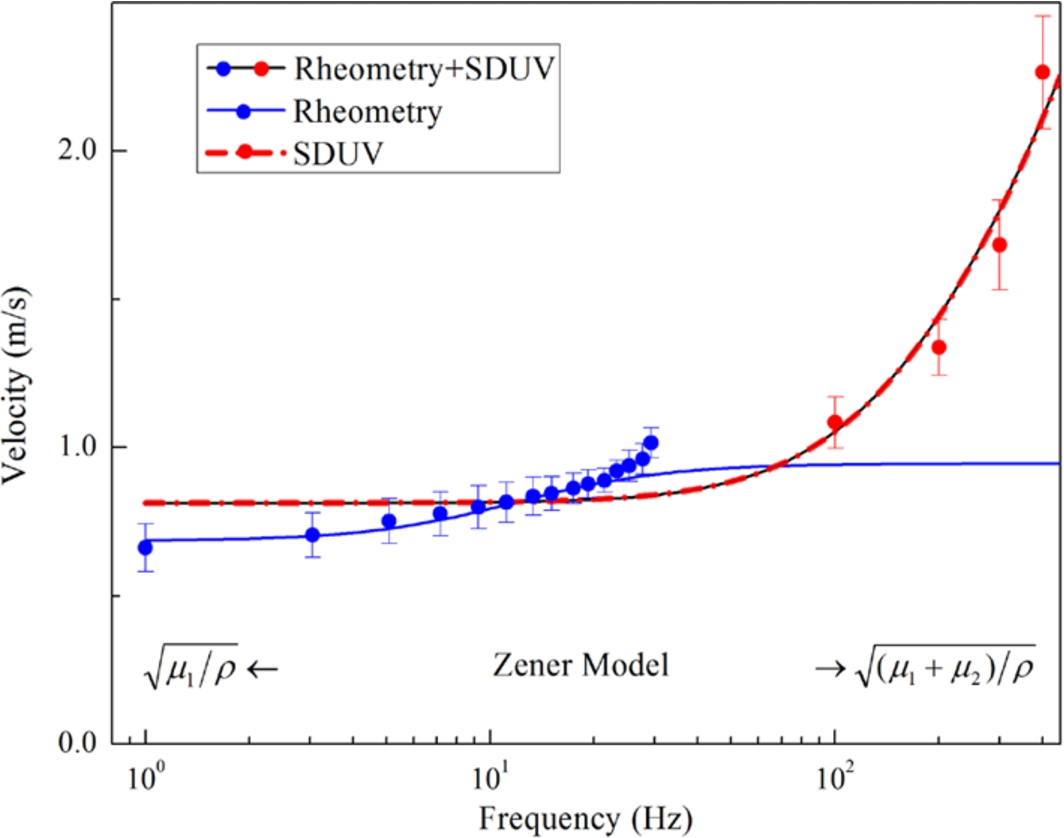
The fitted curves using dispersive velocities from rheometry (1–30 Hz) (blue solid line), SDUV (100–400 Hz) (red dash-dot line), and a combination of rheometry and SDUV (1–400 Hz) (black solid line) separately for the Voigt model. The circles are the mean values over the six rats and the horizontal bars are the standard deviations. The expressions next to the arrows give the low frequency limit (←) and the high frequency limit (→) of the velocity derived from Eq. (4).
The fitted curves using dispersive velocities from rheometry (1 Hz to 30 Hz) (blue solid line), SDUV (100 Hz to 400 Hz) (red dash-dot line), and a combination of rheometry and SDUV (1 Hz to 400 Hz) (black solid line) separately for the Zener model. The circles are the mean values over the six rats and the horizontal bars are the standard deviations. The expressions next to the arrows give the low frequency limit (←) and the high frequency limit (→) of the velocity derived from Eq. (4).
Viscoelastic parameters using the data from rheometry, SDUV, and a combination of the two methods for the Voigt model
Viscoelastic parameters using the data from rheometry, SDUV, and a combination of the two methods for the Zener model
The traditional standard for assessing the viscoelastic properties of soft tissue is a rheological test. However, this method can only be applied to in vitro samples and cannot be used in clinical situations. Elastography is a new imaging modality for noninvasively quantifying the viscoelastic properties of soft tissue, and it has the potential to be an alternative to the rheological test for clinical applications. Therefore, it is necessary to validate the results of elastography using classical rheological tests.
A variety of commercial rheological instruments, like the oscillatory rheometer and dynamic mechanical analysis (DMA), can measure shear moduli of viscoelastic materials. However, a constraint of rheological devices is their limited frequency range for viscosity measurements. Most commercial devices use frequencies less than 50 Hz, and cannot assess high-frequency viscoelastic properties of biological soft tissue. On the other hand, dynamic elastography techniques usually use a broad frequency range, such as 95–380 Hz [18], 60–600 Hz [19], and 100–400 Hz [21]. One exception is the MRE method proposed by Klatt et al., which used a low frequency range of 25–62.5 [33]. Therefore, reliable tools to dynamically characterize soft tissues over wide frequency ranges are needed to provide gold standard references. Some custom-built instruments have been developed to provide a broad range of frequencies for comparison with elastography [36,37]. However, none of them are easily produced. Hence most studies use classical rheological instruments with a low frequency range to validate the results of elastography obtained for a high frequency range [28,30,38]. The study of Klatt used the same frequency ranges for both elastography and rheological test because of the specific MRE elastography technique used in that study. Another exception is the work of Montagnon et al., in which a high-frequency rheoscopic instrument was used to compare ultrasound elastography measures of polymeric material over the same range of frequencies (200–450 Hz) [39]. The present study used 100–400 Hz for elastography and 1–30 Hz for rheometry. Although it is better to use the same frequency range for direct comparison, in the present study we have used the frequency ranges of the specific elastography method and instrument used, similar to most of the studies mentioned above.
The present study shows that the elastic modulus obtained by SDUV is very close to that of rheometry (Tables 2 and 3), which is consistent with previous studies, although the frequency range of direct mechanical testing was lower than that of elastography in these studies [28,30,38]. However, the viscosity estimates of the two methods were significantly different. Since viscosity significantly depends on the frequency used for measurement, it is not reasonable to directly compare the viscosity results obtained by the two methods. Instead we proposed to combine the dispersive data of the two methods to explore the effect of frequency on the viscoelasticity measurement. Although a previous study also compared ultrasound elastographic measurements and classical rheology using a similar approach method [40], the present study obtained novel results in a more quantitative way (Tables 2 and 3). Three kinds of dispersive curves, which were obtained by using low frequency rheometry data (1–30 Hz), high frequency SDUV data (100–400 Hz), and overall data (rheometry + SDUV, 1–30 Hz and 100–400 Hz) are shown separately in Figs 8 and 9 as they fit the Voigt and Zener models, respectively. These figures show that the curves that were calculated using the low frequency rheometry data diverged from the high frequency data that had been collected by the SDUV method; whereas the curves that were calculated using the high frequency SDUV data were in good agreement with the low frequency data that had been collected by rheometry. Furthermore, the rheometry + SDUV curve using the overall data coincided almost exactly with the curve using the high frequency SDUV data. These observations indicate that the high frequency components of the dispersive curve play a much more important role than the low frequency components. The curve shape or dispersive pattern is primarily determined by the high frequency components. The findings can also be confirmed by the results shown in Tables 2 and 3, in which the viscosity values obtained from the high frequency SDUV data were very close to those from the overall rheometry + SDUV data but different from those obtained from the low frequency rheometry data. In other words, the dispersive data measured by SDUV (100–400 Hz) can reflect the rheological behavior of liver over a wide range of frequencies (1–30 Hz and 100–400 Hz).
The results of elastography and rheometry can represent the viscoelastic properties of liver in different frequency ranges. As shown in Figs 5 and 6, the three models fit the measured elastography and rheometry data reasonably well when they were applied to the low and high frequency ranges separately. Previous studies of elastography have investigated different models by fitting the models with dispersive data from liver [25,33]. However, as illustrated in Fig. 6, curves of the three models are very close to one another in the frequency range of elastography. Therefore, it is hard to decide which model is more appropriate if only elastographic data is used. In this study, when the two methods were combined to expand the frequency range, we obtained very different results. Figure 7 clearly shows that, if the entire frequency range is considered, the dispersive data are in good agreement with the Voigt and the Zener models but in disagreement with the Maxwell model. This finding indicates that the Maxwell model is not as appropriate as the Voigt and Zener models for describing the rheological behavior of liver.
The present results suggest that the Voigt and the Zener models are very close when they used to describe the rheological behavior of liver with measurements up to 400 Hz. As shown in Fig. 7, when using the dispersive data from 1 to 400 Hz, the fitted curves for the Voigt and the Zener models are almost coincident in the frequency range up to 400 Hz. However, the Voigt model contains two parameters (
One limitation of the present study is that shear wave attenuation due to viscous effects and wave diffraction were not considered in the ultrasound measurement. As shown in Eq. (4), these models used only the velocity without attenuation. Neglecting attenuation may contribute to the uncertainty of these models and induce a bias when solving for the elastic and viscosity parameters from these models. In contrast, the rheometry tests measured both
Conclusion
The elasticity measured by SDUV was in good agreement with that of rheometry. However the viscosity measured SDUV was significantly different from that of rheometry because the viscosity is highly influenced by the specific frequencies used for measurement. By combining the dispersive data from the two methods, we found that the high frequency components of the dispersive data play a much more important role in determining the dispersive pattern or the viscous value than the low frequency components.
Footnotes
Acknowledgements
This work was supported by the National Natural Science Foundation of China (Grant No. 81471735, 81570552, 61427806, 61372006, 61101025, 81601510), the National Science & Technology Pillar Program (2015BAI01B02), and National Natural Science Foundation of Guangdong Province (Grant No. 2016A030310047). The authors appreciate the suggestions and English editing of Rhoda and Edmund Perozzi.