
Abstract
BACKGROUND:
Human blood is a thixo-elasto-visco-plastic (TEVP) material that exhibits unique fluctuations in mechanical properties based on physiology, and shear rate. We demonstrate new visual tools to help visualize and characterize these varied mechanical properties.
OBJECTIVE:
Our objective is to demonstrate contemporary visual and numerical tools to help visualize and characterize the varied mechanical properties of human blood.
METHODS:
Using the ARESG2 strain-controlled rheometer with double wall couette geometry and eight human blood donors, with lab test results, elastic and viscous properties are investigated using Series of Physical Processes (SPP) and MITLaos to both analyze and visualize the mechanical signatures of the blood.
RESULTS:
Variations of mechanical properties are shown via SPP generated Cole-Cole plots and MITLaos analysis. These variations are a function of physiological properties of blood on the day of the blood draw based on hematocrit, fibrinogen, cholesterol, triglycerides, and a host of other proteins and constituents. Each rheological experiment with blood is replicated with an analogous experiments with 0.04 wt% xanthan in glycerol, and water to demonstrate that the mechanical properties of the human blood, and its rheological signatures are unique to human blood.
CONCLUSIONS:
Human blood is proven to be a TEVP material, as shown on a series of Cole-Cole plots for eight different donors, at two different frequency and strain amplitude combinations. Variations in Cole-Cole plots for each donor are shown. MITLaos average mechanical properties are calculated and shown. Aggregated elastic and viscous projections and a Cole-Cole plot is shown for Donors 1–8, along with 95% confidence interval.
Introduction
The rheological investigation of human blood has had a resurgence with several recent thixo-elasto-visco-plastic models developed for use with blood, as well as an invigorated rheological analysis framework [1–10]. This has resulted in opportunities to characterize human blood rheologically, and to correlate physiological parameters, mechanical properties, rheological model parameters and the establishment of a “baseline”, or normal, non-pathological, mechanical fingerprint of human blood. This view of non-pathological blood can be used for development of bioengineered materials for human use [11–15]. For example, the incorporation of the rheological properties of blood in medical diagnostics, and its contribution to the development of a human blood substitutes.
Investigations of human blood are nothing new, as there has been rheological tests performed on human blood since the 1960s that have shown that hematocrit, fibrinogen, plasma lipids, and total serum protein play a role in the viscosity of blood [16–19]. However, the preponderance of these experiments were conducted via steady shear experimental protocols. To this, Bureau and co-workers added a series of groundbreaking triangle ramp experiments [20–25]. Although there are well-established records of blood rheology experiments, their collective impact on the medical community has been minimal [20–23,26]. This is in part due to fact that human blood is extremely complex, and differs from person to person based on several physiological parameters, such as total cholesterol, fibrinogen, hematocrit, triglycerides, etc. Blood is a complex material, in that depending on applied stress, or shear rate, there are both ‘solid-like’ and ‘liquid-like’ properties simultaneously. Hence, it is categorized as a thixo-elasto-visco-plastic material. In that there is a thixotropic, or microstructure consisting of rouleaux, which are stacks of red blood cells. The rouleaux are loosely held together and highly influenced by the imposed shear rate of the blood flow [7,8,12,13,24,25,27]. The elasticity comes from the stretching of the rouleaux, which also introduces temporary plasticity that is distinct from the irreversible stretching and breaking apart of the rouleaux. In addition, there is a non-Newtonian viscosity that is highly influenced by the shear rate of blood. The rouleaux contribute to the overall viscosity of blood and contribute to the mechanical properties of blood. Sousa and coworkers demonstrated that human blood could be tested using a rotational, stress-controlled rheometer. Due to the low viscosity of human blood, we enhanced the rheometer tooling to a double wall Couette for maximum surface area contact with the blood during the rheological experiments (schematic provided in Fig. 1 below). Sousa and coworkers also investigated the effect of the anticoagulant ethylenediaminetetraacetic acid (EDTA) on human blood, which when used at certain concentrations, had no impact on shear viscosity [25].
In this work we not only focus on the collection of data, but also advocate for a series of rheological experiments to enable a fuller characterization of steady state parameters of human blood like yield stress, elastic modulus, and viscosity; and of the time constants associated with viscoelastic and thixotropic evolution. In addition, we advocate for and demonstrate the effectiveness of large amplitude oscillatory shear (LAOS), and in parallel, an analysis framework for LAOS that will elucidate the structure-rheology relationship that exists between current structure, rheological and simultaneous mechanical properties.
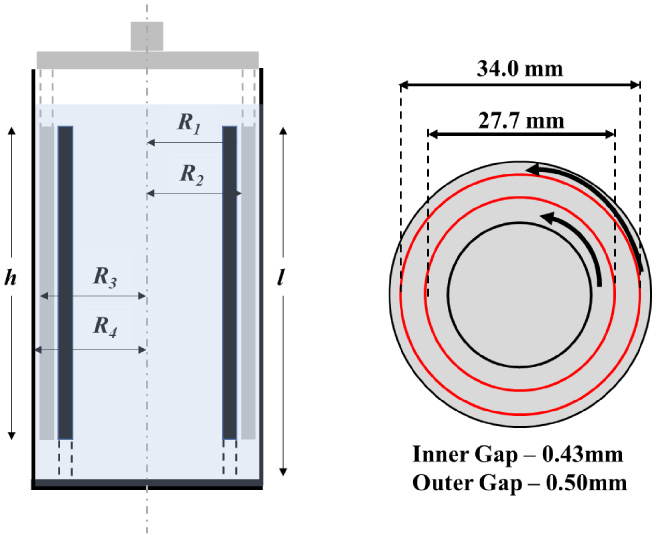
Schematic of the measuring system, double wall Couette, used with the ARES G2 rheometer. Dimensions shown are as follows: h = 49.5 mm; l = 50.5 mm; R 1 = 13.85 mm; R 2 = 14.28 mm; R 3 = 17.0 mm; R 4 = 17.5 mm. The bob is made of titanium, and the cup is made of stainless steel [7–9]. (The cup rotates, while the ‘double wall bob’ is stationary.)
Material and experimental protocol
This work utilizes human blood samples that were collected by a licensed nurse practitioner at the Nurse Managed Primary Care Center located at the University of Delaware STAR campus in compliance with the University of Delaware’s Institutional Review Board (Study Number 767478-2) [7–9,28]. While sitting, blood was drawn from the antecubital vein through a 21 G needle after the application of a tourniquet, into a 6 mL Vacutainer tube containing 1.8 mg/mL of EDTA. Each donor had previously fasted for 8–10 hours [5–7]. The protocol is consistent with guidelines established by the International Society for Clinical Hemorheology [7–9].
After withdrawal, each of the samples were rheologically studied within 45–60 min. All rheological tests were conducted using the ARESG2 strain-controlled rheometer from TA Instruments equipped with a double wall Couette geometry [7–9]. The rotational rheometer has high sensitivity with a minimum torque and angular frequency of 0.1 μNm and 1 μrad/s, respectively, and the double walled gap maximizes the stress sensitivity over the desired range of shear stress to yield minimum stresses of 0.6335 mPa and minimum shear rates of 3.34 × 10⁻⁵ s−1. The cup is made from stainless steel and the bob is made from titanium. A solvent trap is incorporated to minimize evaporation of the samples [7–9,28]. The gap is 0.5 mm for the outer gap and 0.43 mm for the inner gap. The volume of sample required is 5 mL. This geometry minimizes free surface area, offers a relatively long vertical length to minimize sedimentation, has a large measurement gap relative to red blood cells, and a large measurement area for accurate measurments. Lastly, the construction materials of the tool utilized have shown not to interact with blood significantly [7–9].
The first sample from each donor was introduced directly to the ARES-G2 rheometer, while the remaining samples were sent for physiological testing. The results of the physiological tests for the donor are summarized in Table 1. This rheometer can measure shear rates over a wide range and has a minimum torque and angular frequency of 0.1 l Nm and 1 rad/s, respectively [7–9]. The geometry was selected to maximize contact surfaces and the vertical orientation, while minimizing interfacial area and required loading volume. All blood samples were measured at 37 °C [7–9,28]. This temperature was maintained using a Peltier temperature controller with a sensitivity of 0.1 °C. To minimize effects of aging, all measurements were completed within 4 h of withdrawal. The sample was loaded into the measurement geometry using a 5 ml syringe equipped with a 21 G needle. A solvent trap was used to minimize effects of evaporation, and the samples were allowed 5 minutes to equilibrate to the temperature before testing [7–9]. To prevent damage to the red blood cells, shear rates of the rheometer never exceeded 1000 s−1. A pre-shear of 300 s−1 for 30 s was implemented between subsequent tests to remove any memory effects from the previous test. The results for Donor 1–8 are listed in Table 1 [7–9]. We have kept our rheological experiments in the four-hour window for all donors recommended by Horner and Beris, as they point out that ex-vivo aging affects the deformability and aggregation state of the red blood cells. In turn, clinical studies have been performed on this phenomenon, documenting changes in red blood cells with extended storage. Results have shown that red blood cells become less deformable with increased storage time. Deformability of the red blood cells is critical and aging of blood beyond four hours produces irreversible changes in the red blood cells ability to deform that affect the viscosity [7].
All the rheological tests are compared to a 0.04 wt% xanthan gum in glycerol solution as a metric of comparison. The xanthan gum was supplied by MP Biomedicals, LLC (Lot No. Q1844), and glycerol supplied by Fisher Chemical (Lot No. 153401). This was done to demonstrate that the rheological changes observed from different donors were in fact due to physiological differences [7,29]. Additionally, Horner and Beris made the following determinations: they showed that the changes for a xanthan gum sample are very close to the specified machine limitations; Horner and Beris also ‘binned’ the ex vivo changes that blood undergoes into an “aging” phenomenon which were explicitly quantified for short times and long times to provide an estimate of errors in the experimental results. This aging process includes protein absorption to the interface which is specifically mentioned by these researchers here [7]. Anecdotally, Horner and Beris conducted unpublished experiments to address protein absorption to the interface including remixing the sample periodically and running a sample in a separate vacutainer after a certain period and did not notice significant differences from just keeping the sample in the rheometer indicating that the effect of protein absorption is small compared to the biophysical changes that blood undergoes when taken from the body. The double walled Couette was specifically chosen to mitigate this effect as the geometry contains a small free surface area. This is one of the reasons why cone and plate or parallel plate measurements are never as good for blood, and not used here.
Cokelet and Meiselman have reported that the plasma proteins at the blood air surface of the rheometer form a protein layer of film that led to difficulty measuring rheological properties. Furthermore, they articulate that this effect is only a significant problem for plasma, serum and RBC-plasma or RBC-serum suspensions at very low hematocrit. At normal hematocrits, the additional torque due to this film is only a small percent of the total [30]. This reference provides a set of sample data for plasma, on a cone and plate rheometer. We have minimized this effect by using a double wall couette with minimal contact with air, and whole human blood, with normal hematocrit values [30]; based on this reference we estimate the potential error to the viscosity is no more than +0.375 mPa s, or the stress measurement no more than 0.0375 Pa at shear rates below 100 s−1. This is based on an estimate using the data provided for pure plasma, taken with a cone and plate rheometer [30].
For decades, the main rheology experiments have been the steady state flow curve, and small amplitude oscillatory shear tests, amplitude, and frequency sweeps, for analysis of the rheology of human blood [3,12,13,21–25,27]. These rheological protocols should be the starting point of any rheological analysis of a complex material, including human blood. From the steady state flow curve, the determination of both infinite shear viscosity, 𝜂 Inf and zero shear viscosity, 𝜂0 can be made. This allows for comparison of viscosity values between donors, and a potential analysis technique to gauge pathological health conditions. Small amplitude oscillatory shear involves probing the microstructure without causing microstructural degradation, thereby not able to provide information on the thixotropic timescales of evolution [27,31–33]. However, key information about elastic modulus, G, and 𝛾 c can still be obtained from the amplitude sweep. The steady state data can be utilized for standard thixo-elasto-visco-plastic (TEVP) rheological model’s steady state parameter fitting. The xanthan gum in glycerol is shown with the human blood in Fig. 2 below to demonstrate that it replicates the viscosity of human blood at moderate to high shear rates, but at low shear rates cannot replicate the apparent yield stress of human blood.

Steady state flow curve depicting total stress and viscosity. (gray points Donor 1; red points Donor 2; blue points Donor 3; green points Donor 4; orange points Donor 5; purple point Donor 6; pink points Donor 7; light points Donor 8; black points 5% (weigh) xanthan and glycerol solution) (solid points are stress; open points are viscosity). Closed and open Red stars are average stress and average viscosity, respectively of Donors 1–8 (95% confidence interval plotted for stress and viscosity in gray dashed line) (pure water in shown in Supplemental Material) [7].
From Fig. 2 the limiting viscosities are evident for each donor [27,31–33]. Blood is shown to have the character of a viscoelastic liquid in this linear viscoelastic region [20,34–37]. The authors point out that the steady state values of stress at each respective shear rate was obtained using the technique outlined in Horner et al. [7] that factors in the onset of the syneresis effect. Average values of stress and viscosity are plotted along with 95% confidence intervals using
To find the transient model parameters (i.e., those involving the time scale of viscoelastic and thixotropic evolution), there is a requirement for fitting to transient experiment rheological data to rheological models. For this, in general transient rheological experiments are needed and LAOS could suffice [10]. This allows for the determination of transient model parameters and an estimate of characteristic times of blood microstructural evolution.
With the model parameters established using steady state and step up/down in shear rate experiments, rheological models can also be compared using LAOS experiments. In addition, much critical information can be determined from the LAOS data. The focus here is the use of LAOS experiments, that speed up, then slow down, while changing direction, then speeding up and slowing down again twice per cycle. The LAOS is used to develop a unique rheological signature per donor, then used to compute an average elastic and viscous Lissajous figures to further identify what normal human blood’s mechanical property range is.
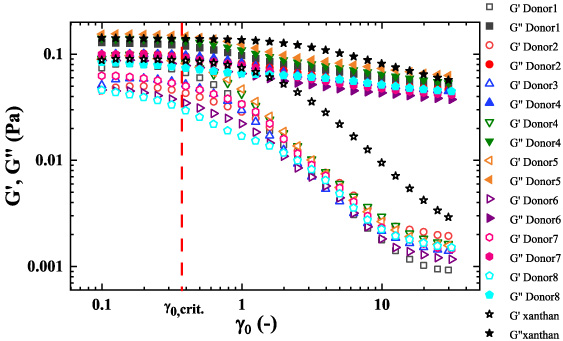
Small amplitude oscillatory shear amplitude sweep. (gray points Donor 1; red points Donor 2; blue points Donor 3; green points Donor 4; orange points Donor 5; purple point Donor 6; pink points Donor 7; light blue points Donor 8; 0.04 wt% Xanthan gum and glycerin black points) (solid points G ′′ ; while open points G ′ ). Donors 1–5 at 𝜔 = 12.6 (rad/s); Donor 6–8 at 𝜔 = 10.0 (rad/s) [7].
Small and large oscillatory shear flow are both based on a sinusoidal strain input given by 𝛾(t) = 𝛾0 sin(𝜔t), with the corresponding shear rate given by the first derivative with respect to time of strain,
LAOS implies that there are now meaningful values above noise for the third harmonic moduli. These moduli are constant values over a period of LAOS data at alternance [31–39]. Using these moduli, we can define the following metric that communicates when the third harmonic is relevant (above noise)
The raw human blood LAOS data in this study from the rheometer achieved steady alternance in 1–3 cycles, depending on strain amplitude, and smoothed with a Fourier series reconstruction based on the first 7 harmonics. For this effort, Series of Physical Processes (SPP) was incorporated due to its demonstrated flexibility to analyze viscoelastic signatures of the LAOS data for a more robust set of rheological experiments, and its use of every data point, unlike the Fourier and power series analysis as shown in Eqs (1) and (3), as a basis of analysis [31–39].
SPP uses the Frenet-Serret apparatus/formalism [40–44]. The framework treats the blood’s response to oscillatory shear as a trajectory or path in the three-dimensional space defined by:
Our below analysis of the elastic and viscous mechanical properties, along with the inference of the microstructure of human blood will involve 𝛿
t
. This metric allows for the differentiation between more/less ‘liquid-like’, and more/less ‘solid-like’, whereby, when
Following the work of Ewoldt and coworkers [35] we can incorporate Chebychev coefficients to decompose the stress into elastic and viscous components and thusly from Eq. (3) we can deconstruct the stress signal as follows
Interpretation Lissajous Bowditch projections and Cole-Cole plots
Figure 4 below is a legend for interpretation of elastic and viscous Lissajous projections shown in Figs 7–11 below. Figure 4(a) is the elastic projection where stress is plotted against the strain. If there is a straight diagonal line from lower left to upper right-hand corner in the elastic projection, this is indicative of a Hookean solid, where stress is linearly related to total stress by the elastic modulus, indicating a fully solid-like response. A perfect circle depicted in the elastic projection indicates a fully viscous signature and response. In Fig. 4(b), the viscous projection, a straight line represents a linear relationship between the stress and shear rate, with the two related by viscosity and correlates to a fully viscous, or liquid-like response. A circle depicted in the viscous projection is indicative of a solid. Human blood shows a combination of liquid-like and solid-like responses in both the elastic and viscous projection, which is indicative of a viscoelastic liquid. The solid-like contribution comes from the deformable, rouleaux, and is dependent on the shear rate. Higher shear rate tends to break the structure down more and yields a more liquid-like Lissajous-Bowditch projection. In lower shear rates, the opposite effect is observed.

(a) Elastic Lissajous Bowditch Projection with interpretation; (b) Viscous Lissajous Bowditch Projection with interpretation. (A fully elastic signal in the Elastic projection will be a diagonal line in the stress vs. strain figure while a fully viscous signal in the Elastic Projection will be a perfect circle. Conversely, a fully viscous signal in the Viscous Projection will be a diagonal line, while a fully elastic signal in the Viscous Projection will be a perfect circle; the purple ellipse shows a ‘viscoelastic’ signal in both projections.)
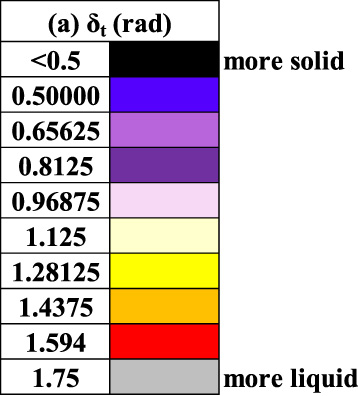
The Cole-Cole legend is shown in Fig. 5(a) taken from the following references [40,41,43,44]. The Cole-Cole trajectory is a plot of the transient viscous modulus

Figures 7 and 8 are constructed with Donor 1–8 LAOS data at a frequency of 1 (rad/s) and strain amplitudes of 𝛾0 = 1(−) while Figs 9 and 10 are at a frequency of 1 (rad/s) and strain amplitude of 10(−), while Fig. 11 has the 0.04 wt% xanthan and glycerol for comparison. The Cole-Cole plot is colorized with a color-mapping depicting 𝛿 t a metric for solid-like vs. liquid-like behavior as shown in Eq. (16). The color-map in Fig. 6 is used to depict a solid/liquid like behavior as the Cole-Cole plot trajectory proceeds. We incorporate the same color-maps, with identical scaling for Figs 7–12 for ease of comparison.
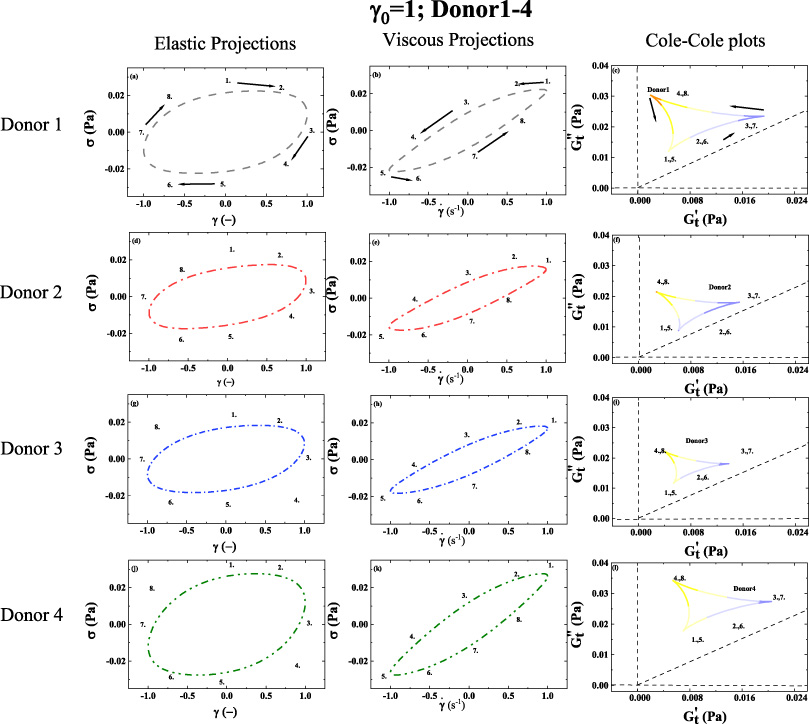
1st column: elastic Lissajous projection; 2nd column: viscous Lissajous projection; 3rd column Cole-Cole plots; (a–c) Elastic projection; Viscous projection; and Cole-Cole plot of Donor 1. (d–f) Elastic projection; Viscous projection; and Cole-Cole plot of Donor 2. (g–i) Elastic projection; Viscous projection; and Cole-Cole plot of Donor 3. (j–l) Elastic projection; Viscous projection; and Cole-Cole plot of Donor 4. (Lissajous Bowditch legend in Fig. 4; Cole-Cole Legend in Fig. 5; Color-mapping for 𝛿 t shown in Fig. 6; 𝛾0 = 1(−); 𝜔 = 1 (rad/s)). Arrows show the direction of movement. Numbers 1–8 show analogous points in trajectory over period of alternance. (Donor 1–4) (dataset 1–4, [46--49]). (Pure water in shown in Supplemental Material).
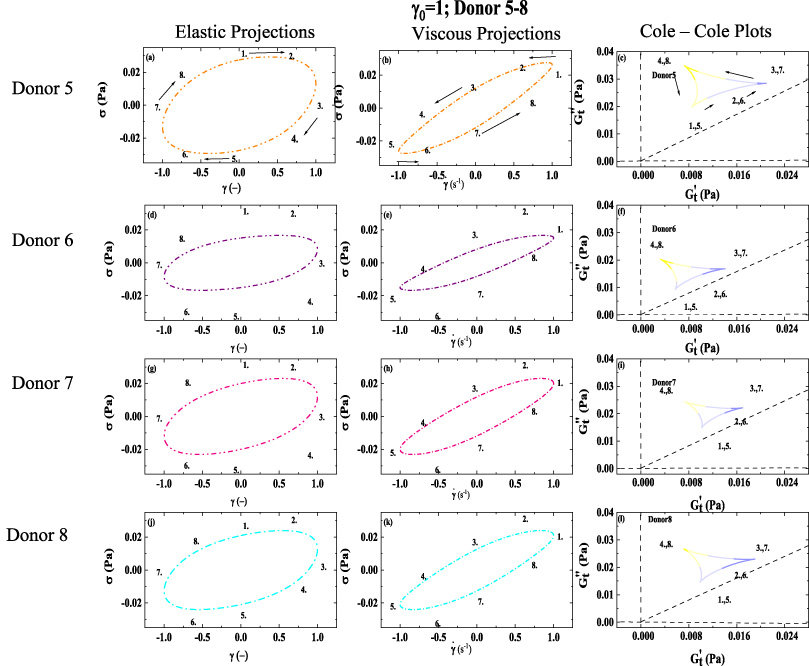
1st column: elastic Lissajous projection; 2nd column: viscous Lissajous projection; 3rd column Cole-Cole plots; (a–c) Elastic projection; Viscous projection; and Cole-Cole plot of Donor 5. (d–f) Elastic projection; Viscous projection; and Cole-Cole plot of Donor 6. (g–i) Elastic projection; Viscous projection; and Cole-Cole plot of Donor 7. (j–l) Elastic projection; Viscous projection; and Cole-Cole plot of Donor 8. (Lissajous Bowditch legend in Fig. 4; Cole-Cole Legend in Fig. 5; Color-mapping for 𝛿
t
shown in Fig. 6; 𝛾0 = 1(−); 𝜔 = 1 (rad/s)). Arrows show the direction of movement. Numbers 1–8 show analogous points in trajectory over period of alternance. (Donor 5–8) (dataset 5–8, [51--54]). (𝛾 and
To illustrate the depth and wealth of mechanical information that is contained within each LAOS experiment, Figs 7–12 show a series of displays to show evolving elastic and viscous properties side by side with metrics of ‘liquid-like’, ‘solid-like’, yielding, and reforming behavior. The series of figures are LAOS experiments with human blood at 𝜔 = 1 (rad/s) with 𝛾0 = 1(−) and 𝛾0 = 10(−) for Donors 1–8. Figure 5 the Cole-Cole mapping allow interpretation of relative magnitudes of elastic metric,
Figures 7–12 show graphically, how these processes are related and consistent. Each of the sets of figures at a different strain amplitude are labeled with numbers 1–8, to follow the changes together from each plot. Following the typical LAOS formalism, the strain starts at a value of zero at point 1, while the shear rate starts at a maximum value at point 1. With respect to interpretation of the projections, the closer the elastic projection is to a straight line, the closer the material is to a solid, with a constant elastic modulus, while when the viscous projections are closer to a straight diagonal line the material is completely liquid with a constant viscosity. We can see, however, that blood has simultaneous contributions from its solid-like and liquid-like qualities. The elastic projection shows the stress vs. strain to visualize the relationship 𝜎 = G𝛾, where the elastic modulus is the constant of proportionality. Analogously, the viscous projection depicts the stress vs. shear rate to visualize the relationship
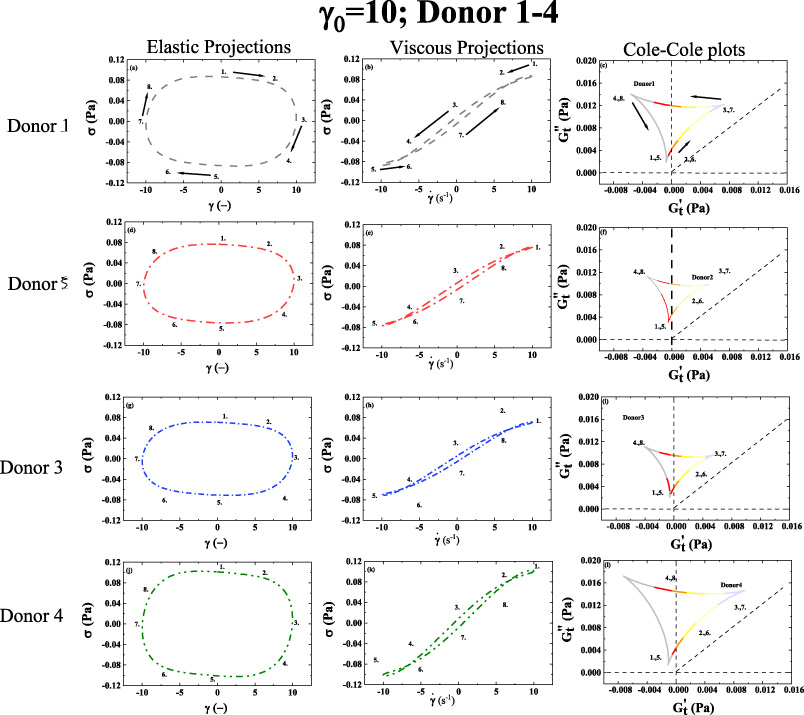
1st column: elastic Lissajous projection; 2nd column: viscous Lissajous projection; 3rd column Cole-Cole plots; (a–c) Elastic projection; Viscous projection; and Cole-Cole plot of Donor 1. (d–f) Elastic projection; Viscous projection; and Cole-Cole plot of Donor 2. (g–i) Elastic projection; Viscous projection; and Cole-Cole plot of Donor 3. (j–l) Elastic projection; Viscous projection; and Cole-Cole plot of Donor 4. (Lissajous Bowditch legend in Fig. 4; Cole-Cole Legend in Fig. 5; Color-mapping for 𝛿
t
shown in Fig. 6; 𝛾0 = 10(−); 𝜔 = 1 (rad/s)). Arrows show the direction of movement. Numbers 1–8 show analogous points in trajectory over period of alternance. (Donor 1–4) (dataset 1–4, [46--49]). (𝛾 and

1st column: elastic Lissajous projection; 2nd column: viscous Lissajous projection; 3rd column Cole-Cole plots; (a–c) Elastic projection; Viscous projection; and Cole-Cole plot of Donor 5. (d–f) Elastic projection; Viscous projection; and Cole-Cole plot of Donor 6. (g–i) Elastic projection; Viscous projection; and Cole-Cole plot of Donor 7. (j–l) Elastic projection; Viscous projection; and Cole-Cole plot of Donor 8. (Lissajous Bowditch legend in Fig. 4; Cole-Cole Legend in Fig. 5; Color-mapping for 𝛿
t
shown in Fig. 6; 𝛾0 = 10(−); 𝜔 = 1 (rad/s)). Arrows show the direction of movement. Numbers 1–8 show analogous points in trajectory over period of alternance. (Donor 5–8) (dataset 5–8, [51--54]). (𝛾 and
Figure 11 below shows the identical rheological experiments conducted with the xanthan gum in glycerol solution to demonstrate that the stress recorded for human blood during our LAOS experiments is unique to human blood, especially for the LAOS experiments conducted at strain amplitude 1 (−). The xanthan gum and glycerol viscous projection is drastically different than that of blood potentially indicating that at 𝛾0 = 1(−), 𝜔 = 1 (rad/s) combinations the human blood still has appreciable contributions to viscosity from rouleaux. The analogous elastic projection and Cole-Cole plot for xanthan gum and glycerol shows almost no elasticity at all, which is different than what is depicted for human blood in Figs 7–8, due to the elasticity from the rouleaux at low shear rates.

1st column: elastic Lissajous projection; 2nd column: viscous Lissajous projection; 3rd column Cole-Cole plots; (a–c) Elastic projection; Viscous projection; and Cole-Cole plot of 0.04 wt% Xanthan and glycerin at 𝜔 = 1 (rad/s); 𝛾0 = 1(−); (d–f) Elastic projection; Viscous projection; and Cole-Cole plot of 0.04 wt% Xanthan and glycerin at 𝜔 = 1 (rad/s); 𝛾0 = 10(−). (Lissajous Bowditch legend in Fig. 4; Cole-Cole Legend in Fig. 5; Color-mapping for 𝛿
t
shown in Fig. 6; 𝛾0 = 10(−); 𝜔 = 1 (rad/s)) [7] (dataset 9, [55]). (𝛾 and
Figure 12 below shows the aggregated elastic projection, viscous projection, and Cole-Cole plots for Donors 1–8 at frequency of 1 (rad/s) and strain amplitudes of 1 (−) and 10(−) to create a ‘normal human blood’ signature of mechanical properties to compare individual results as shown in Figs 7–10. This again could facilitate identification of abnormal blood physiology through mechanical property comparison. The color mapping shown in the Cole-Cole plots depicted in Fig. 12c,f, utilize the same color mapping (as shown in Fig. 6) for comparison with the 𝛿 t values from Figs 7–10. One can immediately observe that at the lower shear rate there is less ‘liquid-like’ behavior and simultaneously more ‘solid-like’ behavior; and the opposite is true at the higher shear rates. Ostensibly due to the more ‘solid-like’ character of the rouleaux that are present at the lower shear rates of the smaller strain amplitude LAOS experiments. 95% confidence intervals are depicted as well.
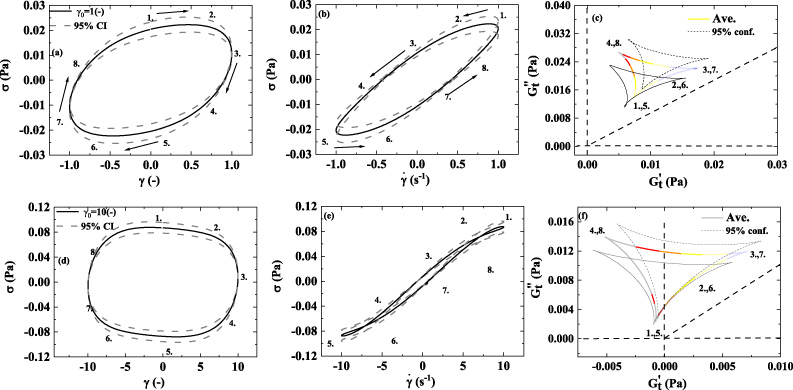
1st column: elastic Lissajous projection; 2nd column: viscous Lissajous projection; 3rd column Cole-Cole plots; (a–c) Elastic projection; Viscous projection; and Cole-Cole plot of the average stress of blood, of Donors 1–8 at 𝜔 = 1 (rad/s); 𝛾0 = 1(−) with 95% confidence intervals; (d–e) Elastic projection; Viscous projection; and Cole-Cole plot of average stress of human blood, of Donors 1–8 at 𝜔 = 1 (rad/s); 𝛾0 = 10(−) with 95% confidence intervals. (Lissajous Bowditch legend in Fig. 4; Cole-Cole Legend in Fig. 5; Color-mapping for 𝛿
t
shown in Fig. 6; 𝛾0 = 10(−); 𝜔 = 1 (rad/s)). (dataset 1–8, [46--54]). (𝛾 and
The trends from shown in Figs 7–8, are mirrored by the trends shown in Figs 9–10. Although, in Figs 9 and 10, the viscous projection is trending to more liquid-like due to the larger value of strain amplitude that is applied. There is still enough structure present to cross over the 45° line, while the structure is reforming as the shear rate approaches zero. Both set of Figs 7–8 and Figs 9–10 show to some degree that the human blood is indeed a viscoelastic material with elements of solid-like and liquid-like behavior for all the donors, albeit more viscous like at the larger strain amplitude and more solid like at the lower strain amplitude. This is because at the high shear rate there is not the solid like rouleaux (stacks of red blood cells) contributing to more elastic behavior. Relative to Figs 7–8, Figs 9–10 shows a smaller relative value of the elastic modulus, indicating in general there is less structure, less solid-like behavior due to the larger strain amplitude [40,41,43,44].
Based on the HCT values listed in Table 1 for all the donors, it is seen in Figs 7–10 that Donor 4 with the highest value of hematocrit is showing the highest value of stress. This corroborates the work of Moreno et al., and several other prominent work in the literature. Also, when comparing the stress signature between Donor 1 and Donor 2, one can see that both Figs 7 and 9 show that Donor 1 has the larger values of stress corroborating the literature that cholesterol contributes to the viscosity of human blood. Donor 1 and Donor 2 has similar values for the other constituents of blood that contribute to viscosity, and Donor 2 has the higher stress signal and total cholesterol.
According to the Cole-Cole plots shown in both Figs 7–10 the trajectory shows both shear thinning (as the shear rate increases the viscosity is decreasing), and strain stiffening (as the strain increases the elastic nature of the blood is increasing). This is corroborated in Table 2 using the MITlaos software, whereby all the values for e 3 are greater than zero indicating strain stiffening, and all the values for v 3 are less than zero, indicating shear thinning [18,35,36,38,39,45].
The trends in Figs 9–10, follow the previous trends from Figs 7–8 and we can now see that the color-mapping shown in Fig. 6 shows the material is more liquid-like for larger portions of the Cole-Cole trajectory because of the increase strain amplitude from 1 to 10 (−). In Figs 9–10, there are ‘secondary’ loops visible in the viscous projections. Typically, the secondary loops for when the time of thixotropic regeneration of microstructure is shorter than the time it takes for the shear rate to increase from zero to maximum value over the LAOS cycle. As the structure begins to reform over the LAOS cycle, it is broken down again as the shear rate increases. This effect is only observable for the larger values of strain amplitude at this frequency. This is evidence of the short-lived microstructure (rouleaux) that can reform over short times.
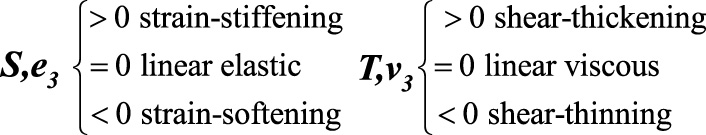
Note that the metrics developed from the MITLaos are consistent with our previous understanding of the strain thickening and shear thinning properties of human blood. Interestingly our benchmarking, comparison material, 0.04 wt% xanthan gum in glycerol is same order of magnitude of the strain stiffening index, S, and the shear thinning index, T, of Donor 1–8 average but not and identical match at both values of strain amplitudes 1(−) and 10(−). In addition, Table 2 provides the first and third harmonics of blood, xanthan gum, and water for the strain amplitude of 1 and 10(−), frequency of 1 (rad/s). Table 2 shows that the average first and third harmonics for blood in both cases are above those of water (with respect to order of magnitude the blood and water are of the same order of magnitude of the moduli for strain amplitude 10(−)).
We postulate that some of the viscoelastic differences depicted in Figs 7–10 could be a result of different physiological values of the cholesterol, and hematocrit [10] as shown in Table 1, as the hematocrit and fibrinogen values between donors are within 2% between Donor 1 and 2. It is known that the viscosity of blood is predominantly a function of hematocrit, fibrinogen, and total cholesterol concentration. Table 1 indicates that Donor 1 and Donor 2 have relatively similar concentrations of hematocrit and fibrinogen, however the discrepancy in total cholesterol may contribute to the difference in viscoelastic properties between Donor 1 and Donor 2. Although whole blood viscosity is determined by hematocrit and plasma viscosity, triglycerides along with LDL are the primary contributors of plasma viscosity, in addition to albumin [16–19]. Donor 1 has a cholesterol concentration of 244 mg/dL and triglycerides of 94 mg/mL, while Donor 2 has 147 mg/dL and triglycerides of 40 mg/mL. Figure 2 shows a difference in the zero-shear rate viscosity, and Figs 7–10 overall show more elastic (solid-like) and viscous signature. The shape and mass of HDL secreted into the blood from the liver and small intestine as empty, disk-like sacks that assume spherical shape as they fill with cholesterol esters [50] are likely contributing to the increased viscosity. Donor 4 has the highest value of hematocrit, and the highest values of viscosity in the elastic and viscous projections. Of the three physiological parameters known to effect viscosity the most from the literature, hematocrit, total cholesterol, and fibrinogen, based on our small data set and viscoelastic analysis using SPP and MITlaos we believe hematocrit has the most effect on total viscosity, followed by cholesterol with fibrinogen the least effect. These differences in physiology are contributing to unique viscoelastic signature as seen in elastic and viscous Lissajous-Bowditch figures, Figs 7–10 for Donors 1–8 as well as the Cole-Cole plots depicted in Figs 7–10 for Donors 1–8 shown above. In addition, the SPP viscoelastic methodology, and MITlaos both allow for a more detailed and nuanced exploration of the elastic (solid-like) and viscous (liquid-like) properties visually.
Conclusions
We have highlighted and shown various transient rheological experimental and analysis techniques with an analysis framework for large amplitude oscillatory shear flow that elucidates the critical viscoelastic and thixotropic time scales, mechanical signatures, as well as elastic and viscous signatures of oscillatory shear flow. We demonstrated this with human blood rheological data using a steady state flow curves and a series of LAOS experiments with varying strain amplitudes. SPP can demonstrate a connection to the known physics of rouleaux buildup and breakdown in transient shear flow and is consistent with changing elastic and viscous property of the material through a cycle of LAOS. In addition, our data suggests there is a correlation between cholesterol levels and viscosity as seen by Moreno and coworkers [20]. SPP and MITLaos together allow for a more robust and better visualization of the different elastic and viscous signatures potentially attributed to the different cholesterol concentrations in Donor 1 and Donor 2. SPP and MITLaos were also able to depict the effect of HCT on the stress of Donor 4 compared to Donors 1–3. The SPP legend shows how to determine where there is thinning-thickening and softening-hardening over a cycle of LAOS, and this is corroborated with MITlaos. We espouse the SPP and MITlaos analysis approach for LAOS data collected with human blood and propose this as a framework for more detailed rheological analysis that will show subtle physiological differences accurately, with a mechanical property focus. Average values, standard deviations, and 95% confidence intervals were shown to inform when human blood is out of its mechanically normal, or standard ranges, which could be a potential technique to diagnose pathology.
Footnotes
Acknowledgements
The authors acknowledge the support and funding assistance from the U.S. Army, and the Department of Chemistry and Life Science, United States Military Academy. The authors also acknowledge support in the form of helpful and insightful discussions with Dr. Jeff Horner, Dr. Antony Beris and Dr. Norman Wagner from the University of Delaware, Jeff Horner facilitated the collection of the rheological data at University of Delaware. The views expressed herein are those of the authors and do not reflect the position of the United States Military Academy, the Department of the Army, or the Department of Defense. The authors acknowledge funding assistance from NSF CBET 1510837 which the blood was collected through.
Declaration of competing interest
The authors declare that they have no known competing financial interests or personal relationships that could have appeared to influence the work reported in this paper.
Reproducibility of steady state rheological data
See Fig. A1.
Supplemental Material
Figure ![]() is the steady state flow curve for the pure water with the ARESG2 strain-controlled rheometer with double wall couette conducted at temperature of 37 °C. For water it appears that the instrumentation is most accurate, (aka. near accepted value of 0.6913 mPa s) above a shear rate of approximately 1 s−1, however the viscosity calculations are within the reported error of the instrumentation of (+∕−) 0.6335 mPa for the stress measurement.
is the steady state flow curve for the pure water with the ARESG2 strain-controlled rheometer with double wall couette conducted at temperature of 37 °C. For water it appears that the instrumentation is most accurate, (aka. near accepted value of 0.6913 mPa s) above a shear rate of approximately 1 s−1, however the viscosity calculations are within the reported error of the instrumentation of (+∕−) 0.6335 mPa for the stress measurement.
In order to show the small relative magnitude of both the G ′ and G ′′ signal of amplitude sweep with pure water the frequency used was 0.12566 (rad/s).
One can observe that the elastic and viscous projections show an almost completely viscous signal signifying that there is no elasticity or microstructure as seen in human blood. Additionally, the Cole-Cole plots do not show an evolution at all and are both consistent with purely viscous signatures at both strain amplitudes tested.