
Abstract
BACKGROUND:
Heart failure (HF) is a common disease globally. Ventricular assist devices (VADs) are widely used to treat HF. In contrast to the natural heart, different VADs generate different blood flow waves in the aorta.
OBJECTIVE:
To explore whether the different inflow rate waveforms from the ascending aorta generate far-reaching hemodynamic influences on the human aortic arch.
METHODS:
An aortic geometric model was reconstructed based on computed tomography data of a patient with HF. A total of five numerical simulations were conducted, including a case with the inflow rate waveforms from the ascending aorta with normal physiological conditions, two HF, and two with typical VAD support. The hemodynamic parameters, wall shear stress (WSS), oscillatory shear index (OSI), relative residence time (RRT), and the strength of the helical flow, were calculated.
RESULTS:
In contrast to the natural heart, numerical simulations showed that HF decreased WSS and induced higher OSI and RRT. Moreover, HF weakened helical flow strength. Pulsatile flow VADs that elevated the WSS, induced some helical flow, while continuous flow VADs could not.
CONCLUSIONS:
HF leads to an adverse hemodynamic environment by decreasing WSS and reducing the helical flow strength. Based upon hemodynamic effects, pulsatile flow VADs may be more advantageous than continuous flow VADs. Thus, pulsatile flow VADs may be a better option for patients with HF.
Introduction
Heart failure (HF) is a disease critically endangering human life. According to statistics, in Europe, the incidence rate of HF is over 1% [1]. Heart transplantation is the treatment of choice for patients with end-stage HF. However, the greatest impediment to transplantation is lack of a donor heart source matching the patient. Ventricular assist devices (VADs) have become an effective way to treat HF, as temporary bridges for heart transplantation [2] and as destination therapy [3]. In contrast to the natural heart, different VADs generate different blood flow waves in the aorta, such as continuous or pulsatile blood flow. At present, the characteristics of aortic arch hemodynamics under different velocity waves from ascending aorta generating far-reaching influence are still lacking comprehensive coverage. There are several studies investigating the impact of the shape of the inflow velocity profile in aortic hemodynamics. Morbiducci et al. investigated the inflow boundary conditions (BCs) for image-based computational hemodynamics in the human aorta. The authors concluded that the plausibility of the assumption of idealized velocity profiles as inlet BCs in personalized computational models can lead to misleading representations of the aortic hemodynamics both in terms of disturbed shear and bulk flow structures [4]. Pirola et al. conducted a computational study of aortic hemodynamics for patients with an abnormal aortic valve, and stressed the importance of the secondary flow at the ascending aorta inlet. They also found that a one-dimensional through-plane velocity profile could be a sufficient inlet BC for the evaluation of descending aortic flow and wall shear stress (WSS) [5]. Youssefi et al. studied the impact of patient-specific inflow velocity profile on hemodynamics of the thoracic aorta, and declared that computational fluid dynamics (CFD) analysis of the thoracic aorta needs to utilize fully patient-specific inflow BC to produce meaningful results [6]. Brown’s study investigated the importance of applying a realistic left ventricular assist device (LVAD) profile when evaluating assisted aortic flow fields and compared a number of potential anastomosis locations in a patient-specific aortic geometry. The results indicated that the ascending aorta was the optimal location for the anastomosis [7]. The aim of this study is to assess the impact of the human aorta arch with heart failure (HF) and different types of VADs. The analysis of the overall impact of healthy and deranged aortic hemodynamics could lead to an optimized, more physiological VAD assistance strategy. In the present study, CFD studies using patient-specific computational models were performed for the aortic arch under different inflow rate waveforms, including continuous flow and pulsatile flow, for normal physiologic conditions, HF, and severely reduced HF velocity waves. The inflow rate waveforms in the aorta mainly come from the literature and ultrasonic measurements of hospitalized HF patients.
Materials and methods
Simulation geometric model and meshing
A HF patient-specific aortic model (Fig. 1F) was reconstructed based on computed tomography angiography (CTA) images. We reconstructed the aortic model images using commercial three-dimensional reconstruction software Mimics (Materialize, Belgium). Next, Geomagic software (Geomagic, USA) was used to improve the quality of the model surface.
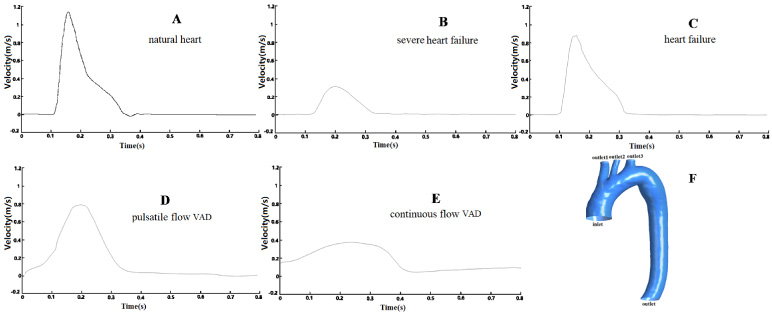
Five different inlet waveform velocities used in the numerical simulations and a patient-specific aortic model. A: natural heart, B: severe HF, C: HF, D: Pulsatile flow VAD, E: continuous flow VAD; F: A patient-specific aortic model, an inlet boundary, and four outlet boundaries were defined. HF: heart failure, VAD: ventricular assist device.
A total of five CFD simulations, including cases with normal physiological condition, HF, severe HF, two typical VADs, including the pulsatile and continuous blood flow cases, were conducted.
For the evaluated cases, the computational model was meshed with tetrahedral and prism elements using ANSYS ICEM CFD (ANSYS Inc., Canonsburg, USA). Before the calculation, the mesh sensitivity test was conducted. Max sizes and Wall Max sizes were the main variables for the mesh. We used WSS as the key parameter to verify that the mesh was sufficiently refined. After the sensitivity tests, we observed that when the Max sizes and Wall Max sizes were smaller than 1.5 mm, and the WSS did not change with the mesh. In the final model mesh, the Max size of body elements was set to 1.2 mm, and the Wall Max size was set as 0.9 mm. A sensitivity test is provided in the supplemental information. Furthermore, boundary layers near the aortic wall were applied, which were set to 3; the height ratio and total height were set to 1.2 and 0.2 mm, respectively. The model final volumes of the meshes were 2 815 830.
The simulation was performed under laminar flow conditions. The numerical study was performed using ANSYS Fluent 14.0 (ANSYS Inc., Canonsburg, PA, USA). There were some assumptions in our calculation, such as the blood was assumed to be incompressible and viscous. The density (𝜌) of blood was assumed to be constant and was equal to 1050 kg/m3 [8]. The walls of the aortic vessels were assumed to be in a no-slip condition. The calculation solved the Navier–Stokes equations and continuity equations as follows [9]:
Here, T and
A non-Newtonian fluid Carreau model was used to calculate the viscosity of blood as follows:
Although blood is a suspension of particles, it behaves as a Newtonian fluid in vessels with diameters greater than 1 mm [11]. Furthermore, the Perktold’s study has shown a similar difference in flow features between non-Newtonian and Newtonian numerical simulations through big vessels [12]. In this study, only the non-Newtonian simulation results are provided.
The shear stress on the aortic wall throughout a cardiac cycle was evaluated by using the time-averaged wall shear stress (TAWSS), which is expressed as follows [13]:
A zero OSI value corresponds to a unidirectional shear flow, and the OSI value is 1/2 when a purely oscillatory shear case occurs.
Another useful parameter, relative residence time (RRT), was also calculated. Specifically, RRT reflects the residence time of flow particles near the aortic wall, and it is also recommended as a single metric of low and oscillating shear stress [15]. Thus, RRT is defined as follows:
OSI does not distinguish well between uniaxial pulsatile flow and multidirectional flow. Therefore, another new parameter, transverse wall shear stress (transWSS), was also introduced. It is expressed as follows [16]:
To quantify the helical flow in the aorta models, the helicity density H
d
, namely the kinetic helicity per unit volume, was proposed. H
d
represents the swirl strength of a flow, and is calculated using Eq. (9) [17]. Equation (10) describes the area-weighted average of the helicity density [18].
Here,
Initially, a steady flow simulation was performed for the five cases. Subsequently, this solution was used as the initial iteration data for further pulsatile flow simulations. For the steady flow simulation, a uniform inflow velocity profile with a flat velocity component of 0.1 m/s was used at the inlet. For the pulsatile flow simulation, five different inflow rate waveforms (Figs 1A to E), for cases with normal physiological condition, HF, severe HF, pulsatile flow VAD, and continuous flow VAD, were set at the ascending aorta inlet. Normal physiological conditions, HF, and continuous flow VAD inflow rate waveforms were adopted from Xuan’s work [19]. Severe HF inflow rate waveforms adopted ultrasonic measurement statistical data of several patients with severe heart failure in the Chinese PLA General Hospital. Pulsatile flow VAD inflow rate waveforms were adopted from Ibrahim et al. study [20]. As the inflow rate waveforms were collected from different cases reported in the literature papers, we unified the inflow rate waveforms cardiac cycle as 0.8 s. We obtained 400 points that were equally divided from the transverse axis, and obtained corresponding values from the vertical axis. As shown in Fig. 1, the brachiocephalic artery (outlet1), left common carotid artery (outlet2), left subclavian artery (outlet3), and descending aorta (outlet) were defined as outlets. In ANSYS Fluent, there are three main types of outflow optional sets: (1) outflow; (2) outlet-vent; and (3) pressure-outlet. In all cases, we have no specific velocity or pressure sets, and we set all outlets as outflow, representing a completely developed flow.
The finite volume method was adopted to solve the mass and momentum conservation equations using ANSYS Fluent CFD. The residual continuity and velocity convergence targets were 1.0 × 10⁻⁵. Six cycles were required to obtain a convergence for the transient analysis, with 200 steps in each cycle (T = 0.8 s). After calculation, the data was post-processed using ANSYS CFD-Post (ANSYS Inc., Canonsburg, PA, USA). The time span of the computational process span was approximately 5 days in each case.
Simulation results
TAWSS and transverse WSS on the aorta wall
The time-averaged wall shear stress (TAWSS) contours of the aorta models for the five cases are shown in Fig. 2A. The average WSS of the blood vessel near physiologic conditions was 0.5 Pa [19]. Our computed result revealed that the WSS of the aorta was higher than that of the common vessel. In Cases 1 to 3, HF decreased the WSS on the aorta arch. Specifically, case 2, representing severe HF, the TAWSS (0.1 to 1 Pa) was evidently lower than that for the normal physiological state (0.5 to 3.7 Pa) [21]. Furthermore, compared with the continuous flow VAD case, the pulsatile blood flow case could induce higher WSS on the aortic arch. Compared with Cases 1 and 4, the TAWSS induced by pulsatile flow VAD had almost normal physiological levels.
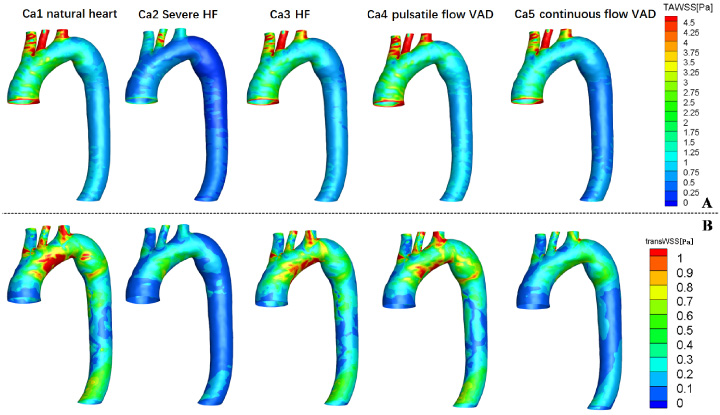
Time-averaged wall shear stress (TAWSS) and transverse wall shear stress (transWSS) for the five cases. A: TAWSS on the aortic arch wall. B: transWSS on the aortic arch wall. HF: heart failure.
Figure 2B shows the transverse WSS distribution on the aortic arch wall. Generally, similar to the TAWSS distribution, transverse WSS on the vessel wall with HF cases was lower than that in the normal physiological case. Particularly in severe HF Case 2, transverse WSS shows an evidently blue color, and thus had a low value. With the VAD conditions, the pulsatile flow VAD case showed higher transverse WSS on the aortic arch than the continuous flow VAD case.
Figure 3A illustrates the Oscillatory shear index (OSI) contour at the aortic arch in all cases. The OSI was slightly elevated after HF, and it is more evident in the severe HF case. VADs could decrease the OSI on the aortic wall. When compared with Case 4 and Case 5, continuous flow VADs lead to a slightly lower OSI than the pulsatile flow VADs on the aortic wall.
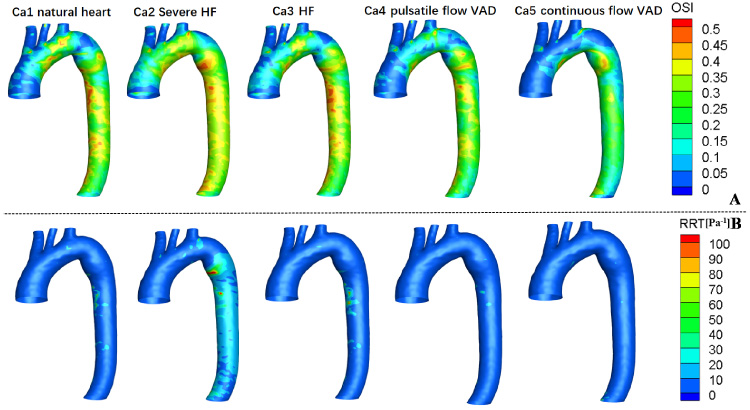
Oscillating shear index (OSI) and relative residence time (RRT) for the five cases. A: OSI on the aortic arch wall. B: RRT on the aortic arch wall.
As shown in the Fig. 3B, relative residence time (RRT) on the vessel wall was similar for all cases. However, the HF case increased RRT on the aorta wall, particularly in the descending aorta for severe HF Case 2 (the value reached to 30 Pa−1). A comparison of the pulsatile flow Case 4 and continuous flow Case 5 showed RRT on the aorta wall to be almost same.
In general, the results also revealed that the pulsatile flow VADs are not better than continuous flow VADs in terms of OSI and RRT these two hemodynamic parameters.
Figure 4 shows the maximum helicity at the peak flow moment at the outlet of the descending aorta under the five conditions mentioned previously. It indicates that under normal physiologic conditions, the aorta could induce the highest helical flow. HF evidently decreases the strength of the helical flow. In contrast to the normal physiologic condition, although pulsatile flow VADs could produce some helical flow, it was lower. Moreover, continuous flow VAD could not produce any helical flow.
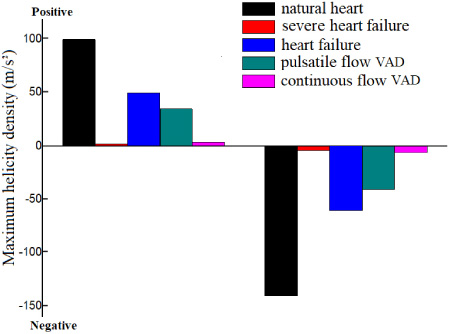
Maximum helicity at the peak flow moment on the outlet of the descending aorta for the five cases.
Figure 4 shows the helicity parameters under the five conditions having both positive and negative values. This indicates the helical flow having both clockwise and counterclockwise directions [22].
A single cross section at the descending aorta could not be sufficient to characterize helical flow patterns in the thoracic aorta. Gallo et al. also suggested investigating different aortic segments [23]. Furthermore, we cut three representative cross-sections in the aorta model for each case and plotted the area-weighted averages of helicity density H d for three representative cross-sections to compare the helicity in the different cases (S1–S3, Fig. 5). We obtained new hemodynamic findings from this study. From Fig. 5, we observed that the ascending aorta (S1) induces an evidently higher helicity than the aorta arch middle location (S2) and descending aorta (S3). In addition, comparing S1–3, we have also observed that the helical flow of ascending and descending aorta have similar directions, but the helical flow of the aorta arch middle location has opposite direction.
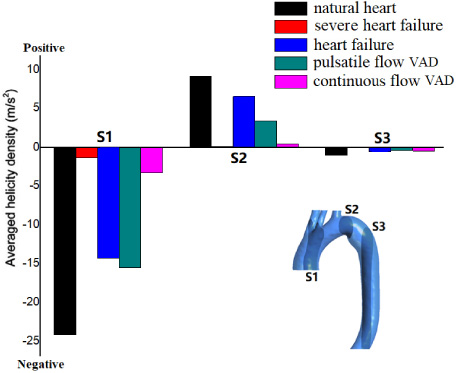
Area-weighted helicity of three representative cross-sections in the aorta model.
HF continues to be a challenge to human health. At present, VADs have been widely employed, regardless of being accepted as a permanent life-sustaining or a transitional treatment before heart transplantation. Different VADs produce different velocity waveforms in the aortic arch having variable hemodynamic effects on the aortic arch. In the present study, we conducted numerical simulations under five different flow waves from the ascending aorta inlet to study their hemodynamic influence on the human aortic arch.
The simulation showed that HF decreased the TAWSS and transWSS on the aortic arch. The pulsatile flow VADs evidently elevated the TAWSS and transWSS values on the aorta surface. A low shear stress is associated with in-stent restenosis and thrombosis [24]. Furthermore, HF also led to slightly higher OSI and RRT on the aortic wall surface. The VADs could slightly decrease the OSI and RRT Values of the aorta. High OSI and RRT may lead to thrombus formation by simulating platelet aggregations, enhancing the collision of activated platelets, and increasing the residence time of procoagulant microparticles [25]. Therefore, considering WSS, OSI, and RRT, the VADs could improve the hemodynamic conditions.
A limitation of the study is that the prescribed outflow BCs represent an over simplistic assumption. At the four outlet sections, which are the brachiocephalic artery, left common carotid artery, and left subclavian artery, and descending aorta outlet, Neumann or Dirichlet BCs should be properly prescribed to ensure mass conservation in the finite volume model. Several strategies can be adopted, possibly leading to different results regarding hemodynamics patterns, using defective conditions, such as the non-invasively measured flow rate waveforms and a fixed flow ratio at multiple outlets, together with not measured pressure conditions [26]. Madhavan and Kemmerlings study also revealed that the choice of outlet condition has a noticeable effect on a larger percentage of the solution domain than the choice of inlet condition [27]. Therefore, in a future study, to obtain more accurate numerical simulation results regarding four outlet sections of BCs, we suggest using specific measured data of pressure or velocity as large as possible. The second limitation is that as the inlet rate waveforms were collected from different cases or literature papers, the differences in results might be, at least partially, due to differences in cardiac outputs between the patients or differences in the pump-settings. The studies have shown that the inflow velocity distribution has a strong impact on the results obtained in the ascending aorta and aortic arch [4,6]. These aspects should be improved in future studies.
Helical flow has been confirmed to be significant aortic hemodynamic factor in maintaining normal aortic physiological function. The helical flow in the aorta exhibits crucial hemodynamic effects by increasing oxygen flux [28]. Furthermore, helical blood flow hinders the development of atherosclerotic plaques [29]. Meanwhile, Wang reported that helical flow played an important role in reducing low-density lipoprotein concentration in the inner surface of aortic vessels [30]. Moreover, a few reports have mentioned the benefits of helical flow to design vascular stents [31–33]. In this study, the simulation results demonstrated that HF decreased the helical flow strength. For the VAD cases, the pulsatile flow VAD could induce some helical flow; this is advantageous compared to the continuous flow VAD dose. However, in contrast to the normal physiological condition, pulsatile flow VAD products have lower helical flow strength. Powerful helical flow is possibly derived from the twisting of the heart, wherein the VADs have no action on the twisting.
Conclusions
In conclusion, the results of this study showed that HF will worsen hemodynamic conditions, including decreased WSS and reduced helical flow strength. Pulsatile flow VADs caused a higher increase WSS on the aorta and generated some helical flow. However, continuous flow VADs support the induction of slightly lower OSI and RRT. In general, pulsatile flow VADs are more advantageous than the continuous flow VADs on hemodynamic effects. Therefore, pulsatile flow VADs may be a relatively good choice for patients with HF.
Footnotes
Acknowledgements
This work is supported by Grants-in-Aid from the National Natural Science Research Foundation of China (No.11732001) and Guangdong leading talents project Foundation of China (No. 2016LJ06S686).
Author contribution
Concept and design: Ying Chen, Wenchang Tan
Drafting article: Ying Chen, Wenchang Tan
Data analysis: Ying Chen, Yunmei Yang, Yubin Xing
Critical revision of article: Ying Chen, Liqin Fu
Approval of article: Xiaoyan Deng, Wenchang Tan
Supplementary material
Note: In the sensitivity test figure, the WSS value is only applicable for the sensitivity test, and it does not present any case results of this study.