
Abstract
Introduction
The intervertebral disc can be a common source of low back pain [1]. The direction of loading to disc tissue in response to postural changes in the lumbar spine has been investigated in many studies [2–6] and it can be analyzed in vivo via disc hydration profile using Magnetic Resonance Imaging (MRI) [7–12]. Particularly, understanding the direction of loading on the axial plane would provide more information than that on the sagittal or coronal plane to consider the kinematical mechanism of discogenic pain.
Previously, Fazey and colleagues [7,12] reported the direction of shift in disc hydration in response to lumbar rotation by analyzing disc hydration over three 1-pixel wide lines on the axial MRI through the center of the disc over the mid-sagittal and coronal directions (i.e. original method). Lumbar rotation would not shift disc hydration considerably in the sagittal and coronal directions. Hence, this original method could still capture a good representation of the disc hydration profile and enable us to understand the direction of shift in disc hydration over the axial plane by combining shifts in disc hydration profiles over the sagittal and coronal directions. However, the original method would not be able to provide an adequate representation of the disc hydration profile in the sagittal and coronal directions when the disc hydration deviates away from the area covered by the three 1-pixel wide lines in the sagittal and coronal directions of the disc such as side-bending [8]. Thus, the application of the original method is limited.
Hence, it is necessary to modify the original method by obtaining additional data over the antero- and postero-lateral regions of the disc in order to understand the direction of shift in disc hydration over the axial plane in response to various postural changes in the lumbar spine. Such understanding requires many steps to analyze MRI data by the assessor. Therefore, reliability assessments are necessary. The purpose of this study was to investigate reliability and the number of times of analysis in identifying the direction of shift in disc hydration in response to side-bending using a modified method.
Methods
Participants
Eleven asymptomatic subjects without history of low back pain and contraindications for a MRI scan were recruited from a local university. Exclusion criteria included degenerated discs (Grades III to V [13]) found in generic T1- and T2-weighted sagittal and axial MRI. One subject was excluded because of moderate degeneration of the L4–L5 disc. Consequently, 10 subjects (five males), with a mean age of 25.0 years (range, 20–34 years), completed this study. This study was cleared by the institutional human medical ethics committee. Informed consent was completed prior to data collection.
Data acquisition method
MRI of each disc was obtained with a 0.2-T horizontally open unit (AIRIS mate, HITACHI Inc., Sapporo, Japan) in the evening (6 PM–9 PM) in all subjects. The subjects were placed in the supine position with knees extended beneath the flexible receiver surface coil (MR-JCL-72 separate type, HITACHI Inc., Sapporo, Japan). The pelvis was firmly stabilized to the measurement table with straps to prevent rotation of the pelvis. Axial T2-weighted images (
Image analysis
The disc rotation of the MRI was corrected using the Image J1.6 software (National Institute of Mental Health, Bethesda, USA). Mid-lines of the disc were drawn from the left to right edges and the anterior to posterior edges, respectively (Fig. 1). Subsequently, deviations from the true horizontal and vertical lines were determined and the alignment of the disc was adjusted for the extent of rotation.

Diagram of measurement of disc rotation.
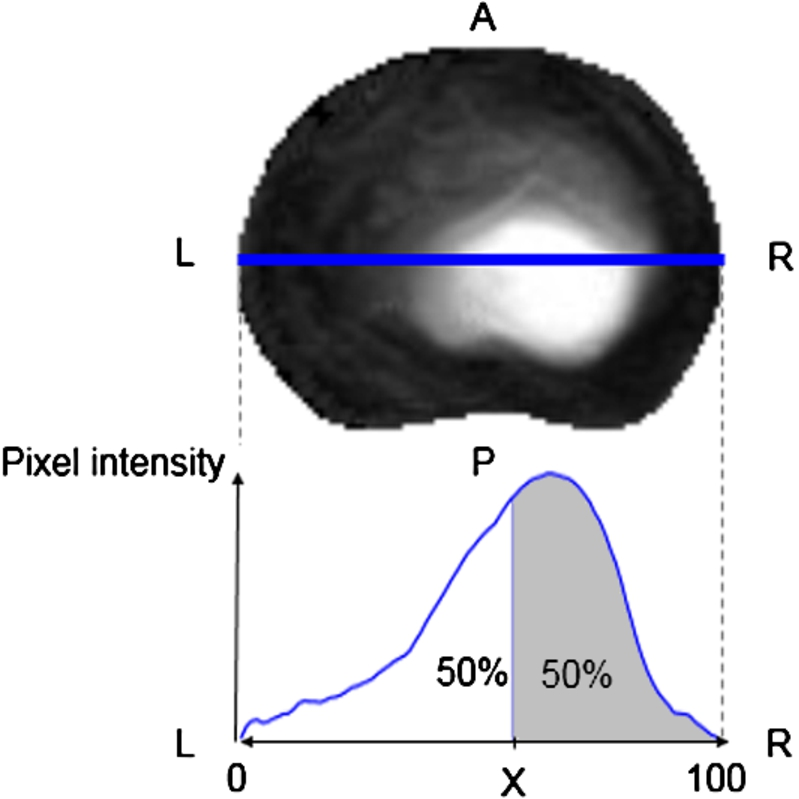
Mid-point over a pixel intensity profile line. A – anterior; P – posterior; L – left; R – right; X – mid-point over a pixel intensity profile line. (Colors are visible in the online version of the article; https://dx-doi-org.web.bisu.edu.cn/10.3233/BME-151273.)
Two different methods of analysis (the original and modified methods) were utilized to identify a mid-point over an intensity profile line, where it divides the total pixel intensity into equal halves on either side (Fig. 2). A pixel was defined as the smallest unit of image of the MRI.
A first line which is 1-pixel wide was drawn along the coronal direction through the center of the disc (Fig. 3). A pixel intensity profile line was then computed along this line. This line of data was normalized from 0% on the left edge to 100% on the right edge using Excel (Microsoft Corporation, Redmond, USA). Similarly, a second and a third 1-pixel wide line was drawn beneath and above the first line (Fig. 3) and the line of data was normalized, respectively. Subsequently, the three mid-points over the three lines were averaged and used for statistical analyses. This averaged mid-point value indicates the disc hydration along the coronal direction of the disc over the axial MRI. Similarly, the same procedure was repeated along the sagittal direction through the center of the disc and data was normalized from 0% on the posterior edge to 100% on the anterior edge using Excel (Fig. 3).
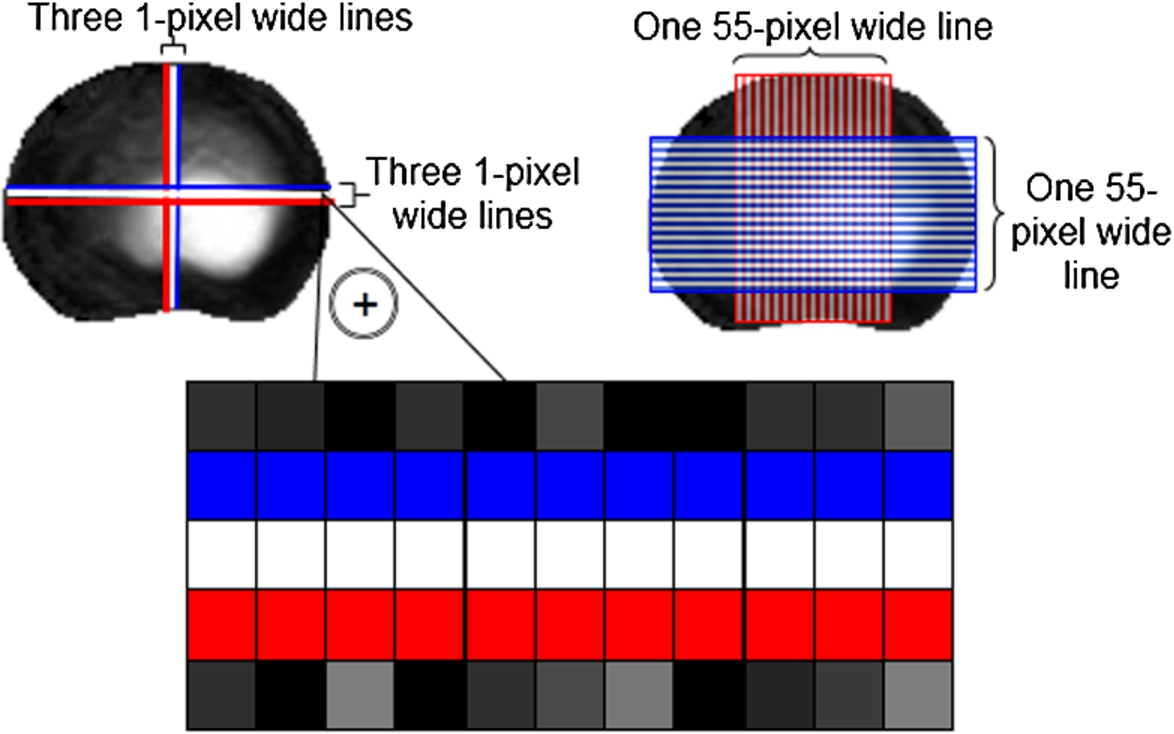
Diagram of data acquisition area in the original (left) and modified (right) methods of analysis. Enlarged each line of 1-pixel (original method) is presented below the two disc images. One box of square represents one pixel. (Colors are visible in the online version of the article; https://dx-doi-org.web.bisu.edu.cn/10.3233/BME-151273.)
First, each disc image was cored using generic software (Paint, Microsoft Windows XP). A 55-pixel wide line was drawn along the coronal direction through the center of the disc using the Image J1.6 software (Fig. 3). The pixel intensity profile line was normalized from 0% on the left edge to 100% on the right edge using Excel and the mid-point was calculated. This mid-point, which indicated the gross disc hydration along the coronal direction of the disc over the axial MRI, was used for subsequent statistical analyses. Similarly, the same procedure was repeated along the sagittal direction through the center of the disc and data was normalized from 0% on the posterior edge to 100% on the anterior edge using Excel (Fig. 3).
Identifying the direction of shift in disc hydration over the axial MRI
The modified method was used to identify the direction of shift in disc hydration over the axial MRI in response to end-range left side-bending. The mid-point values over the pixel intensity profile line during side-bending were subtracted from the values in the neutral position over each of the sagittal and coronal directions of the disc. Each subtracted value was then plotted on a X–Y coordinates plane (sagittal direction; Y-axis, coronal direction; X-axis) and the angle (θ) formed by the plotted point with reference to the X-axis was calculated. Thus, for example, a θ value of
Statistics
Intraclass Correlation Coefficient (ICC) was calculated for the assessment of inter- and intra-observer reliability to identify mid-point over the pixel intensity profile line during left side-bending over the sagittal and coronal directions of the disc using the modified method. One investigator (Investigator 1) analyzed the images twice on two separate occasions to calculate
Pearson’s r correlation coefficients for the mid-point values during left side-bending along the sagittal and coronal directions of the disc were calculated between the two methods. The mean mid-point values during left side-bending along the sagittal and coronal directions of the disc were compared between the two methods using paired t-tests to investigate the difference of these methods in capturing disc hydration profiles.
Intra-observer reliability of θ values was calculated in
All statistical analyses were performed using SPSS version 19.0 (IBM Corporation, New York, USA). Statistical significance was set at
Results
Intra-class correlation coefficients (
and
) of the values of mid-point over the pixel intensity profile line during end-range left side-bending along the sagittal and coronal directions over the axial MRI of the disc with the use of the modified method of analysis
Intra-class correlation coefficients (
Pearson’s r correlation coefficients of the mid-point values during end-range left side-bending along the sagittal and coronal directions over the axial MRI of the disc in between the original method of analysis and the modified method of analysis
Means and standard deviations of the mid-point values * during end-range left side-bending along the sagittal and coronal directions over the axial MRI of the disc in the original method of analysis and the modified methods of analysis
100 indicates anterior or right edge of the disc, 50 indicates the center of the disc and 0 indicates posterior or left edge of the disc.
Paired t-tests.
Intra-class correlation coefficients (
Table 4 shows intra-observer reliability of θ values and the minimum number of times of analysis expected to yield an ICC of 0.8. The ICC of the θ values ranged between 0.69–0.80 and it was estimated that calculating θ values twice yielded an ICC of 0.8 over every disc levels. The mean (standard deviation) of the averaged θ values analyzed twice were
This study proposed a modified method of analysis to quantify the shift in disc hydration over the sagittal and coronal planes. It is noteworthy that the modified method captures the shift in disc hydration more accurately than the original method when the disc hydration deviates away from the mid-sagittal and coronal lines of the disc. Thus, the modified method enables the investigation of the direction of hydration shift over the axial plane in response to various postural changes in the lumbar spine. This study has demonstrated the reliability of identifying the direction of disc hydration shift when the θ value was calculated twice followed by averaging it.
The disc hydration profiles identified using the modified method correlated with those of the original method along the sagittal and coronal directions. This indicates a similar trend between the modified and original method. However, there were significant differences in the mean mid-point values between the modified method and the original method along the sagittal direction of the disc at most of the disc levels and along the coronal direction of the disc at L4–L5. These concurs with our hypothesis that the modified method is able to provide a better representation of the disc hydration profile as opposed to the original method when the disc hydration displaces from the center of the disc.
The modified method may enable us to understand disc kinematics in response to side-gliding of the lumbar spine, which is a common therapeutic exercise for unilateral back and leg symptoms [14]. It is interesting to investigate if there is any kinematical differences between side-bending and side-gliding.
There are three potential limitations in this study. First, MRI scanning was conducted only once in each lumbar posture at night in this study. We did not consider stability of the mid-point values and the θ values between days and within a day. Thus, the reliability of the analysis is likely to be consistent in studies with a cross-sectional design for now. Second, only healthy discs were scanned in this study. There may be a reduction in analysis reproducibility for degenerated discs due to the reduction of signals on T2-weighted images. Further research is required to extend the application of this modified method beyond the limited condition.
Conclusion
The modified method was reliable in capturing gross disc hydration profiles. The direction of shift in disc hydration over the axial MRI of the lumbar disc in response to side-bending can be identified using averaged values of θ which was calculated twice.
Footnotes
Acknowledgements
The authors wish to acknowledge Yoshikazu Ikemoto, MD, PhD for the inspection of the MRI data and Kozue Miura, JT; Taichi Gotou, JT; Yuta Nakai, JT; Shouta Kaneko, OT; Takeshi Iizawa, PT for their assistance.
Conflict of interest
There was no conflict of interest for any of the authors.