
Abstract
Single-trial electroencephalogram (EEG) data are analyzed with similarity measure. Time–frequency representation is constructed from EEG signals. It is then weighted with t-statistics. Finally, the test data are discriminated with similarity measure. Compared with non-weighted version, the experimental results indicate that the proposed method obtains better results in classification accuracy.
Keywords
Introduction
The goal of brain–computer interface (BCI) is to allow direct transmission of messages with an alternative way by analyzing brains’ mental activities [1–9]. BCI systems based on single-trial analysis of electroencephalographic (EEG) signals associated with motor imagery (MI) have become popular in the last decade [9]. Special characteristics of event-related desynchronization (ERD) and synchronization (ERS) in mu and beta rhythms over the sensorimotor cortices during MI tasks are used to discriminate between left and right MIs [10]. In BCI applications, the performance of mental task classification depends greatly on feature extraction, such as the representation of MI data. Accordingly, it is necessary to expand 1D signal to 2D time–frequency representation due to the complexity of MI data to extract important features.
Many studies discriminate MI EEG data by means of ERD/ERS components [10]. However, most of them work on 1D temporal data and perform too complicated operation, which will diminish the performance and practicality. The principal aim of this study is to propose a simple and practical EEG-based BCI system, which extract important time–frequency features using t-statistics from the CWT plots for MI recognition. The feature representation with CWT and t-statistics further enhances the performance in BCI applications. The proposed non-invasive MI BCI work can effectively increase the accuracy of imagined motor control for the subjects that are disabled.
Feature extraction/representation is an important topic in BCI work that substantially affects the classification accuracy of MI tasks. An effective feature extraction method can obtain good classification results even if the adopted classifier is unsophisticated. Continuous wavelet transform (CWT) gives a highly redundant representation of EEG signals in the time-scale domain [11]. Hence, it can be applied for the precise localization of ERD/ERS components in the time-scale domain [12].
Two-sample t-statistic is a commonly used technique for assessing whether the means of two groups are statistically different from each other. It can be used to detect the most discriminative ERD/ERS components for different mental tasks. In this study, the CWT is used together with two-sample t-statistics for feature extraction/representation in the time–frequency domain.
To evaluate the performance of the proposed method for MI classification, the pure time–frequency representation/feature without weighted with t-statistics is implemented for the comparison. It is worthwhile to note that the 2D time–frequency representation improves upon a 1D temporal feature in regards to the attributes of interest for this study.
The paper is organized as follows. In Section 2, EEG data description and analysis are presented. Section 3 describes experimental results and discussion. Finally, a conclusion is given in Section 4.
Materials and methods
The proposed method for single-trial MI EEG analysis is illustrated in Fig. 1. It consists of data description, time–frequency representation, weighting, and similarity measure in the procedure. 2D time–frequency representation is constructed by means of CWT in feature representation. Two-sample t-statistics used to weight the representation are also used to select the appropriate weighting area and filter out noise at the same time. Finally, the similarity measure is used to discriminate test data into left or right MI states.

Flowchart of the proposed method. The procedure consists of data description, time–frequency representation, weighting, and similarity measure.
The datasets were recorded from 16 untrained subjects in a shielded room using 10 silver/silver chloride electrodes. As illustrated in Fig. 2, they consist of ten scalp EEG channels (C3, C5, FC3, C1, CP3, C4, C2, FC4, C6, and CP4) [13]. All electrodes were referenced to the A1 lead at the left earlobe. The task was to control a bar by means of imagined left or right hand movements similar to the Graz BCI [14,15], as shown in Fig. 3. Each subject performed 240 trials. The length of each trial was 8–9 s. The first 2 s of the trial were quiet, then an acoustic stimulus indicated the beginning of the experiment at
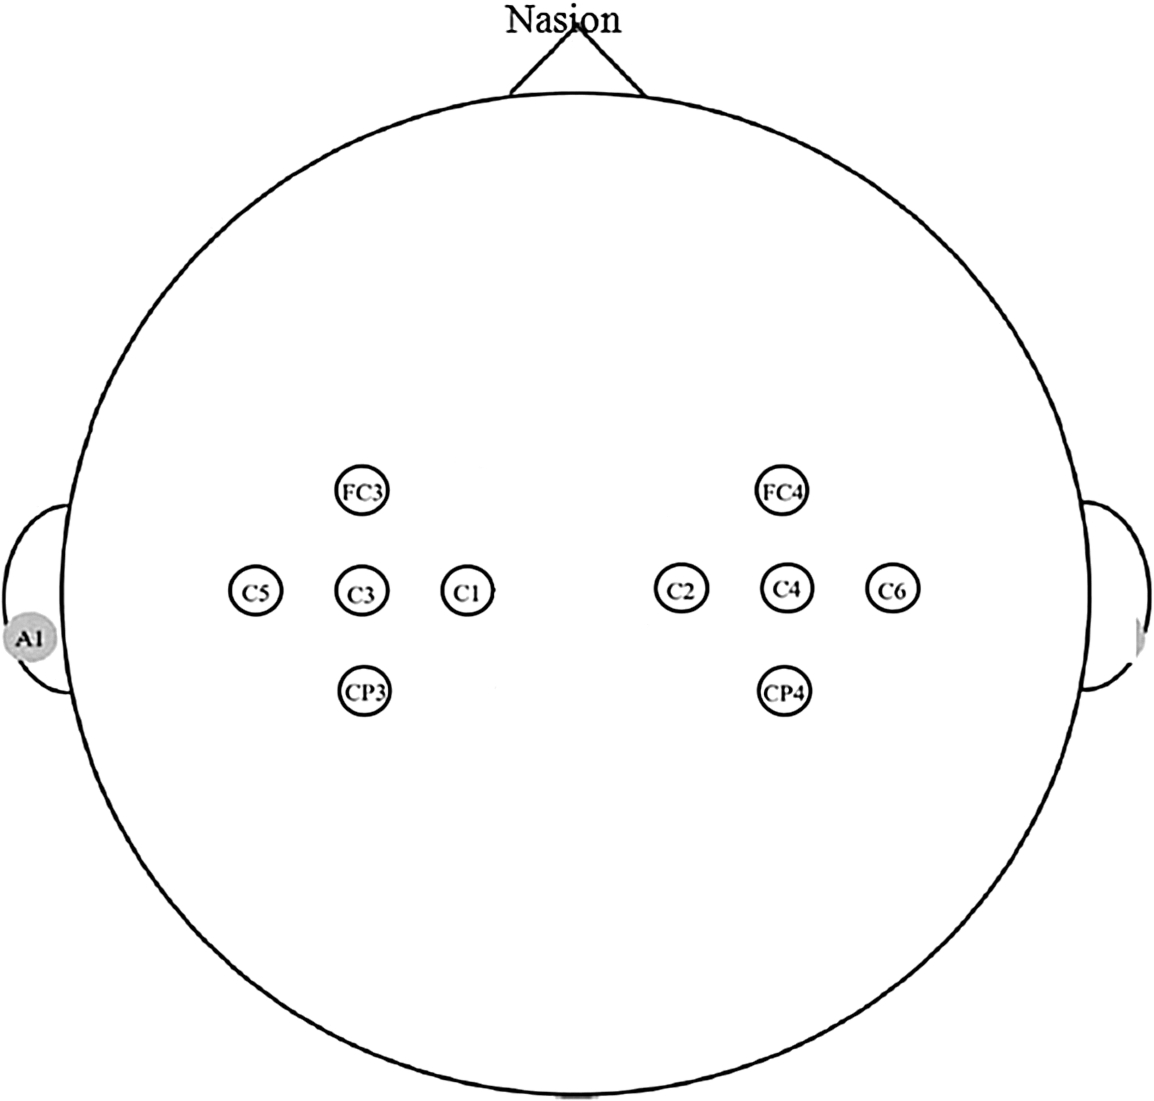
Ten EEG electrode locations in international standard 10–20 system.

Imagined EEG signals in one trial. (Colors are visible in the online version of the article;
CWT gives a highly redundant representation of EEG signals in the time-scale domain and can be applied for precise localization of ERD/ERS components through time–frequency analysis [11,12]. Hence, it is used to construct time–frequency representation of EEG signals. The CWTs of EEG data performing left and right MI in both C3 and C4 channels are represented, respectively,
However, the 2D time–frequency representation
In general, using a wider frequency range through acquired EEG signals can achieve higher classification accuracy compared with a narrower one [18]. In this study, a wide frequency range including mu and beta rhythmic components is used to acquire important power spectrums for motor imagery classification. Two-sample t-statistic for the two different MI is subsequently represented as
Weighting and similarity measure
During the training, left and right characteristic time–frequency representations (CTFRs) are obtained by normal averaging, respectively, and they are then combined together. However, CTFRs at different time, frequency and channel positions may not contribute equally in improving classification accuracy. Some position may even lead to incorrect classification because of the complexity and various characteristics in ERD/ERS. Accordingly, it is necessary to refine CTFRs by excluding the misleading time–frequency-channel regions that may cause the reduction in classification accuracy. The CTFRs is refined by weighting with the representation
Finally, we obtain the t-statistic-weighted characteristic time–frequency representations (tCTFRs) by multiplying the CTFRs with their joint weight
Experimental results and discussion
Performance evaluation
The classification tests for MI data are carried out using five-fold cross validation in all experiments. In this study, we evaluate the performance of all the experiments by means of the classification accuracy. It is to propose a reliable feature representation with weighting to enhance the MI EEG classification.
To assess the performance of the proposed method, the non-weighted feature representation is used for comparison. Table 1 lists the comparison of classification accuracy between non-weighted and weighted feature representations. The latter is weighted by means of t-statistics while the former is not. These two representations are compared at the same data for each subject. In other words, the listed values demonstrate only the deviations of performance between different feature representations. The average classification accuracies for the non-weighted and weighted feature representations are 74.2% and 79.5%, respectively. The results indicate that the weighted feature representation obtains the better results in MI classification.
Comparison of classification accuracy between non-weighted and weighted feature representations
Comparison of classification accuracy between non-weighted and weighted feature representations
In addition, to validate the performance again, the proposed method is in comparison with difference measure. Table 2 lists the comparison of classification accuracy between difference measure and similarity measure. The former is measured by means of the sum of intensity difference. These two measures are compared under the same data for each subject. That is, the listed values demonstrate only the deviations of performance between different measure criteria. The average classification accuracies for difference measure and similarity measure are 75.6% and 79.5%, respectively. The experimental results denote that similarity measure is a more suitable measure in EEG recognition.
Comparison of classification accuracy between difference measure and similarity measure
The comparison of classification accuracy between non-weighted and weighted feature representations is listed in Table 1. The non-weighted and weighted feature representations are both 2D time–frequency features, but their contents are different. The weighted feature representation is weighted via t-statistics to refine the significant information, while the former is not. Experimental results reveal that the latter is better in terms of classification accuracy for all subjects. Two-way ANOVA is performed to validate whether these two feature representations are significantly different or not. The results indicate that the difference of classification accuracy between the non-weighted and weighted feature representations is significant (
Moreover, Table 2 shows the comparison of classification accuracy between difference measure and similarity measure. The difference measure and similarity measure are both the measure metrics, but their approaches are different. The former is based on the sum of intensity differences, whereas the latter is by means of the similarity. Experimental results demonstrate that similarity measure is better in terms of classification accuracy for all subjects. Two-way ANOVA is performed again to verify if these two measures are significantly different. The results denote that the difference of classification accuracy between the difference measure and similarity measure is significant (
Applications
Human–computer interface
Interaction is an important priority for people with severe disabilities, where the person is completely paralyzed and unable to move. Therefore, several BCI methods have been proposed to assist the interaction with virtual keyboards that help spelling. It is used for locked-in persons to compose letters in a real-world environment. However, these systems need to be trained by providing large prepared words or phrases for the subject to spell. The accuracy of BCI output needs to be further improved.
Virtual reality
Virtual reality is relative safety factors, so it is employed in BCI training systems. For example, the virtual driving environment is tested with P300 responses when the subjects encounter a stoplight. The virtual apartment allows the users to interact with virtual people and objects. It also allows the users to navigate a maze by making turning decisions at intersections. Virtual reality provides a safe environment for training and tuning controlled interfaces to real-world devices. It is necessary more experiments to determine if the skills learned in a virtual-reality setting transfer to real-world scenarios.
Neural prosthetics
Neural prosthetics is an important application for BCI technology to restore movement for the people with motor disabilities. The cortical signals are used to control a hand orthosis, essentially restoring the connection from the brain to a paralyzed arm. Neural signals can be used to control a virtual hand in the hopes that simulation would provide clues to potentially incorporating functional electrical stimulation into a BCI system to restore movement.
Conclusion
In this study, we propose a novel correlation similarity for single-trial EEG classification. Wavelet transform is used to construct time–frequency representation, which provides time–frequency localization of ERD/ERS components. Next, the representation is weighted with t-statistics, which extract the information that is most discriminative. Finally, similarity measure is used for the discrimination of test data. The experimental results demonstrate that the proposed method is promising in the classification of mental tasks. It offers a potential for the use of 2D time–frequency features in BCI works.
Footnotes
Acknowledgements
The author would like to express his sincere appreciation for grants partially from MOST103-2410-H-194-070-MY2, Ministry of Science and Technology, Taiwan.