
Abstract
In this study, three-dimensional finite element models based on the specific anatomy of a patient presenting a femoroacetabular impingement of the “cam” type were developed. The finite element meshes were obtained from arthrographic magnetic resonance images captured before and after hip arthroscopy. All soft tissues were considered linear elastic and isotropic and the bones were assumed as rigid. Physiological loads and rotational motions were applied. Stresses and contact pressures were evaluated in these patient specific models in order to better interpret the mechanism of aggression of the cartilages and of the labrum and to evaluate the effectiveness of the surgery. The results of the analyses are presented and discussed. The values obtained for the stresses and contact pressures in the pathological hip were similar to those reported by other models based on idealised geometries or similar reconstruction methodologies and were larger than the ones obtained in the same hip after the surgical treatment. The surgical treatment effectively reduces the intra-articular pressures and stresses approaching the values of a normal hip. Thus, early surgical treatment may help to prevent, or delay, the joint degeneration.
Introduction
Femoroacetabular impingement (FAI) is a pathologic mechanism of hip cartilage and labrum aggression that has been clinically associated to pain, inflammatory response and possibly to joint degeneration [1–3]. It is characterized by an abnormal morphological relation between the femoral head and the acetabular cavity that leads to abutment of the femur against the acetabulum during motion (mostly flexural and internal rotations). The FAI of the cam type is caused by an asphericity in the femoral head usually located at the anterosuperior quadrant of the region of transition with the anatomical neck. As the asphericity penetrates into the socket, the cartilages are submitted to non-physiological (excessive) pressures that can cause macroscopic visible lesions similar, from the pathological and biochemical points of view, to those existing in advanced osteoarthritis (OA) [2,4]. In some cases, it can be observed an increasing gradient of these lesions from the equator of the head to the periphery, where the radius of curvature is larger. The treatment of the symptomatic cam type FAI is essentially surgical [5,6] and relies on trimming the head neck junction to remove the non-spherical part of the head (osteochondroplasty) using arthroscopic or open surgery.
Recently, some studies have been performed in order to evaluate the contact pressures developed during routine activities in pathological joints and to correlate these pressures with the morphological anomaly. Chegini et al. [7] used the finite element (FE) method to evaluate the contact pressures in virtual models of hips with FAI of the cam and/or pincer types and of hips with dysplasia. Jorge et al. [8] also used the FE method to characterize the intra-articular pressures in models based on the computational reconstruction of a normal hip and of the real deformity in the hip of a patient with FAI of the cam type. Although the results of the analyses by Jorge et al. [8] depend on a number of factors including joint incongruity, cartilage thickness and material properties, the FE model of the normal hip provided predictions for the contact pressures that are in the range of published experimental data [9–13]. On the other hand, the FE model of the pathological hip provided contact pressures in the deformity region that are in the range of the values obtained by Chegini et al. [7] and that are also larger than the ones obtained at the corresponding points of the normal hip model.
The objective of this study was to evaluate and to compare the order of magnitude of the contact pressures and stresses in the soft tissues (articular cartilages and acetabular labrum) of the hip of a patient presenting a cam type deformity, before and after the surgical treatment. Comparisons with experimental observations and with other models were also intended. The first step was to obtain the three dimensional models of the two hip joints from the corresponding radial magnetic resonance arthrography (MRA). This computational reconstruction used the same, already validated, methodology of Jorge et al. [8]. The obtained models were then analysed using the FE method for different loading cases and the corresponding numerical results are presented and discussed.
In our opinion, these subject specific 3-D models, based on the correct anatomy of the hip joints, may contribute to a better understanding of the cam-type FAI mechanism of aggression of the tissues and to the evaluation of the effectiveness of the surgery. Our hypothesis is that the magnitude of the intra-articular pressures and stresses is lower after the surgical treatment. It is very important to compare the results obtained before and after surgical treatment in order to conclude about its consequences, in particular if it helps to prevent, or delay, the local tissue damage.
Methods
In this study a 3-D reconstruction methodology [8] was applied to a hip joint of a male patient with a cam type deformity, before and after the surgical treatment. The deformity was located at the right hip with an alpha angle of 90° (normal value up to 40°) and a Wiberg’s centre-edge (CE) angle of 30° (value considered normal). The patient, with a height of 1.82 m and a weight of 750 N, was 21 years old at the date of the study.
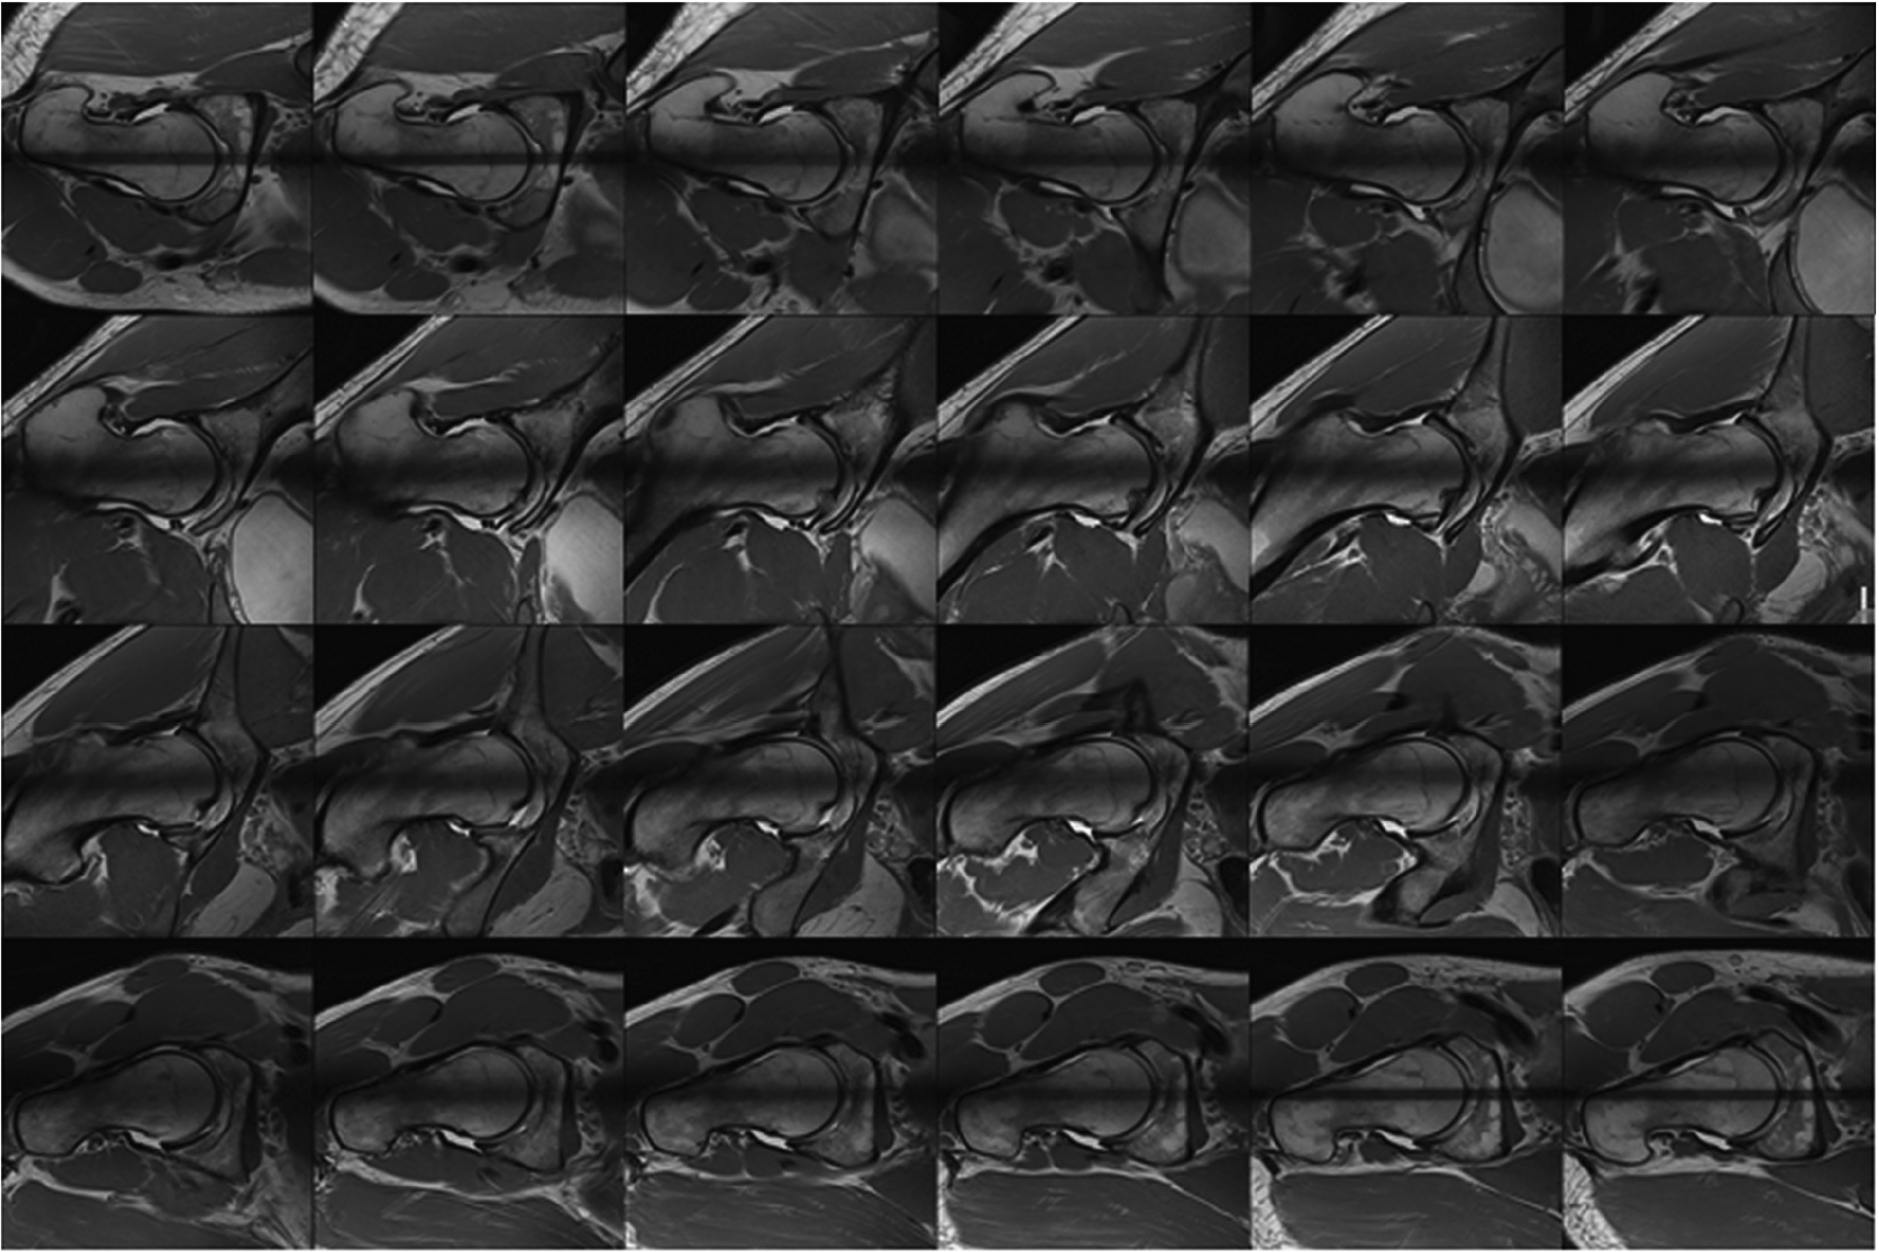
Set of 24 radial MRA images obtained from the patient with cam type FAI (the angle varies row-wise from top left image (0°) to the bottom right image (172.5°)).
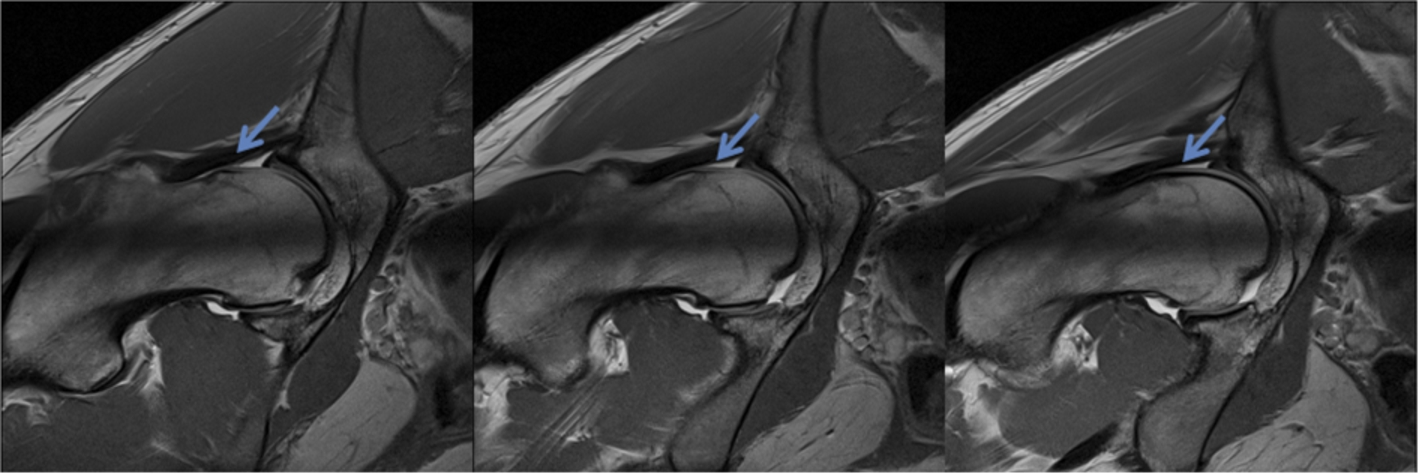
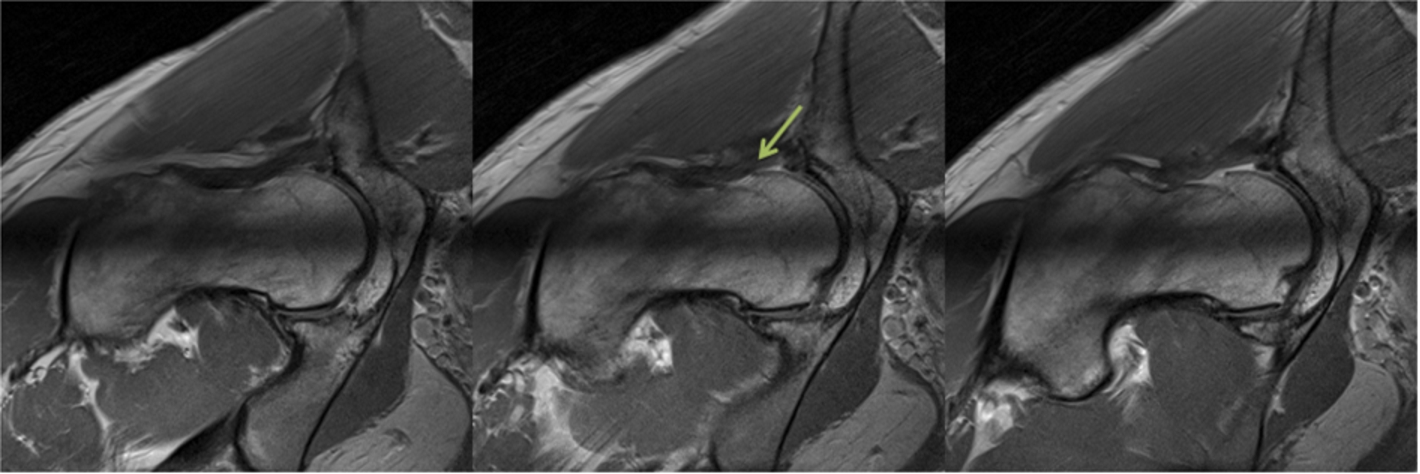
Sequence of MRA images (12, 13 and 14) where the cam deformity is more visible (areas indicated by the blue arrows). (Colors are visible in the online version of the article;
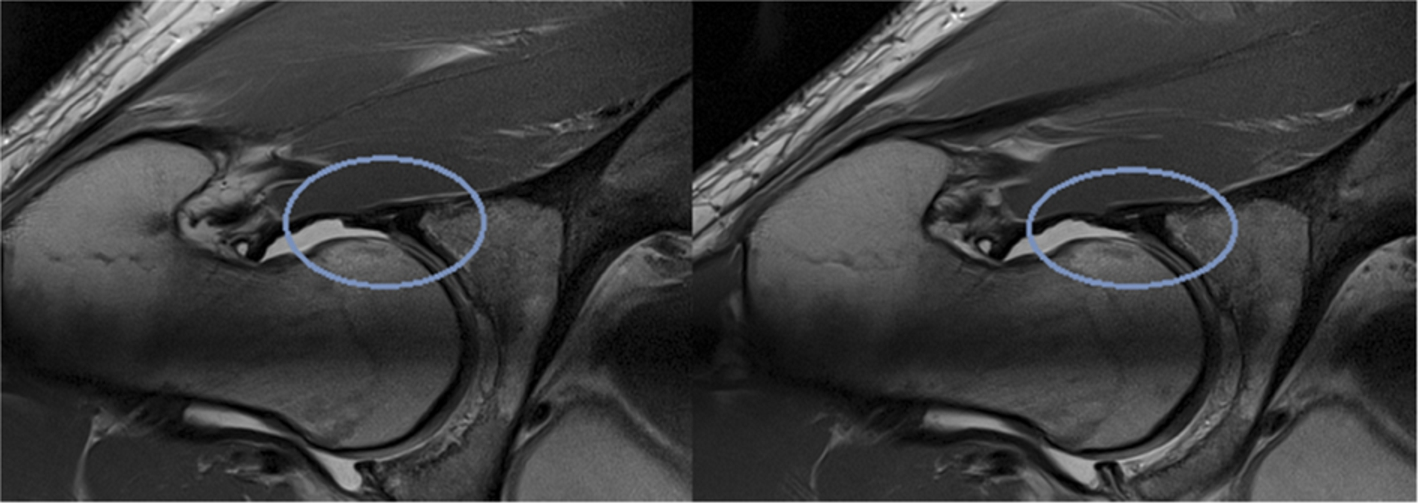
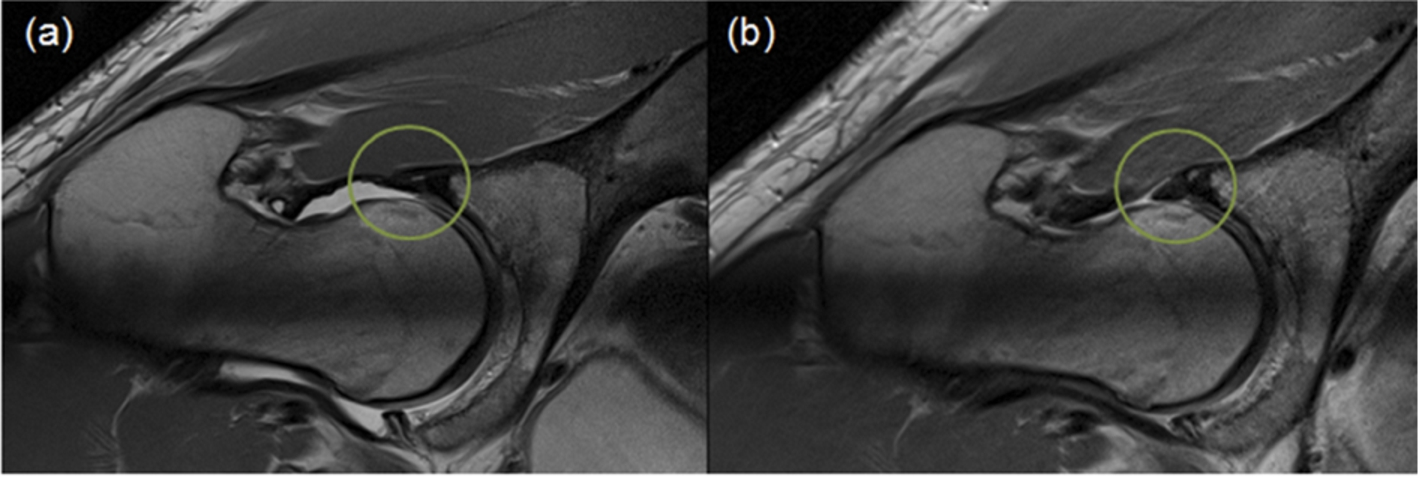
Presence of a labral detachment from the femoral head (marked by the blue circles). (Colors are visible in the online version of the article;
Figure 1 shows the sequence of 24 MRA images of the hip joint that were radially acquired with a rotation axis coincident with the geometric axis of the femoral neck and containing the centre of rotation of the femoral head. The distinguishing anatomical structures are: the head and anatomical neck of the femur, the femoral and acetabular cartilages, the acetabulum and the labrum. The T1 signal images were acquired from a Siemens Verio 3T (repetition time (ms)/echo time (ms), 3820/30; field of view, 16.5 cm; matrix, 384 × 384; x and y pixel resolution, 0.4297 mm; section thickness, 3 mm) after an injection of an intra-articular 9% saline solution with gadolinium. The radial angles of acquisition varied from 0° to 172.5, with angular increments of 7.5°. The deformity is more visible in images 12, 13 and 14 as one can observe in Fig. 2. As a result of the cam impingement this patient had an acetabular labrum that in some regions did not contact with the femoral head. This is visible in Fig. 3 (images 4 and 5 of the sequence) in the regions marked by the blue circles.
The software tools needed to obtain the 3-D model incorporate several algorithm blocks, each with specific functionalities in the overall modelling scheme: image segmentation, point cloud interpolation, solid model construction and FE mesh generation. Although Anderson et al. [13] reported an over-prediction of the cartilage contact pressures when representing the bones as rigid structures, Lopes et al. [14] obtained practically the same value for the maximum cartilage contact pressure when considering the bony structures to be linear elastic or rigid in previous 2D analyses. Therefore, all the analyses were performed considering the femur and the acetabulum rigid as in Jorge et al. [8]. Thus, only the solid models of the soft tissues (articular cartilages and labrum) were automatically discretized into finite elements. Using Rhinoceros®, the 24 MRA images were manually segmented with spline curves in order to extract the contours of the soft structures of the hip joint and from these contours clouds of points were extracted. The clouds of points were then interpolated and extrapolated in order to obtain an implicit representation of the surface, using MATLAB® with FastRbfTM toolbox. Several works have already demonstrated the effectiveness of the interpolation technique based on Radial Basis Functions (RBF) applied to medical data [15,16]. Three-dimensional solid models of the cartilages and labrum, in which the triangular surfaces were interpolated with B-spline cubic patches, were then generated using SolidWorks®. Finally, the solid models of the soft tissues were automatically discretized into finite elements using Abaqus CAE® v.6.8. Manual segmentation and 3-D reconstruction were performed under the supervision of a senior orthopaedic surgeon who, giving to the limitations imposed by the resolution of the MRA images, validated the shape of the articulating surfaces. The accuracy of the segmentation and reconstruction techniques is a very important aspect since FE predictions of cartilage stresses may be sensitive to variations in curvature and thickness of the cartilage layers. For example, to ensure a 3-D RBF reconstruction with lesser or attenuated artefact presence, attention was given to vector normal estimation and consistent distance-to-surface data calculations.
Figure 4 shows the complete FE mesh of the cartilaginous tissues with a total of 270,109 tetrahedral linear (4 node) elements. In order to evaluate the accuracy of the results obtained with this mesh, a numerical study of mesh convergence was made using a more refined mesh. The convergence study provided similar values for the maximum contact pressures for the same loading and boundary conditions when the two meshes were used. The use of linear elements is justified by the fact that, in their analyses, Jorge et al. [8] did not notice a significant overestimation of stress when using linear elements in comparison to quadratic elements.
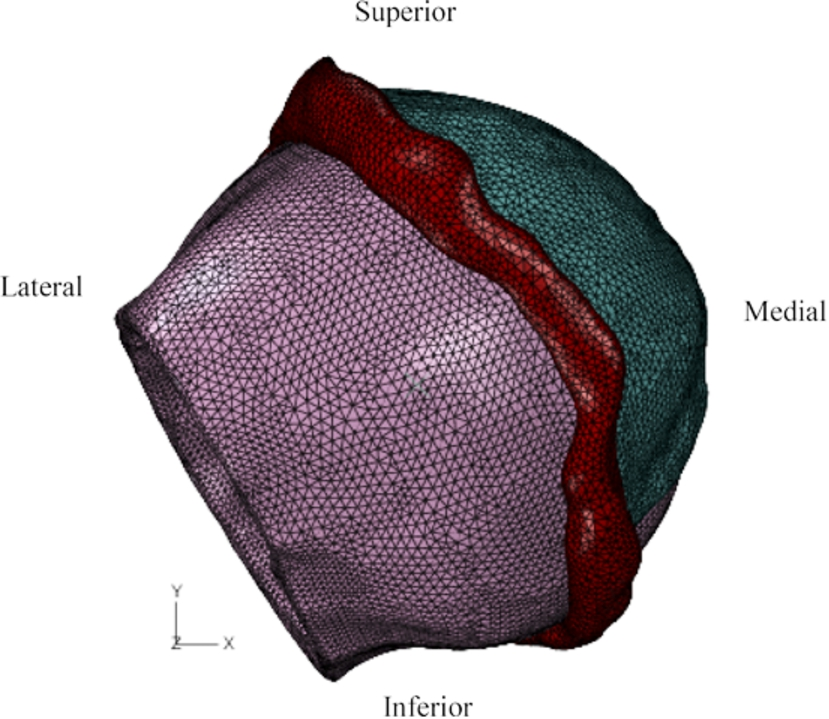
Finite element mesh of the complete model with a total of 270,109 tetrahedral elements. (Colors are visible in the online version of the article;
The cartilages and the labrum were considered linear elastic and isotropic with E = 12 MPa for the former [8,17] and E = 20 MPa for the latter [7,8] and both soft tissues had a Poisson’s ratio equal to 0.4 [8]. The outer surfaces of the soft tissues in contact with the acetabulum were fixed. All the analyses were geometrically non-linear. A frictionless surface-to-surface contact was adopted between the femoral cartilage, as master surface, and the acetabular cartilage and labrum (considered to be tied together) as slave surfaces. First the hip joint was subjected only to a compression force applied at the centroid of the femoral head. This force acted in the frontal plane with a component of 450 N along the horizontal axis (x-axis) and a component of 1875 N along the vertical axis (y-axis). These values correspond to the maximum force observed in a routine activity (walking) and for an individual weight of 750 N [18].
With the joint subjected to the compression force, two movements within the physiological range representing daily activities that typically cause pain in FAI patients: a flexural rotation of the femur (about the x-axis) of 90° (from standing to seating position [19]) and an internal rotation (about the y-axis) of 40° (simulating the painful internal rotation limit that can be associated with knee injuries [20]). Although it is known that the loading changes with joint position [18], the force was kept constant while the joint was rotated as in Jorge et al. [8] in order to enable the comparison of the results.
Eleven nodes in the FE mesh of the femoral cartilage were selected defining straight lines perpendicular to the axes of internal and flexural rotation (Fig. 5(a) and (b)). The extremities of these lines are located in the highest and lowest regions of the cam deformity. For the internal rotation, the node C2 is located at the region where the femoral deformity is more accentuated. This node was selected from the acquisition plane referent to the medical image where the existence of cam FAI is more evident (Fig. 2). The nodes chosen perpendicularly to the axis of the internal rotation present a progressive larger distance to the axis of rotation in the direction of the equator of the femoral head.
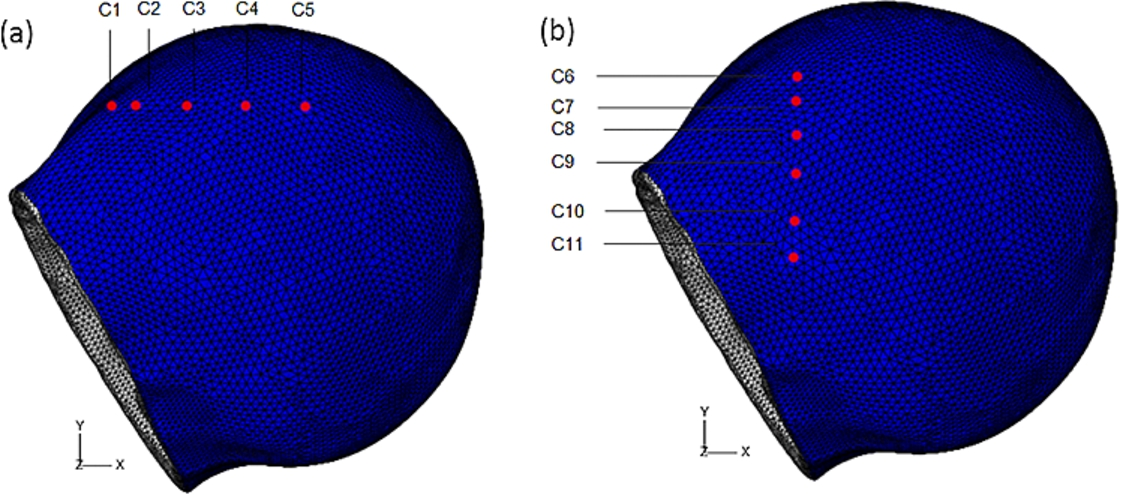
Finite element mesh of the femoral cartilage of the cam (C) model with the chosen surface nodes for (a) the pure internal and (b) the pure flexural rotation. (Colors are visible in the online version of the article;
Sequence of MRA images that correspond to the images where the cam impingement was more visible before treatment (images 12, 13 and 14). In these images it is visible that the sphericity of the femoral head was recovered (area indicated by the green arrow). (Colors are visible in the online version of the article;
(a) Pathological case with acetabular labrum detached from the femur. (b) After surgical treatment and labral refixation the acetabular labrum is in contact with the femur. (Colors are visible in the online version of the article;
The contact pressure was registered in each one of these nodes as a function of the rotation of the femoral head. Distributions of the contact pressures and of the von Mises stresses (a combination of all the components of the stress tensor that defines the limit of elastic behaviour for certain materials) in the cartilages and in the labrum were also obtained.
A FE analysis of the same hip after the surgery (arthroscopic femoral osteoplasty with labral refixation) was also performed for comparison with the pathological case. With the surgical treatment the alpha angle of the femoral head decreased to 41° (normal value). A new set of 24 MRA images of the hip joint was obtained. In Fig. 6, the sequence of MRA images (13, 14 and 15), that corresponds to the sequence where the femoral deformity is more visible in the pathological case, is represented. With the surgery, the sphericity of the femoral head was recovered (region indicated by the arrow in Fig. 6). The problem regarding labrum detachment (Fig. 7(a)) was also solved during the surgery by labral refixation (Fig. 7(b)).

Finite element mesh of the complete post-operative model (after arthroscopic femoral osteoplasty and labral refixation) with a total of 274,074 tetrahedral elements. (Colors are visible in the online version of the article;

Finite element mesh of the femoral cartilage of the post-operative (P) model with the chosen surface nodes for (a) the pure internal and (b) the pure flexural rotation. (Colors are visible in the online version of the article;
The same reconstruction methodology was applied to the hip after surgery. Figure 8 shows the complete FE mesh of the soft tissues with a total of 274,074 tetrahedral linear elements. The mechanical properties of the tissues were equal to those of the cam hip model and both models were subjected to the same boundary and loading conditions. As in the cam hip model, 11 nodes in the mesh of the femoral cartilage were selected defining straight lines perpendicular to the axes of internal and flexural rotation (Fig. 9(a) and (b)) and the contact pressure was registered in each one of these nodes as a function of the angular rotation of the femoral head. These nodes were located in regions corresponding to the ones to which the nodes selected in the deformity of the cam hip belong.
The transarticular compression led to a progressive increase in the contact pressure in the load area of the joint. The maximum contact pressure before application of the rotational movements occurred at the anterosuperior region of the femoral head with a value of 4.81 MPa before surgery and a value of 4.46 MPa after surgery.
In the case of the cam hip model, for the pure internal rotation from 0° to 40°, a progressive increase in the contact pressure was observed reaching a value of 12.45 MPa on the femoral cartilage at its anterosuperior region. This is the region where the cam deformity was located for this patient, causing an abutment of the femoral head against the acetabulum which gave rise to an increased contact between the two surfaces. It was observed that the internal rotation produces compression in a very limited area (restricted to the chondrolabral transition). Values of 15.99 MPa and 15.82 MPa were obtained for the contact pressures on the acetabular cartilage at a region of the acetabular rim in contact with the deformity and on the labrum, respectively. The maximum values of the von Mises stress occurred on the same regions. Figure 10 shows the von Mises stresses distribution and the deformed shape of the acetabular cartilage and labrum at the end of the compression step and at the end of the rotational step. The large localized deformation of the labrum (and the corresponding large von Mises stress) due to the abnormal contact with the femoral deformity during the rotational step is remarkable. The obtained results at the end of this movement are summarized in Table 1. The contact pressures due to the internal rotation on the nodes selected perpendicularly to the rotation axis increase with the distance of these points to the centre of rotation of the femoral head; the contact pressure in all the nodes increases initially as the cam deformity penetrates inside the acetabular cavity; at the most peripheral nodes (nodes C-1 and C-2) a progressive increase in the contact pressure was observed; the contact pressure decreases at nodes C-3, C-4 (closer to the equatorial region) from 25° of rotation, and it decreases at node C5 (the closest to the equatorial region) from the beginning of the rotation (Fig. 11).
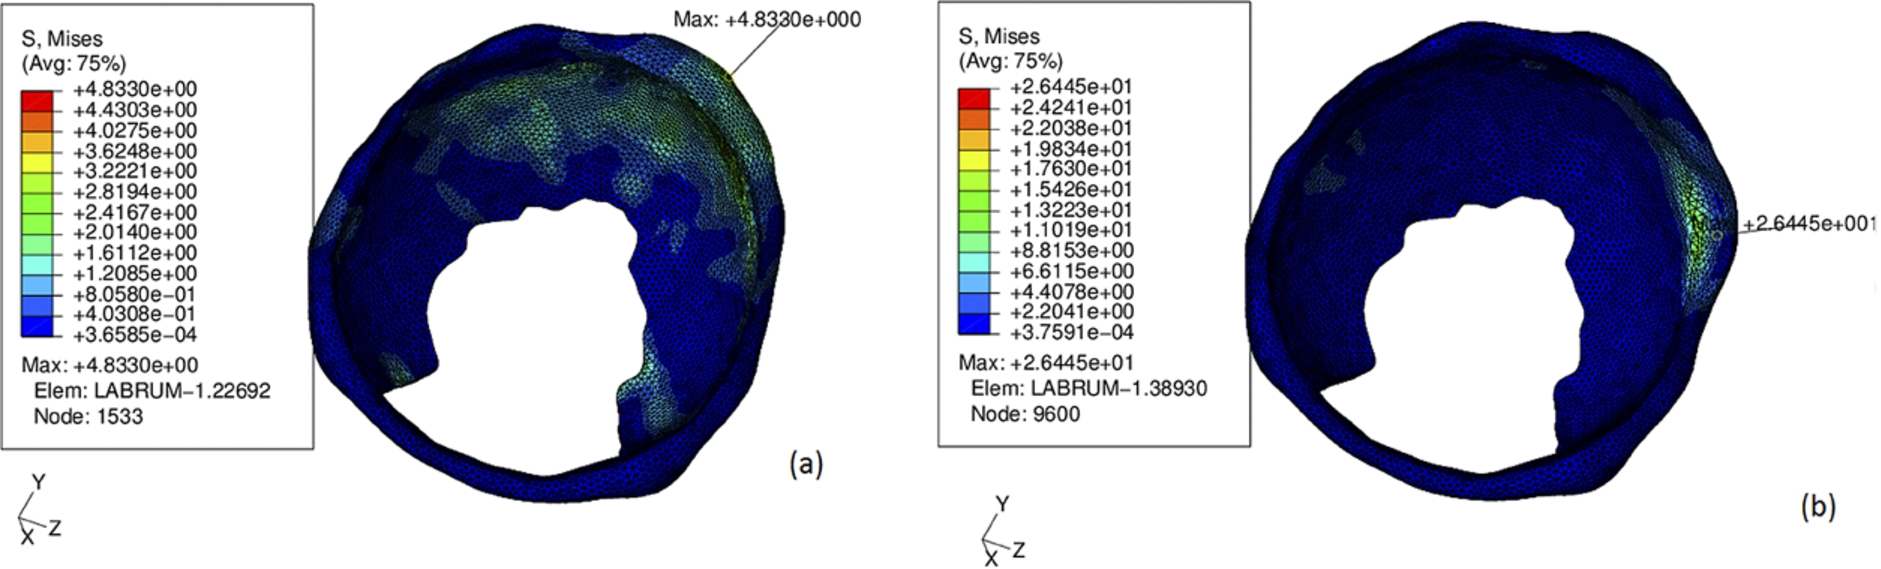
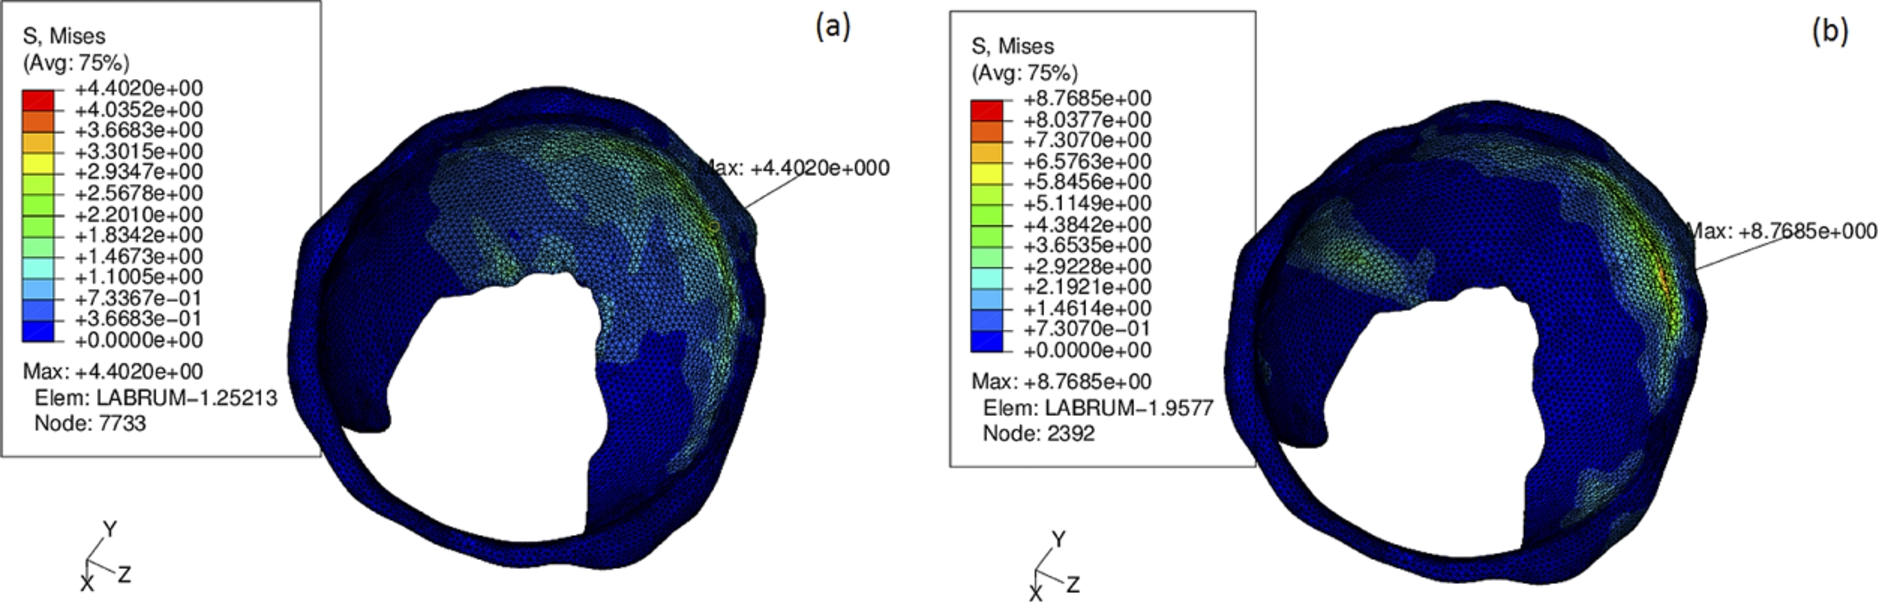
von Mises stresses on the acetabular cartilage and labrum of the cam model at (a) the end of the initial compression step and (b) at the end of the internal rotation step. It is visible the large localized deformation of the labrum (and the corresponding large von Mises stress) due to the abnormal contact with the femoral deformity during the rotational step. (Colors are visible in the online version of the article;
Summary of the results obtained for an internal rotation of 40° on the femoral cartilage (FC), acetabular cartilage (AC) and labrum (L) of the two models
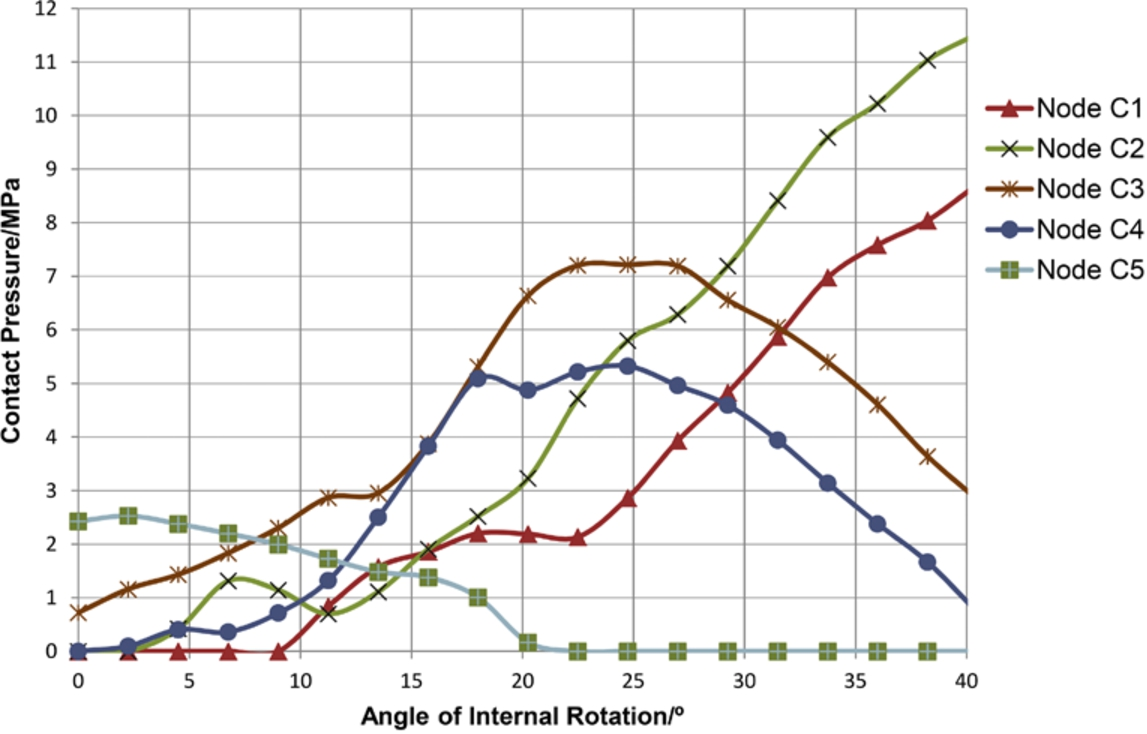
Contact pressure at nodes C1 to C5 of the cam model for an internal rotation. The contact pressures increase from the equator of the femoral head to the peripheral regions. (Colors are visible in the online version of the article;
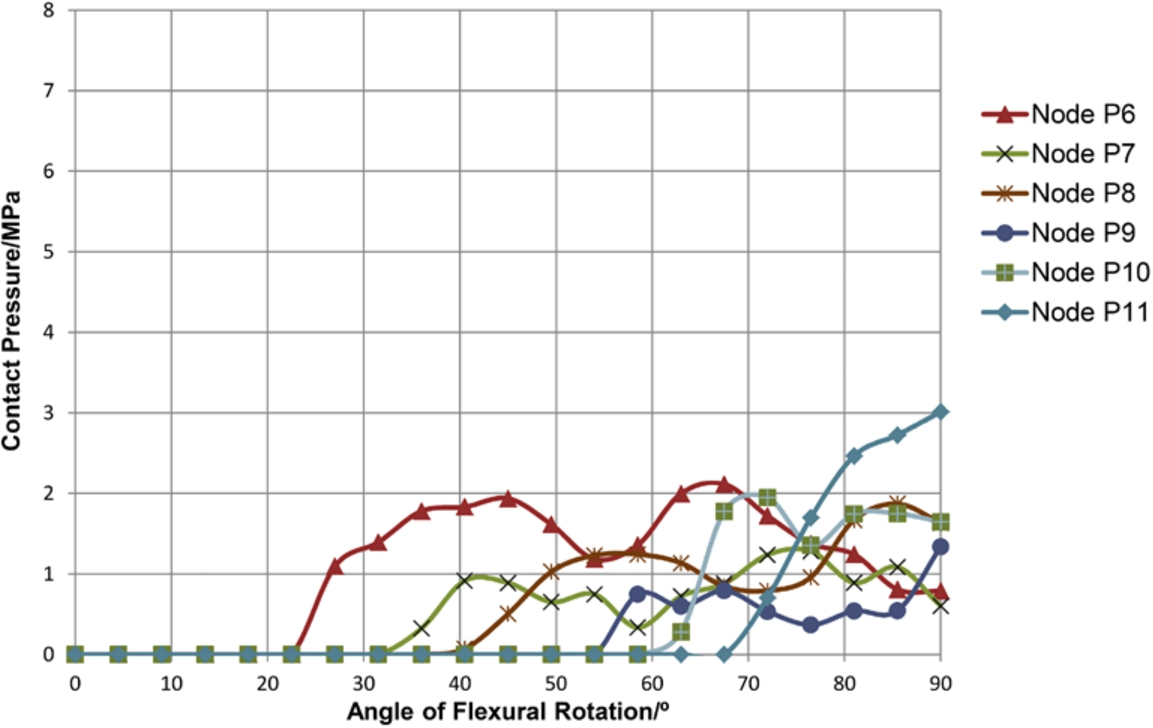
For the pure flexural movement from 0° to 90°, a progressive increase in the contact pressure was observed reaching a value of 7.11 MPa on the femoral cartilage at the region of the femoral deformity, a value of 10.23 MPa on the acetabular cartilage at a region of the acetabular rim which is in contact with the femoral deformity and with the detached labrum and a value of 7.08 MPa on the labrum at the region of the labral detachment. The maximum values of the von Mises stress occurred on the same regions. It was also observed that contrarily to what happens during the internal rotation, the flexural rotation generates a larger and deeper contact area in the acetabulum. The obtained results at the end of this movement are summarized in Table 2. The contact pressures due to the flexural rotation on the nodes selected perpendicularly to the rotation axis increase as the cam deformity penetrates into the acetabular cavity and are larger at the most peripheral nodes (Fig. 12).
Summary of the results obtained for a flexural rotation of 90° on the femoral cartilage (FC), acetabular cartilage (AC) and labrum (L) of the two models
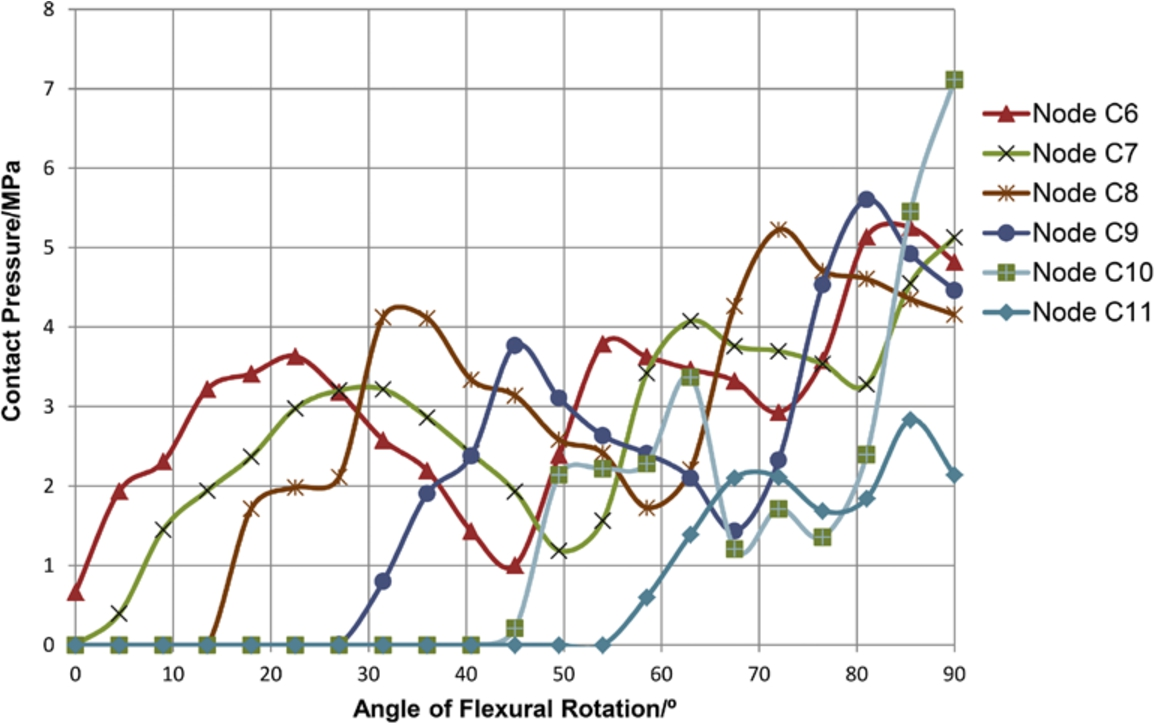
Contact pressure at nodes C6 to C11 of the cam model for a flexural rotation. The contact pressures increase from the equator of the femoral head to the peripheral regions. (Colors are visible in the online version of the article;
von Mises stresses on the acetabular cartilage and labrum of the post-operative model at (a) the end of the initial compression step and (b) at the end of the internal rotation step. (Colors are visible in the online version of the article;
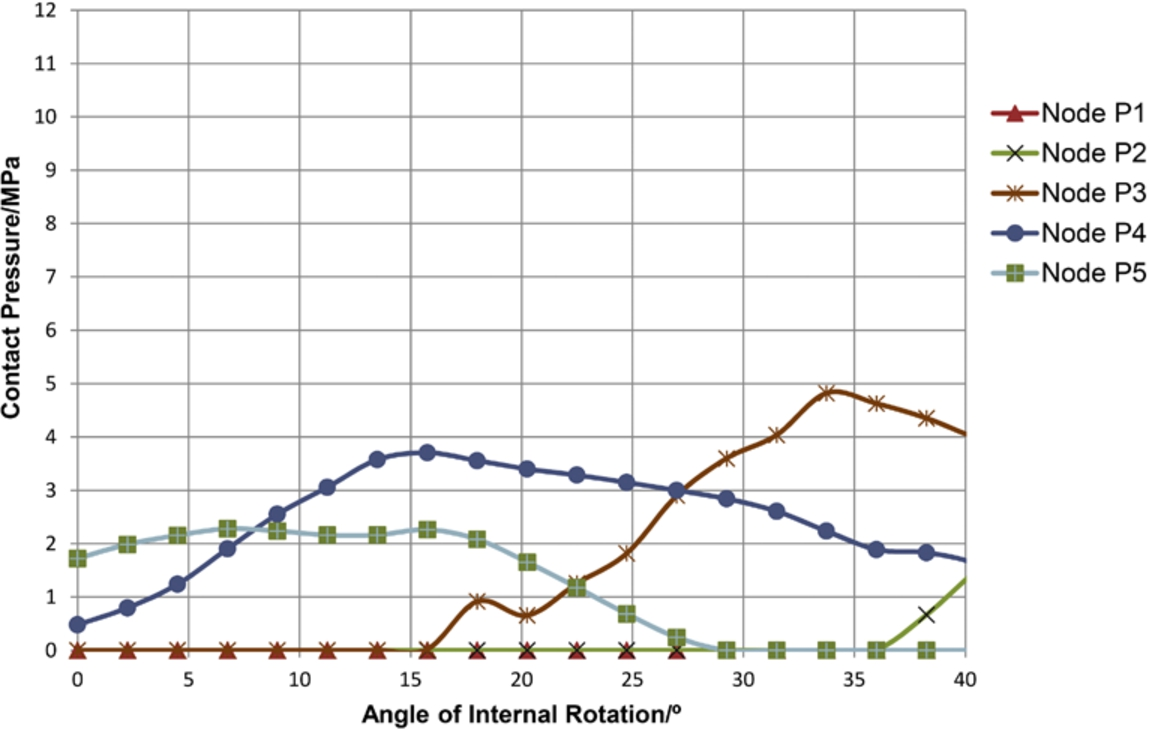
Contact pressure at nodes P1 to P5 of the post-operative model for an internal rotation. The contact pressures do not increase from the equator of the femoral head to the peripheral regions contrarily to what happens in the cam hip model. (Colors are visible in the online version of the article;
Contact pressure at nodes P6 to P11 of the post-operative model for a flexural rotation. The contact pressures do not increase from the equator of the femoral head to the peripheral regions contrarily to what happens in the cam hip model. (Colors are visible in the online version of the article;
In the case of the post-operative hip model, for the pure internal rotation from 0° to 40°, a progressive increase in the contact pressures was observed reaching maximum values on the superior region of the joint. The obtained results at the end of this movement are summarized in Table 1 where it is visible that the maximum values of the contact pressures and of the von Mises stresses are lower after the head neck junction osteoplasty. Figure 13 shows the von Mises stresses distribution and the deformed shape of the acetabular cartilage and labrum at the end of the initial compression step and at the end of the internal rotation step. The deformation of the labrum (and the corresponding von Mises stress) during the rotational step is smaller than in the cam model (Fig. 10). For the pure flexural movement from 0° to 90°, a progressive increase in the contact pressures was also observed reaching maximum values also on the superior region of the joint. The obtained results at the end of this movement are summarized in Table 2 and again it is visible that the maximum values of the contact pressures and of the von Mises stresses are generally lower after the surgery. The contact pressures on the selected nodes due to the internal and flexural rotation are shown in Figs 14 and 15, respectively. In both cases the contact pressures are smaller than the ones obtained at the corresponding points in the deformity region of the cam hip before surgical treatment. In fact maximum contact pressures of 4.82 MPa and 3.01 MPa were obtained on the selected points of the hip after surgical treatment during the internal and flexural rotation movements, respectively, while the corresponding maximum contact pressures before the surgical treatment were 11.53 MPa and 7.11 MPa. It was also observed that the contact pressures obtained in the movement of internal rotation of the post-operative hip model do not increase from the equator of the femoral head to the peripheral regions contrarily to what happens in the cam hip model.
The reconstruction procedures used in this work are well established and have provided invaluable models, closer than others to the anatomical reality, which were validated by orthopaedic surgeons [8]. The major limitations of the present model are concerned with the physical behaviour of the cartilages and labrum, which were considered linear elastic, and of the bones, which were considered rigid; the present model also does not include other tissues of the joint; finally the manual segmentation of the MRA images and the extrapolation of points between the radial sections, may have induced some deviation from reality. However to ensure a 3-D RBF reconstruction with lesser or attenuated artefact presence, attention was given to vector normal estimation and consistent distance-to-surface data calculations. Despite the limitations, several anatomical details were accurately reconstructed and, although the results of the analyses depend on a number of factors including joint incongruity, cartilage thickness and material properties, the FE models provided predictions for the contact pressures that are in the range of published experimental and numerical data on hip joints and that agree with clinical and intraoperative observations.
Chegini et al. [7] numerically obtained on a virtual hip joint with an alpha angle of 80° and a CE angle of 30°, a pressure of 12.84 MPa on the acetabular cartilage in the standing to sitting movement. Jorge et al. [8], using the same methodology of the present study, obtained for an alpha angle of 98° and a CE angle of 30°, values that are also in the range shown in Tables 1 and 2 for the maximum pressures at the end of the performed movements in the cam model.
The rotational movements seemed to be the determinant factor of the genesis of high contact pressures and stresses, mainly in the case of the hip with cam type deformity. These high pressures and stresses obtained in both movements at the anterosuperior region of the cam model agree with intraoperative observations [21] where the anterosuperior quadrant is the region in which the cartilage exhibits delamination and chondrolabral rupture. The fact that more central and inferior regions were spared to high compressions seems also to be in agreement with the observation that cam deformities are associated with anteriorly located peripheral OA [22]. The high pressures and stresses obtained at the labrum in both movements may justify the labral damage observed in patients with FAI and the labral detachment observed in this particular patient.
During both movements the contact pressures obtained on the selected nodes of the femoral head increase from the equator to the peripheral regions where the radius of curvature is larger, that is, the nodes located in an area with larger radius of curvature of the femoral head are permanently subjected to a larger and lasting contact pressure than the nodes belonging to an area with smaller radius of curvature. This seems to be in agreement with the increasing fibrillar chondromalacia, from the equatorial region to the periphery of the femoral cartilage, systematically observed in patients with cam type FAI submitted to surgery [23]. These observations are also supported by several researchers who found, in the acetabular cartilage of patients with FAI, an increase in the expression of biological markers of OA [2,3].
Our FE post-operative model provided predictions for the contact pressures at the end of the movements smaller than the ones obtained in the cam hip and that are in the range of published experimental data on normal hip joints [9–13]. The maximum values were also obtained at a different region (superior and not anterosuperior) of the joint. In the post-operative model the deformation of the labrum (and the corresponding pressure and von Mises stress) during the rotational steps is also smaller than in the cam model. This decrease is related to the fact that the femoral head has recovered its sphericity and the contact with the acetabulum is normal (without impingement). The contact pressures obtained in the selected nodes of the post-operative model are also smaller than the ones obtained at the corresponding points in the deformity region of the cam hip for similar rotation amplitudes. It is also observed that the contact pressures obtained in the movement of internal rotation of the post-operative model do not increase from the equator of the femoral head to the peripheral regions contrarily to what happens in the cam hip and as it happens in a normal hip model [8]. The peak stresses in the selected nodes of the post-operative model are even slightly smaller than the ones obtained by Jorge et al. [8] in a normal hip model using the same methodology of the present study.
Conclusions
In this study, three-dimensional finite element models based on the specific anatomy of a patient presenting a femoroacetabular impingement of the “cam” type are developed and analysed before and after hip arthroscopy. It is shown that the surgical treatment not only eliminates patient’s pain and increases joint motion but also effectively reduces the deformation of the labrum and the intra-articular pressures and stresses approaching the values of a normal hip. Thus, early surgical treatment may help to prevent, or delay, the joint degeneration (labral tear and cartilage OA).