
Abstract
Image-based finite element analysis (FEA) has been considered an effective computational tool to predict hip fracture risk. The patient specific FEA gives an insight into the inclusive effect of three-dimensional (3D) complex bone geometry, and the distribution of inhomogeneous isotropic material properties in conjunction with loading conditions. The neck region of a femur is primarily the weakest in which fracture is likely to happen, when someone falls. A sideways fall results in the development of greater tensile and compressive stresses, respectively, in the inferior and superior aspects of the femoral neck, whereas the state of stress is reversed in usual gait or stance configuration. Herein, the variations of stresses have been investigated at the femoral neck region considering both single-stance and sideways fall. Finite element models of ten human femora have been generated using Quantitative Computed Tomography (QCT) scan datasets and have been simulated with an equal magnitude of load applied to the aforementioned configurations. Fracture risk indicator, defined as the ratio of the maximum compressive or tensile stress computed at the superior and inferior surfaces to the corresponding yield stress, has been used in this work to measure the variations of fracture risk between single-stance and sideways fall. The average variations of the fracture risk indicators between the fall and stance are at least 24.3% and 8% at the superior and inferior surfaces, respectively. The differences may interpret why sideways fall is more dangerous for the elderly people, causing hip fracture.
Keywords
Introduction
A sideways fall is one of the major causes that result in hip/femoral fracture in elderly population, who often suffer from osteoporosis. Due to reduced bone mass, an osteoporotic fracture often takes place associated with falling from standing height. Hence, hip fracture owing to osteoporosis has been recognized as a major public health concern for elderly people [1,2]. In 1990, the worldwide estimated hip fracture was a total of 1.26 million, which was projected to be double, 2.6 million, by the year 2025 [3]. According to the epidemiologic projections, this worldwide annual number is expected to exceed 6 million by the year 2050 [4]. In the USA, a total of 310,000 patients become hospitalized for hip fractures among which ninety percent fractures results from a simple fall [5] according to data from the United States Agency for Healthcare Research and Quality (AHRQ) [6]. Nearly one-third of the aforementioned patients go on to receive hip replacement. The estimated cost for treatment is approximately $10.3 to $15.2 billion USD per year [7–9]. In Canada, the prevalence of osteoporosis among the people aged over 50 has been reported to be 21.3–27.1% in women and 5.5–6.4% in men [10,11]. It is notable that over 30,000 hip fractures occur each year in Canada. This figure is expected to be quadruple in Canada by the year 2041 owing to population aging, and the associated annual cost of treatment has been forecast to $2.4 billion [12]. Therefore, a method capable of predicting hip fracture risk can prevent the fracture and reduce the cost for treatment associated with that by providing a prior assessment of an elderly person.
The in vivo assessment of osteoporotic fracture risk is usually conducted by statistical models and by measuring bone mineral density (BMD) using Dual-Energy X-ray Absorptiometry (DXA) [13,14]. Although these methods are effective in determining the trends of osteoporosis and their correlations with fracture in large populations, limitedly accurate for assessing the individual fracture risk, e.g., osteoporotic fractures mostly occur with BMD measurement above the conventional osteoporotic threshold [15]. The World Health Organization (WHO) has currently adopted a diagnostic tool, Fracture Risk Assessment Tool (FRAX®), to evaluate 10 year probability of bone fracture [16]. It is possible that an actual risk may be underestimated in the FRAX® tool since not all risk factors are considered in this tool. For instance, FRAX® does not take into account the impact of fall, which is critical in assessing the hip fracture risk [17,18]. To consider both the structural and geometric parameters of the femur, hip structure analysis (HSA) program have been used to predict the fracture risk. Due to the use of beam model, HSA gives inaccurate results, especially in the femoral neck (FN) and intertrochanteric (ITC) regions, which are prone to osteoporotic fractures [19]. To overcome the limitations of the aforementioned methods, image-based finite element analysis (FEA) has been considered to be a promising technique for the assessment of in vivo bone strength [20] and can be used effectually for predicting fracture risk in advance.
Integrating medical imaging technologies such as DXA and QCT with FEA can predict the fracture risk more accurately in comparison with bone densitometry and diagnostic imaging. Bone fracture is mechanically governed by three groups of parameters: bone quality, bone geometry and loading/constraint conditions. The image-based FEA methods are able to integrate all those parameters, but densitometry techniques can only consider bone quality that is mainly measured by bone mineral density. Concerning lower potential health risk due to radiation dose and associated cost, DXA – 2D imaging modality – is primarily used in clinical assessment of osteoporosis. However, the strength of a femoral bone largely depends on its 3D anatomic structure, which is not correctly reflected in DXA-based FEA. The strength of the femoral bone predominantly depends on its geometry and structural property, the distribution of bone material and its properties within the entire structure. Hence, QCT-based FEA can include the factors that influence the hip/femoral fracture. However, a large number of CT based 3D FE analyses have been conducted on proximal femur to predict bone fracture risk, where von Mises failure criterion based on distortion energy theory [21–27] has been adopted regardless of its limitation of predicting other than yielding in isotropic ductile materials. Moreover, the bone is regarded as brittle material since the ultimate strain of metals is many times larger than that of bone. Experimental evidence also shows that bone, specially cortical bone, exhibits lower strength in tension than in compression [28,29]. Therefore, the aim of this work is to investigate the mechanics of femoral neck fracture due to stress variations considering the maximum tensile and compressive stresses generated at the neck owing to the single-stance and sideways fall.
The variations of stresses and their magnitude between the two loading configurations may have a non-trivial role in initiating a fracture at the femoral neck [30]. Since the strength of bone is non-uniform because of its complex structure and heterogeneous bone density, which is primarily originated with cortical and trabecular bone – two major components of bone (Fig. 1), the dissimilarity of the stress states play a crucial role for the femoral fracture. In an earlier work, Lotz et al. showed the concentration of compressive stress in subcapital and medial intertrochanteric region during stance, and the generation of large compressive stresses in the superior surfaces during fall [31]. The strength of proximal femur to resist fracture is also assessed around the femoral neck considering strain variations [32,33]. However, their analyses were oversimplified since linear isotropic material properties were considered, and a representative femur was selected from a large database, ignoring the anatomical variations of the femora. Moreover, an assessment criterion is needed to effectively predict the fracture risk of individual patient to prevent hip fracture. Hence, the aim of the current work is to analyze the femoral neck fracture by comparing the maximum tensile and compressive stresses, generated in the neck region at different load configurations, with the corresponding strengths. In the current analysis, the hip fracture risk has been assessed in terms of fracture risk indicator, η, which is the ratio of bone stress to strength. The fracture risk indicators for the single-stance and sideways fall will provide an insight into the effect of anatomical variations of the femora and their material properties, the severity of fall from mechanistic viewpoint and the mechanism of femoral fracture at the neck region.

Anatomy of human proximal femur (upper third of the femur [34], with permission from author).
The specific objectives of this paper are to: (1) conduct the FEA for the single-stance and sideways fall configurations using patient-specific 3D femoral bone; (2) compare the fracture risk indicators at the femoral neck for the aforementioned configurations to better understand hip fracture mechanics.
The paper is organized as follows. Section 2 describes the methods adopted in this work to generate the 3D FE model and to assign the inhomogeneous material properties for conducting patient-specific finite element analysis. Section 3 delineates the results and Section 4 interprets the significance of the results in predicting hip fracture risk.
QCT images of right femora of 10 anonymous adult have been considered in this work. The age and sex of the subjects are shown in Table 1. The CT datasets of the femora in Digital Imaging and Communications in Medicine (DICOM) format have been obtained, removing all personal information as required under human research ethics approval, from the Great-West Life PET/CT Centre located at the Health Science Centre, Winnipeg, Canada.
Age and sex of 10 anonymous subjects considered in the current study
Age and sex of 10 anonymous subjects considered in the current study
The scanned images were acquired in WINNIPEG PET/CT Center by SIEMENS S5VB40B CT scan machine. The acquisition and reconstruction parameters were 120 kVp, 244 mAs, and image matrix of 512 × 512 pixels. A high and a low resolution protocol with a slice thickness of 1 mm and 3 mm, respectively, were used with in plane spatial resolutions varying between approximately 0.78 mm × 0.78 mm and 0.98 mm × 0.98 mm. However, a slice thickness of 1 mm is preferable for constructing a 3D model of a femur from QCT images by separating the femur from pelvis, ensuring proper segmentation. Each voxel defined in the CT images is correlated to local bone density, which is expressed in Hounsfield Unit (HU) and resulting in an inhomogeneous density distribution. A calcium hydroxyapatite calibration phantom (Mindways Inc., Austin, TX, USA) was included during the scan to correct the scanner drift and for the accurate estimation of bone mineral density (gray values).
Image segmentation and FE model generation
Medical imaging processing software – Mimics® 16.0 (Materialise N.V., Leuven, Belgium) – has been used to obtain the three dimensional geometry of each femur from the corresponding two dimensional DICOM image dataset. The 2D images are stacked and converted into 3D models using the interpolation algorithm embedded in Mimics. The structure of bone is extracted by considering a range of gray threshold to generate the 3D geometric model of the femur. However, the segmentation is performed carefully to exclude the soft tissue prior to the generation of a three dimensional FE meshed model of the femur.
After the reconstruction of the three-dimensional femur geometry, the 3D FE meshed model, comprising 4 node linear tetrahedral elements, are generated for further analysis. The finite element mesh is checked and edited by using the mesh processing tools of Mimics to improve the quality of the tetrahedral elements. An adequate mesh density has been conserved to achieve model convergence. The generated mesh is then imported to MATALB® 14.0 (The MathWorks Inc, Natick, MA), where an in-house built code has been used to map material properties and to conduct the FEA.
Isotropic inhomogeneous material properties
An accurate determination of bone material properties plays a vital role in an image-based subject–specific FEA. Although bone is anisotropic [35,36], the existing empirical modulus-density relationships are for isotropic properties [37–41]. Hence, the bone material properties are considered isotropic and inhomogeneous to commensurate with a reliable modeling approach. The isotropic inhomogeneous material properties of bone can be mathematically derived from CT data [42–44]. A correlation between HU and CT gray values is required to determine the bone material properties. Hence, a femoral bone specimen is placed in 0.9% saline solution–saturated foam rubber within a plastic container [24]. Five tubes of QCT calibration phantom, containing distilled water and
Bone ash density is related to the equivalent
Rearranging Eqs (1) and (2) yields
There are a variety of material models for bone among which some directly depend on the HU [38,46] and others on the apparent density [24,42–44,46]. In this work, we have considered the following correlations to estimate Young’s modulus and compressive yield strength based on mechanical properties-density relationship of human femora [42,43]:
A constant Poisson’s ratio of 0.4 is assumed for the bone material in the present analysis [24,48].
Mapping of material properties from the CT scan on the FE model
Mapping of bone material properties from the CT images onto the finite element mesh is a standard practice in FEA [49–52]. The most common procedure is to assign the material data, HUs, onto the elements and to assign a number of different material definitions corresponding to equivalent ranges of HU [53–55]. However, instead of element wise, we have adopted node wise approach in this work. In this approach, only one material definition is required depending on the assigned densities and resulting in a cost-effective and time-saving calculation.
With our in-house built mapping algorithm, each nodal coordinate of the FE mesh is retrieved from the stack of CT slices considering the location of transverse plane (x and y location of each pixel) and the axial height (z values), and the corresponding material data are mapped on to the nodes. To accommodate the error due to the conversion of node coordinates from the spatial coordinates (x, y and z) into pixel indices (i and j), the HU at the corresponding location in the CT slices are averaged within a definite zone surrounding the nodal coordinates. Figure 2 shows a QCT image of a femur, the corresponding 3D meshed model constructed after segmentation, and the isotropic inhomogeneous distribution of material properties throughout the femoral bone. However, the distribution of modulus is patient specific and may vary considerably depending on many factors such as age, sex and bone loss.

(a) A QCT image of a patient’s femur including pelvis and muscle, (b) 3D FE meshed model of the femoral bone, and (c) isotropic inhomogeneous material properties distribution.
Two load configurations have been considered in the current work to simulate the effect of single-stance and sideways fall, which result in peak stresses concentrated in the femoral neck region. For the single-stance case, the load is applied vertically to the superior surface of femoral head [Fig. 3(a)], whereas the sideways fall has been simulated by applying the load laterally at the greater trochanter and constraining the nodes of the femoral head [Fig. 4(a)]. The nodes at the distal condyles of the femur are completely constrained in all three directions for both the configurations [56–58]. Although in real world the magnitude of load in the single-stance configuration is understandably less than the fall load [59,60], in the present work, an equal magnitude of load is applied to both the configurations to explore the effect of the sideways fall, which is believed to initiate the fracture by generating stress variations in the femoral neck region.
Boundary condition and stress distribution of single-stance configuration: (a) single-stance load, (b) maximum principal stress

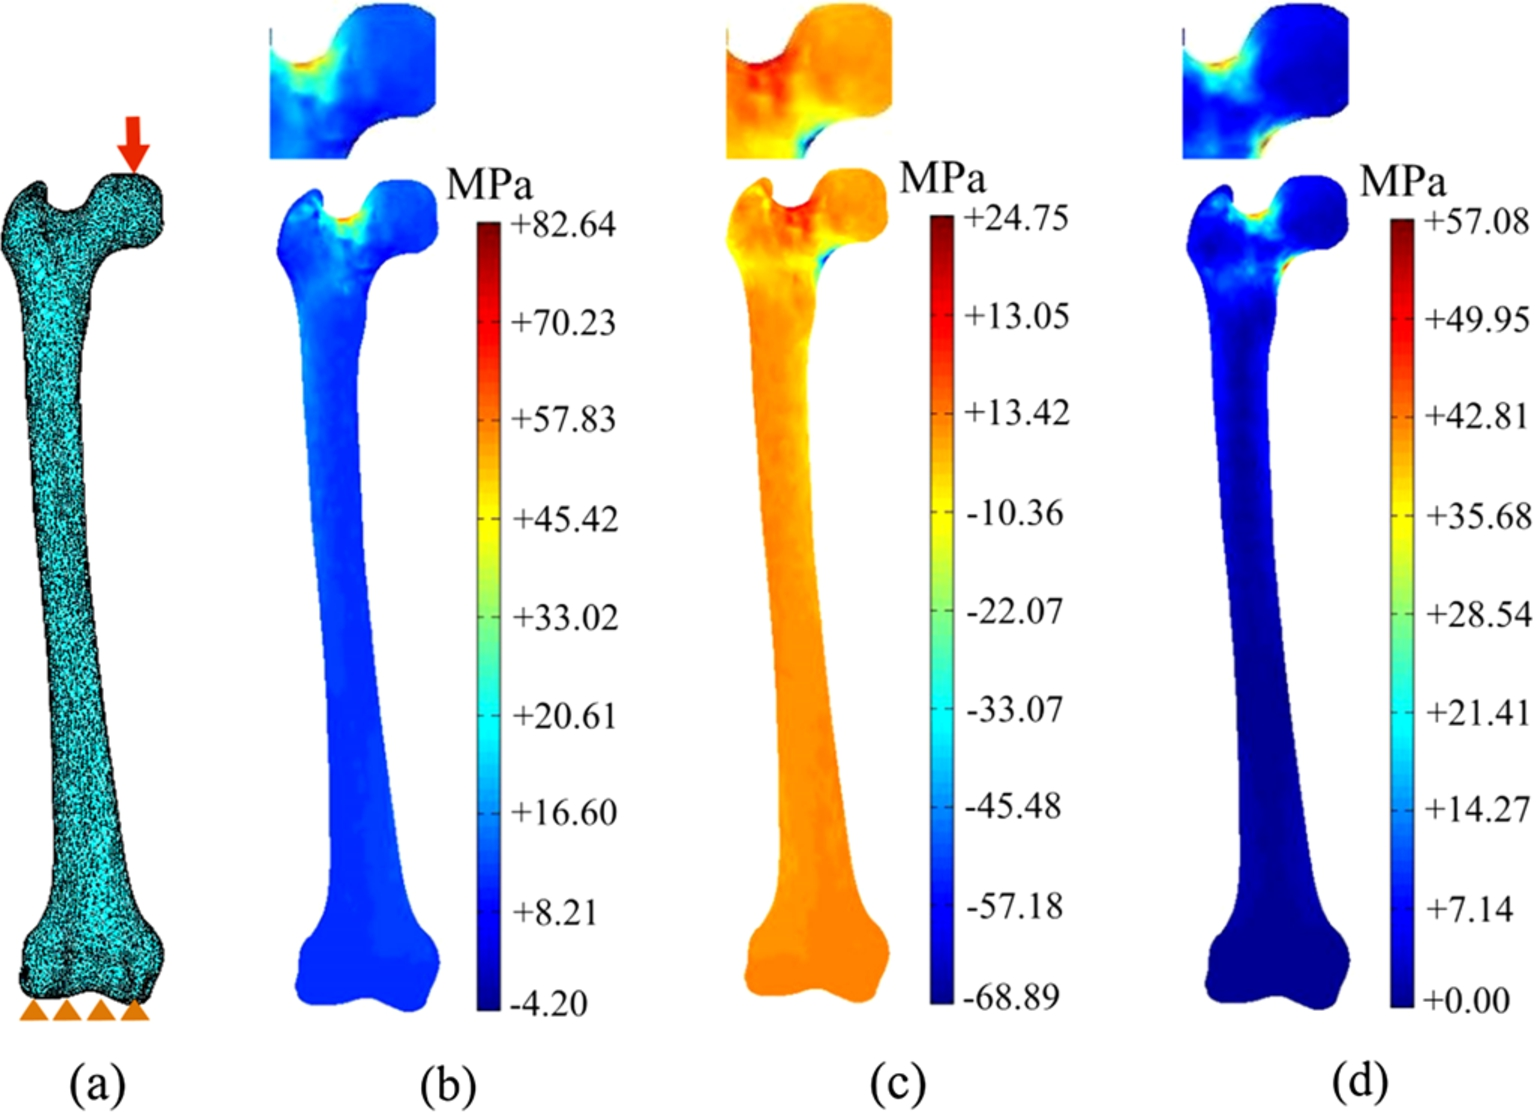
Boundary condition and stress distribution of sideways fall configuration: (a) sideways fall load, (b) maximum principal stress
The femora of 10 adults have been investigated in the current study to better understand the effect of sideways fall and the mechanism of hip/femoral fracture. Figure 3 shows the single – stance configuration with load applied vertically [Fig. 3(a)] and the distributions of the maximum principal stress
Figure 4 depicts the stress distribution in the same femur simulated for the sideways fall configuration [Fig. 4(a)], where the load of the same magnitude as in the one-leg stance configuration is applied laterally to the greater trochanter; the maximum and minimum principal stresses, and the von Mises stress distributions are shown in Fig. 4(b)–(d). The magnified view of stress distributions in the femoral neck region for single-stance and sideways fall are also shown respectively in Figs 3(b)–(d) and 4(b)–(d) to observe the generated stresses more clearly. The sideways fall reverse the stress pattern, developing compressive and tensile stresses at the superior and inferior surfaces of the neck region, respectively.
The von Mises stress

Comparison of fracture risk indicators for von Mises stress,
The femoral neck undergoes constant bending load during normal activities including single-stance loading. From structural point of view, downward force through the femoral head causes tensile stress in the superior surface of the neck and compressive stresses inferiorly, which result in greatest stresses in sub-capital and mid-femoral neck regions [Fig. 3(b), (c)]. In contrast, when the greater trochanter is impacted in sideways fall, the fracture is often observed at the neck being the weakest region. The sideways fall on the greater trochanter develops large compressive stress at the superior-posterior surface of the neck and tensile stress in the inferior region [Fig. 4(b), (c)]. Therefore, the principal stresses,
These fracture risk indicators in Eqs (7b) and (7b) can expound the mechanism of femoral fractures at specific regions. For the one-leg stance and sideways fall configurations, Fig. 6(a) shows the comparison between

Comparison of
The probability of hip fracture increases with age depending on a number of factors such as bone mineral density, bone morphology, body weight, and fall patterns. Any type of fall, irrespective of the patterns, may lead to hip fracture in elderly people. Moreover, the possibility of the fracture rises with lower bone mineral density due to the impact of fall. Hence, the two configurations – single-stance and sideways fall – have been chosen because of their ability to produce clinically relevant fractures. A femur typically supports the entire body weight during the single-stance configuration, whereas the load during the sideways fall from a standing height is reasonably higher than the body weight [59,60,64,65]. The resultant stress distributions are accordingly somewhat different and lack correlation because of the varying magnitudes of load applied in the two configurations. Therefore, in this work, an equal magnitude of load is applied to both the configurations to distinguish the effect of sideways fall from the stance.

Comparison of
The results indicate that hip fracture occurs not just because of the large impact force induced in sideways, but also due to the impact force, which is applied in a direction that is abnormal to the body physiology. In addition to the fact that bone has different tensile and compressive strength, the superior cortex of the femoral neck is usually thinner, whereas the inferior cortex is significantly thicker [66]. Bone loss also preferentially occurs at the superior aspects of the femoral neck [59]. The thinner superior cortex could make the femoral neck susceptible to failure by the generation of greater compressive stresses in consequence of the impact of loads associated with the fall [66]. Hence, it is obvious that the stresses are higher at the weaker region – region with lower mass density – and are demonstrated in Fig. 7. For the single-stance [Fig. 7(a)] and sideways fall [Fig. 7(b)] configurations, the fracture risk indicators,
The current work, however, has few limitations. One of the major limitations is the small sample size (ten femora). A larger sample size would yield a more statistically conclusive outcome, ignoring the fewer deviations. Moreover, in this analysis, we have considered only the right femora of the subjects. Hence, a larger sample size and the inclusion of both left and right femur will be considered in the subsequent work to have more statistically convincing results. Another limitation is the lack of quantitative validation. However, the stress variations at the femoral neck is somewhat observed experimentally [63,64,72] and can be apparently compared to validate the present analysis qualitatively. Nevertheless, further experimental validation using similar boundary conditions on human cadavers would be carried out in the future to substantiate the current approach. In the current investigation, only two loading conditions have been studied. However, a stance load may not necessarily be vertical but inclined, and a fall might occur in other orientations such as posterolateral, backward or anterolateral sides and hence may results a different fracture pattern. Additionally, the tension and compression of superior and inferior surfaces are also affected by other factors such as orientation of femur, diameter of the femoral neck, the angle of impact, and impact site and are required further investigations to get an inclusive idea about the femoral neck fracture due to fall.
The goal of the current work is to investigate the effect of fall that causes hip fracture by comparing both single-stance and sideways fall configurations. The fracture is assessed primarily based on the fracture risk indicators,
The impact of sideways fall develops a large amount of tensile and compressive stresses, which make the femoral neck to be a critical zone. The variation of stress states at the superior and inferior aspects of the femoral neck has been considered for both single-legged stance and sideways fall. The maximum-stress based fracture risk indicators have been found to provide a better assessment criterion for fracture risk prediction. Moreover, the understanding how the mechanics change between the two loading configurations will help us to prevent the hip fracture.
Footnotes
Acknowledgements
The second author would like to gratefully acknowledge NSERC and MHRC for the grants supporting the reported research. Thanks are directed to the Great-West Life PET/CT Centre located at the Health Science Centre, Winnipeg, Canada, for providing the CT datasets.
Conflict of interest
The authors declare no conflict of interest.