



Abstract
The proteins adsorption on biomaterials surface leads to changes in their structural conformation that may further influence the adhesion, migration and growth of cells. The aim of this study was to examine the attachment of collagen (calf skin type I) on bioactive glass powders and the conformational changes of the protein. Scanning electron microscopy analysis and X-ray photoelectron spectroscopy measurements indicate that the collagen cover the glass surface in a nanometric thin layer. The infrared amide I absorption signal shows pronounced changes in the secondary structure of the adsorbed collagen.
Keywords
Introduction
The proteins adsorption onto biomaterials surface is important for the long-term performance of the implants since the cells interacting with the implant will primarily react to the adsorbed protein layer and therefore the cellular response can be controlled by the adsorbed layer of proteins [1–3]. The characteristics of the proteins may influence their adsorption dynamics and structural conformation, both properties affecting the cell response in terms of adhesion, migration, proliferation and growth [4]. It is accepted that the adsorption process leads to changes in protein structural conformations, and the degree of the alterations depends on both the protein stability and the protein surface interaction [4,5].
Collagen, the major structural protein of the extracellular matrix and the most abundant protein in humans representing about 30% of the body protein content, forms fibres that provide tensile strength and rigidity to a variety of tissues such as bone, tendons, cartilage, skin, and blood vessels [6]. The essential role of collagen is to stimulate cell proliferation and differentiation, although it is not yet identified the type of collagen responsible for cell proliferation [7]. All members of the collagen family form a characteristic triple-helical domain as a common structural element, each helix being composed of at least one Gly–X–Y sequence structured in left-handed α-like helices, where the X and Y positions are often proline and hydroxyproline, respectively [6–9]. These three α-like helices are organized together to form the characteristic structure of collagen, a right-handed triple helix [6–9]. The molecular length of type I collagen is 300 nm, with a diameter of 1.5 nm [10]. In addition, there are chains of 9–26 amino acids at the amino and carboxyl terminals that are not incorporated into the helical structure. The average molecular weight of type I collagen, which is approximately 300 kDa, gives rise to high viscosity in solution [10]. Previously reported bioactivity studies confirmed that the hydroxyapatite formation upon the type I collagen functionalized bioglass scaffold surface, after immersion in simulated body fluid, was not hampered by the collagen loading, and a biomimetic surface composition of collagen and hydroxyapatite was formed, that further would favor increased osteoblast attachment and proliferation [11].
The purpose of this work was to investigate the interaction of the collagen with a sol-gel derived bioactive glass using scanning electron microscopy (SEM), X-ray Photoelectron Spectroscopy (XPS) and Fourier Transform Infrared (FT-IR). Our interest was to follow the coverage degree of the glass surface after adsorption of collagen, and the conformational changes induced in this protein after adsorption.
Materials and methods
Formation of glass
The bioactive glass system with the composition 45SiO2 · 24.5CaO · 6P2O5 · 24.5K2O (mol %) was prepared by two steps acid-base catalyzed sol-gel process. In the first step tetraethylorthosilicate (TEOS), ethanol (EtOH) and hydrochloric acid (HCl) were mixed together under constant stirring for 20 min. Then were added calcium nitrate tetrahydrate (Ca(NO3) · 4H2O) dissolved in ethanol, ammonium phosphate ((NH4)2 · HPO4) and potassium carbonate (K2CO3) previously dissolved in distilled water. In the subsequent base catalysis step, ammonium hydroxide (NH4OH) was continuously dropped under stirring of mixture until gelation, when a small amount of ethanol was added over and then the gel was left to age at room temperature (∼25°C) for 3 days. The obtained sample was dried in an oven at 75°C for 3 h, at 85°C for 1 h and at 120°C for 20 h, and finally heated at 300°C in air for 30 min. The surface area of the powdered sample was determined by measuring nitrogen adsorption/desorption at 77 K with surface area analyser Qsurf Series M1, on the basis of Brunauer, Emmet and Teller (BET) equation,
Surface modification
Protein attachment took place by incubating the glass sample in collagen solution. Collagen solution was obtained by dissolving 2 mg/ml calf skin type I collagen (Sigma-Aldrich) in 0.6% acetic acid, pH 3. The pH of collagen solution was increased from 3 to 6 by means of 4M KOH. The protein adsorption experiment was carried out by immersion of 0.4 g of powdered sample in 20 ml of collagen solution, in closable conical polypropylene flasks. The flasks containing glass powders in collagen solution were kept at constant temperature of 37°C for 24 h under static conditions in an incubator.
Methods
Scanning electron microscopy
The surface changes after glass powder incubation in protein solution were investigated by scanning electron microscopy. The SEM images were recorded using FEI Quanta 3D FEG 200/600 scanning electron microscope operating at an acceleration voltage of 20 kV. The powders were covered with Au to amplify the secondary electron signal.
Energy dispersive X-ray spectroscopy
The EDX micro-analysis was carried out using FEI QUANTA 3D FEG instrument operating at an accelerating voltage of 30 kV.
X-ray photoelectron spectroscopy
The XPS spectra were recorded with SPECS PHOIBOS 150 MCD system employing monochromatic Al–K
α
source (1486.6 eV), hemispherical analyser, charge neutralization device and multichannel detector. Samples were spread on a double-sided carbon tape and care was taken to ensure that the sample particles covered the tape. Experiments were performed by operating the X-ray source with a power of 250 W, while the pressure in the analyse chamber was in the range of
Fourier-transform infrared spectroscopy
Analyses of the bioactive glass and lyophilized collagen structures and assessments of the conformational state of the proteins adsorbed on the bioactive glass surface were examined by FT-IR spectroscopy. The FT-IR spectra were recorded in reflection configuration in the range 4000–400 cm−1 with spectral resolution of 4 cm−1 using a Jasco FT-IR-6000 spectrometer and KBr pellet technique. The recorded spectra were smoothed by a 5-point Savitzky–Golay smoothing function for background correction. Second-derivative spectral analysis was performed by using the JASCO Spectra Manager in order to locate the position of the overlapped components of amide I, which were further assigned to different secondary structures. The bands were deconvoluted with a Gaussian band profile, a linear baseline between 1600 cm−1 and 1720 cm−1 being previously applied. The secondary structure composition was determined from the areas of the individually assigned components and their fraction of the total area.
Results and discussion
The surface changes after glass powder incubation in protein solution observed by SEM were illustrated in Fig. 1. Random sized particles can be seen on the glass surface before protein adsorption (Fig. 1(a), (a′)), while the sample surface becomes smooth after collagen attachment (Fig. 1(b), (b′)). Taking into account the data reported by Jiang et al. [12] concerning the collagen assembly in a layer with average thickness of
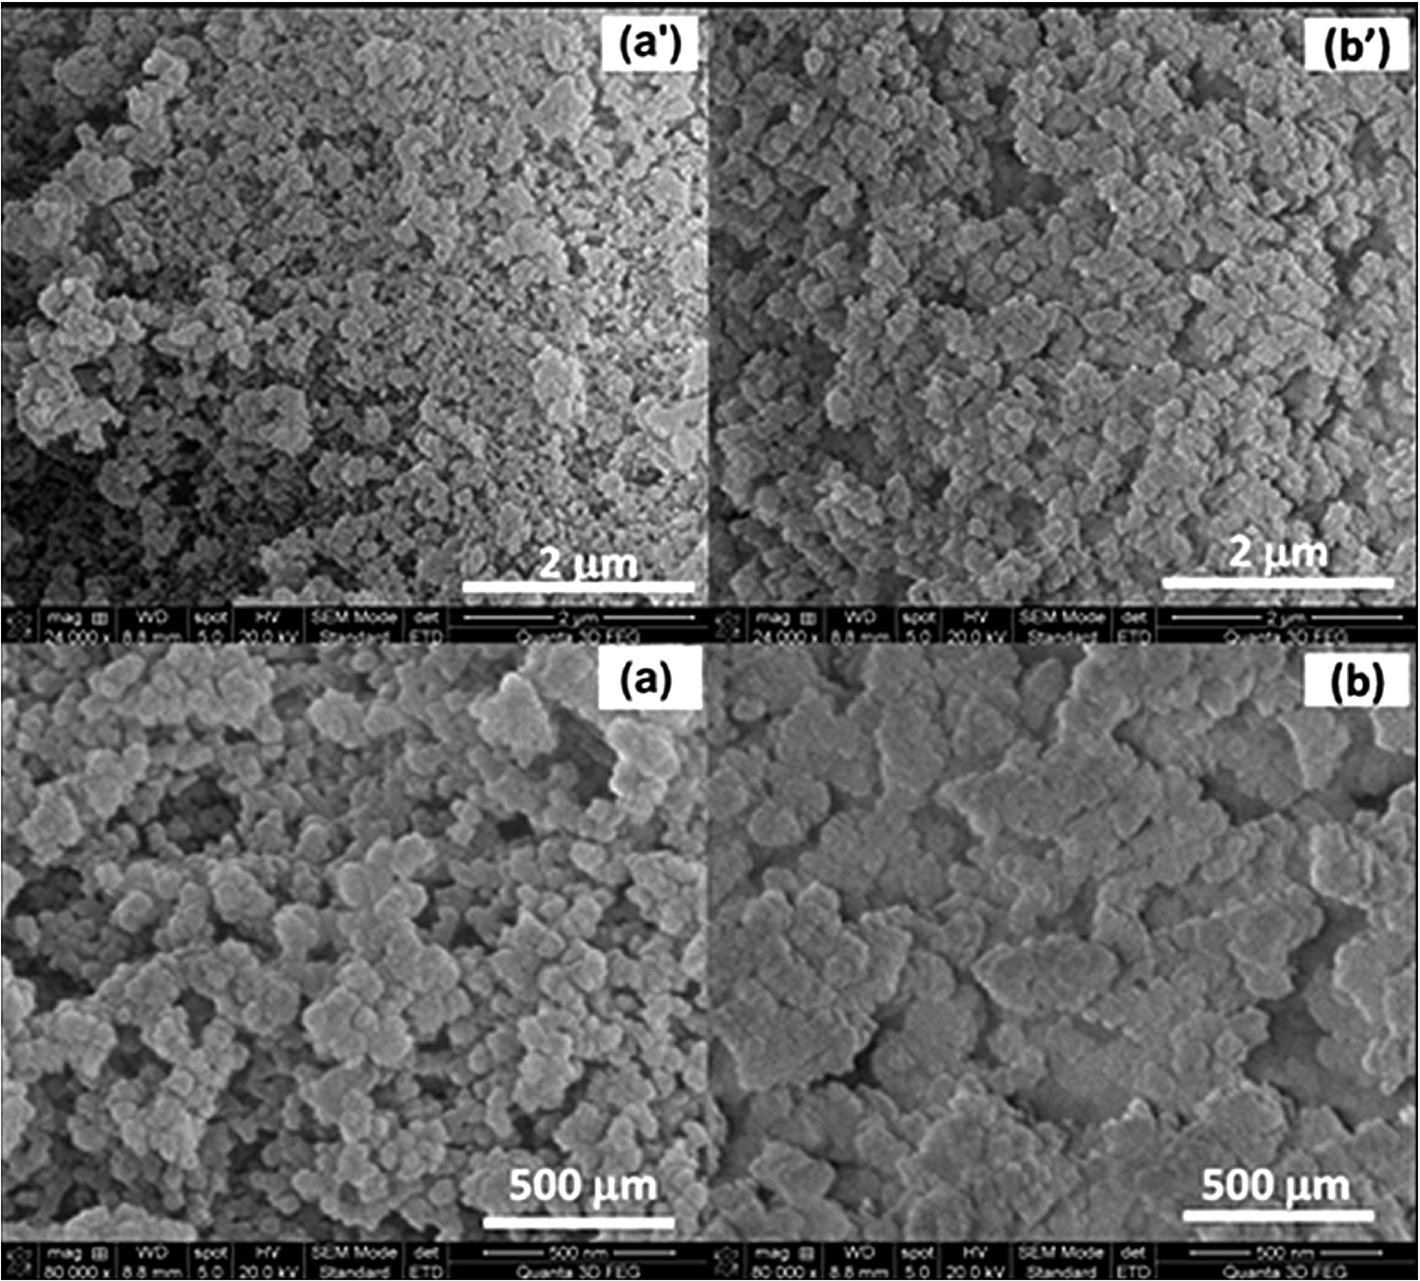
SEM images of the bioactive glass samples before (a), (a′) and after collagen (b), (b′) attachment. Note that the bar scale is the only difference between the pair of the images recorded for a certain sample.
After incubation in collagen solution, EDX analysis points out the occurrence of nitrogen (1.99 at %) and the increase of C/Si ratio. These first results prove the collagen adsorption on the bioactive glass surface.
In XPS survey spectra of the bare sample (Fig. 2) photoelectron peaks of silicon, calcium, phosphor, potassium, carbon and oxygen occur, and excepting carbon these are the elements entering in glass composition. Carbon contamination at the surface is ubiquitous and readily determined with XPS. The elemental compositions of all studied samples are summarized in Table 1. Protein detection on surfaces using XPS generally involves the detection of nitrogen and carbon in great amount [13–16]. The occurrence of nitrogen (Fig. 3) and an increased C/Si ratio is clearly evidenced after protein attachment (Fig. 2 and Table 1).

XPS survey spectra of the bioactive glass sample (a), lyophilized collagen (b), and bioactive glass after collagen attachment (c).
The attenuation of the substrate signal represents also a proof of the protein adsorption [16,17]. On the surface of the samples soaked in protein solution the content of the main elements forming the bioactive glass decreases after collagen attachment (see Table 1). It is evidenced that the calcium content decreases after protein attachment (Fig. 4). The potassium content increases on the material surface due to KOH which was used to increase the pH of collagen solution. The XPS results suggest that the collagen does not totally cover the glass surface or the thickness of collagen layer is less than 10 nm, because XPS technique provides information about the first 0.5–10 nm from the sample surface. As mentioned above, the attached collagen layer is expected to have a thickness of about 3 nm, and to cover completely the glass surface.
Elemental surface composition determined from XPS survey spectra, before and after immersion in collagen solutions
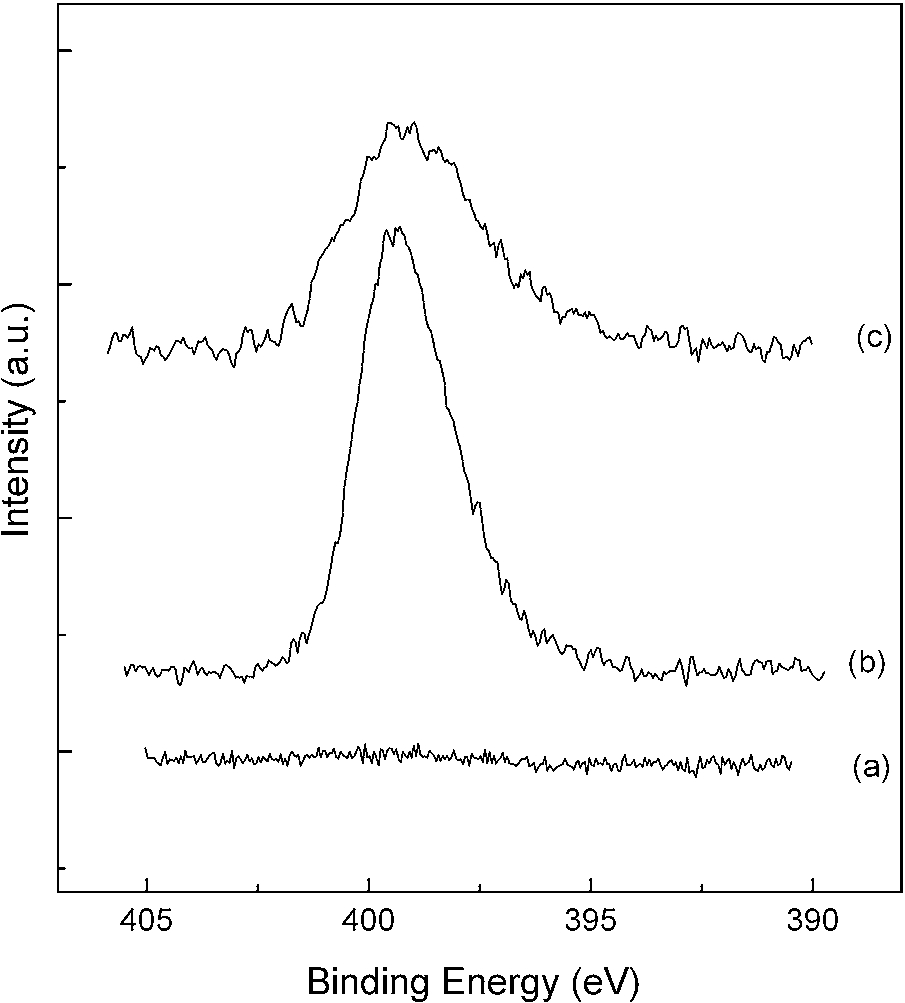
N 1s high-resolution XPS spectra of the glass sample (a), lyophilized collagen (b), and glass sample after the collagen attachment (c).
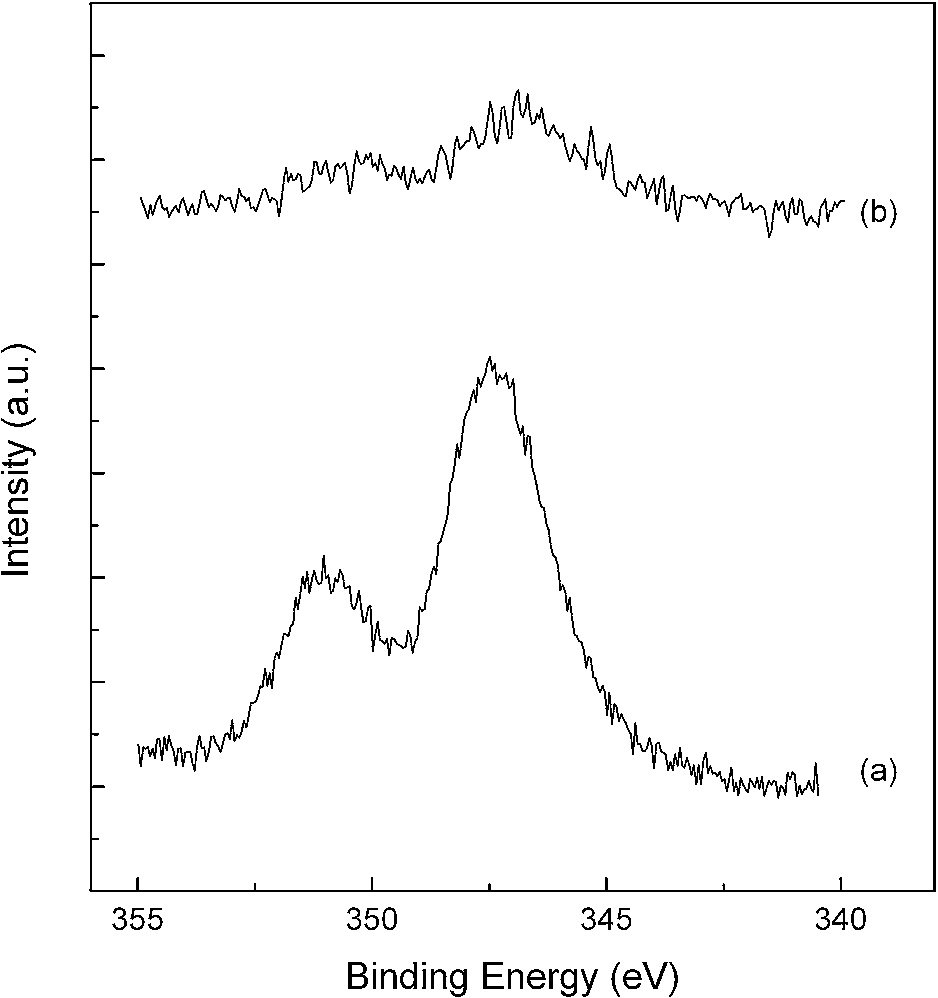
Ca 2p high-resolution XPS spectra of the glass sample (a), and glass sample after the collagen attachment (b).
The increase of nitrogen to carbon ratio (N/C) can be also used as indicator of protein deposition [16–18]. This ratio is greater than 0.23 after immersion in protein solutions, indicating the attachment of protein on bioactive glass surface [18]. The deconvolution of N 1s core level spectra (Fig. 5) shows two components for collagen, centred at 398.5 and 399.5 eV, characteristic of C–NH2 groups in proteins [14,17].
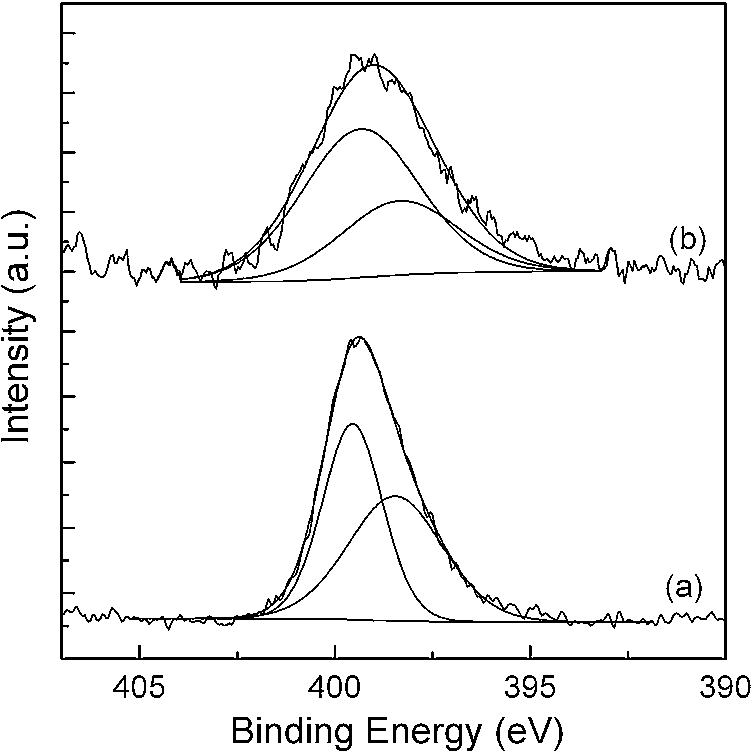
Deconvoluted N 1s high resolution XPS spectra of the lyophilized collagen (a), and glass sample after the collagen attachment (b).
Fourier-transform infrared spectra of the SiO2–CaO–P2O5–K2O bioactive glass show typical absorption bands (Fig. 6). According to the literature [19] the bands located at 1085 and 800 cm−1 can be attributed to the Si–O–Si stretching vibration, while the band around 467 cm−1 can be ascribed to the Si–O–Si bending vibration. The absorption signal at 964 cm−1 could be assigned to both SiO4 units containing two non-bridging oxygens [20,21] and P–O symmetric vibration of the PO4 3− groups [21]. The stretching vibration of the phosphate groups that give rise to signals around 604 and 565 cm−1 [21,22]. The bands around 1420 cm−1 were related to carbonate groups [23].
FT-IR spectra of proteins exhibit several absorption signals originating from the amide groups, however, the most important bands are given by amide I (∼1650 cm−1), amide II (∼1550 cm−1) and amide III (1400–1200 cm−1) [24,25]. The bands at 1450 and 1400 cm−1 were assigned to the CH2 deformation motion and to the vibration of amino acid side chains, respectively [25,26].
The infrared spectra after collagen attachment exhibit bands characteristic for amide II around 1550 cm−1 that are due to the stretching vibrational modes (Fig. 6). Comparative analysis of the amide I spectral regions, before and after protein adsorption, shows both a frequency shift and a broadening of the amide I signal from 1628 cm−1 to 1647 cm−1 (see Fig. 6). The appearance of the characteristic band of amide II together with the shift and broadening of the amide I signal, in the spectra recorded after proteins adsorption, is an indication of protein presence on the sample surface.
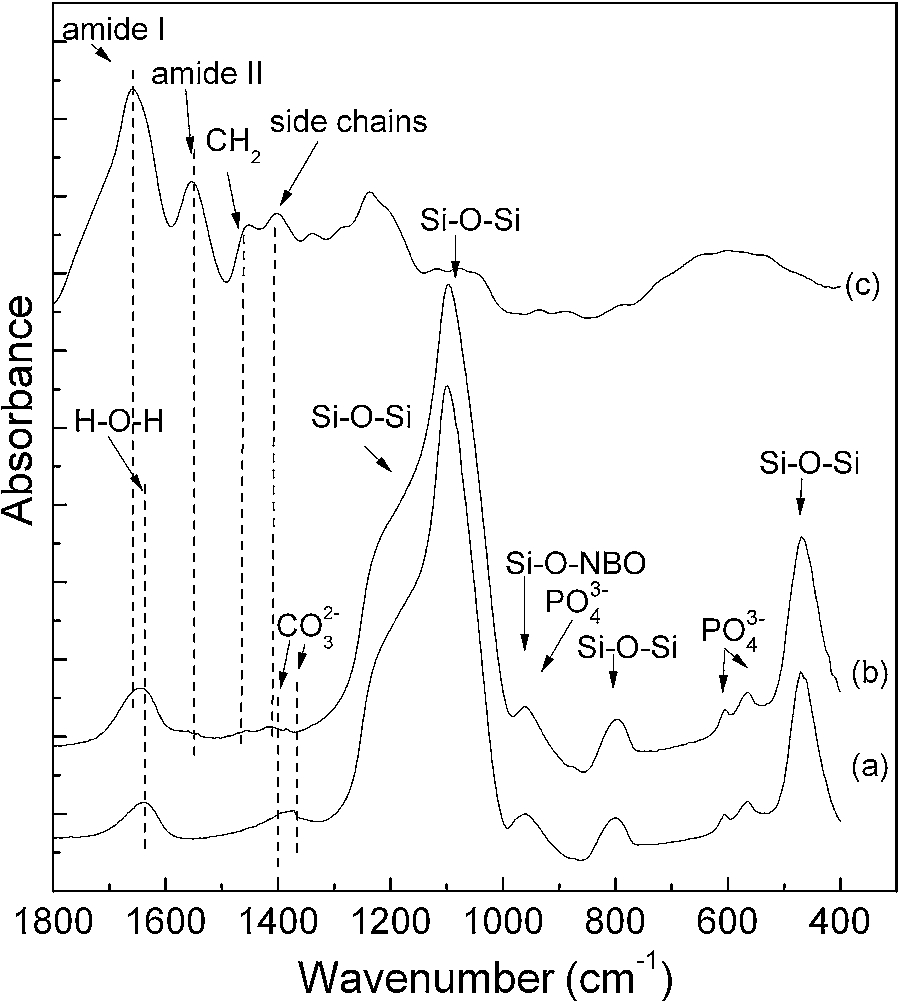
FT-IR spectra of the glass sample (a), the glass after the collagen attachment (b) and lyophilized collagen.
The secondary structure of the proteins can be evaluated from the FT-IR spectra using the amide I, II and III absorption bands [25], the amide I band being the most sensitive to conformational changes of the protein secondary structure. The components obtained by deconvolution of the amide I band (Fig. 7) can be assigned to specific types of secondary structure based on the correlations between crystallographic structures of proteins and their FTIR spectra [27].
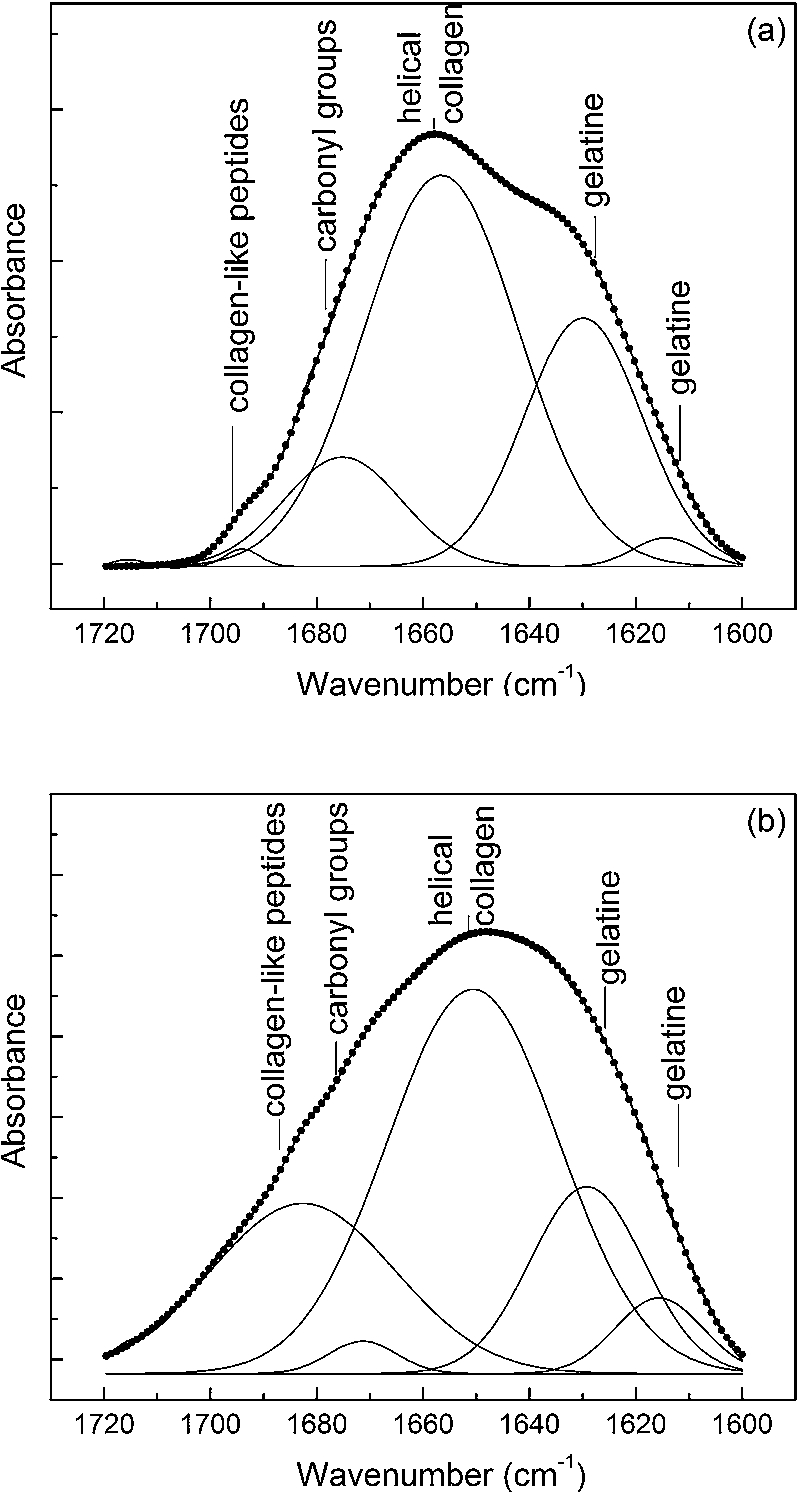
Deconvolution of the amide I (1700–1600 cm−1) absorption band of lyophilized collagen, before (a) and after (b) its attachment on the bioactive glass surface.
Due to the particular triple helical structure of the collagen, the infrared band assignment of the features underlying the amide I component of this protein is difficult. Several studies have attempted to correlated the collagen secondary structure and the band shape of the amide I infrared feature [9,28–32]. The band located around 1657 cm−1 is assigned to the triple helical hydrogen bonded conformation of collagen chains [28,31], while the bands observed near 1614, 1630 cm−1 are due to denaturated collagen (gelatine) [28,31,32]. The absorption signals at 1695 and 1675 cm−1 are associated with helices of aggregated collagen-like peptides also found in gelatine [31,32] and carbonyl groups from collagen lateral chains, respectively [33]. After collagen adsorption on the bioactive glass surface one notices a decrease of the components corresponding to triple helix, denaturated collagen and carbonyl groups from collagen lateral chains and an increase of the aggregated collagen-like peptides, demonstrating that the adsorption process drove the collagen conformation to a less ordered structure (Fig. 8).
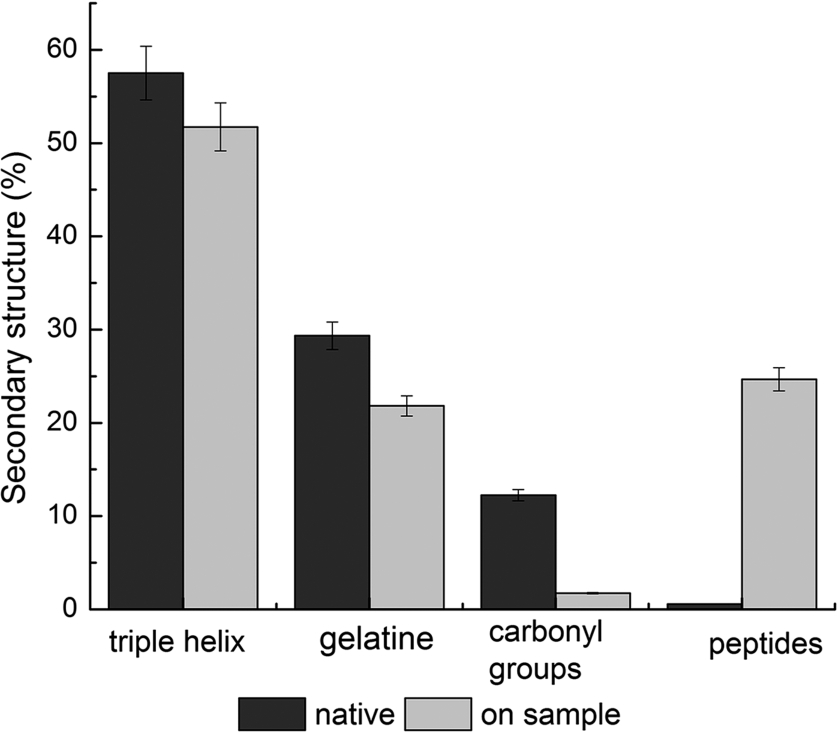
Distribution of secondary structure elements in lyophilized collagen and collagen coated bioactive glass. The uncertainty due to experimental and fitting procedure is within the limit of ±5%.
These conformational changes of the collagen adsorbed on the glass surface could be determined by electrostatic and hydrogen bonding interactions which lead to changes in secondary structures of the protein molecules [26].
Additional information regarding collagen attachment on the surface of glass particles was obtained from the analysis of XPS core level spectra of C 1s and O 1s photoelectron.
In the binding energy range from 275 to 295 eV, beside the high-resolution XPS spectrum of C 1s is recorded a peak around 293.4 eV, which corresponds to K 2p photoelectrons [13]. The main peak occurring at 284.6 eV for the bear sample is due to carbon contamination. In order to clarify the contribution of proteins to carbon spectrum, a curve-fitting analysis of the experimental carbon high resolution spectrum was performed. For the protein attaching sample the carbon spectrum exhibits the multicomponent peaks shape expected for adsorbed proteins. The C 1s peaks of pure collagen and collagen after attachment on bioactive glass surface were fitted with three components (Fig. 9). The components in deconvoluted C 1s high resolution spectrum of adsorbed collagen, around 284.6 eV and 288 eV, correspond to aliphatic carbon and –CO–NH– peptide carbon, respectively [29,34], while the component around 282.8 eV can be attributed to Si–C bond [35,36] and to C–N–C bonds [37]. These values are in good agreement with that reported for carbon in proteins. The presence of adsorbed proteins was revealed by the appearance of the C 1s component located near 288 eV that arises from the carbon atoms in the amide groups [38,39]. By following the C 1s peak decomposition of the collagen attached on the glass powders one can observe the appearance of this component near 288 eV.

Deconvoluted C 1s high resolution XPS spectra of the glass sample (a), lyophilized collagen (b), and glass sample after the collagen attachment (c).
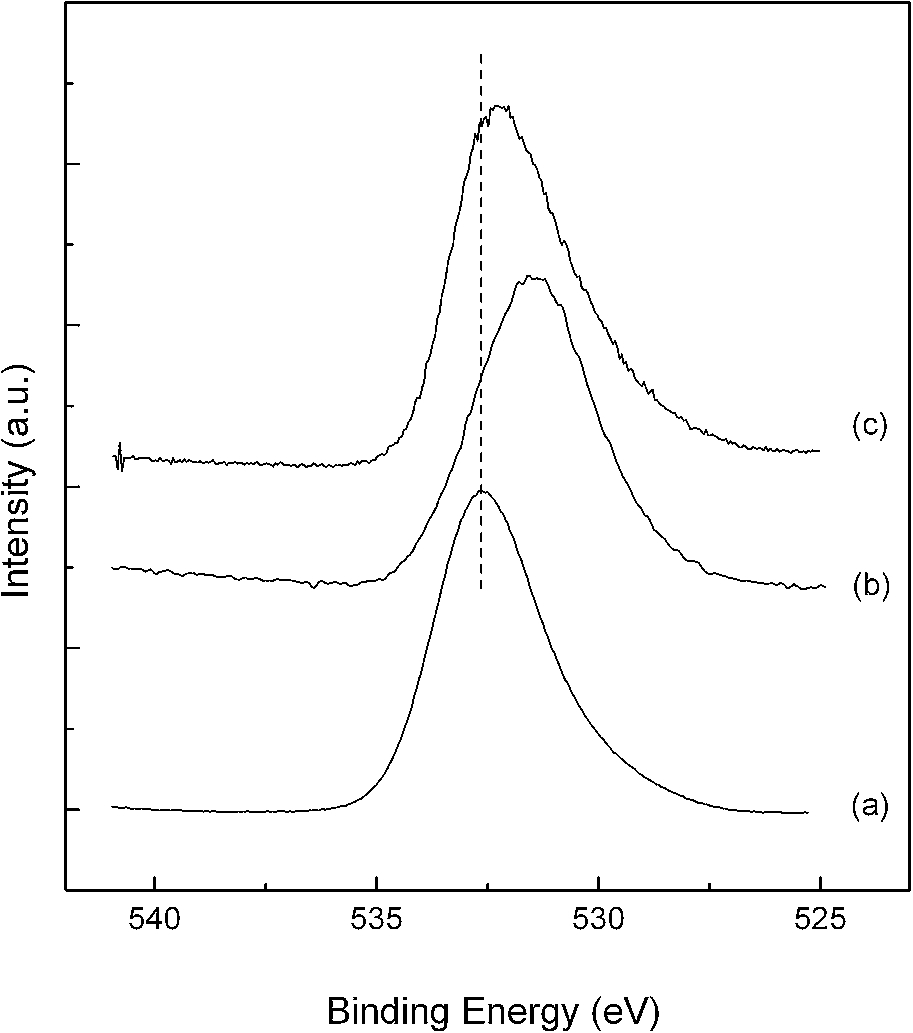
O 1s high-resolution XPS spectra of glass sample (a), lyophilized collagen (b), and glass sample after the collagen attachment (c); the dotted line indicates the shift of O 1s peak in accordance with the O 1s of the proteins.
The oxygen peak recorded on bare sample results from the superposition between the –OH groups and oxygen atoms entering the oxide matrix. The O 1s photoelectron peak after protein attachment on bioactive glass surface is broader and shifted from 532.8 eV to 532.3 eV binding energy, mainly on the account of the collagen component located at 531.4 eV (Fig. 10). The amount of oxygen decreases on the outermost layer of the glass powders after immersion in collagen solution, due to the lower oxygen content in the attached protein as compared with the oxygen content of the covered powders. Therefore, the XPS O 1s data obtained from the surface of bioactive glass powders covered with a thin collagen layer reveal the presence of peptides oxygen as an additional proof of protein adsorption.
The microscopic and spectroscopic analysis performed by SEM, XPS and FT-IR demonstrated the collagen adsorption on the 45SiO2 · 24.5CaO · 6P2O5 · 24.5K2O bioactive glass surface. The collagen completely covered the surface by forming a thin protein layer with a thickness of few nanometers. The presence of adsorbed proteins was revealed by the increase of C/Si ratio on the outermost layer of glass, the rise of the N 1s signal and of C 1s component located near 288 eV in the XPS core level spectrum, due to carbon atoms involved in amide groups.
The results on secondary structure of amide I obtained by deconvolution of infrared absorption band using the second derivative procedure showed that collagen changed the conformation to a less ordered structure upon interaction with the glass surface. The secondary structure alteration can originate from electrostatic and hydrogen bonding interactions.
Footnotes
Acknowledgement
This research was accomplished in framework of PN-II PCCA 78/2012 project granted by UEFISCDI – Romania.
Conflict of interest
The authors have no conflict of interest to report.