



Abstract
Intravascular ultrasound (IVUS)-based tissue characterization is invaluable for the computer-aided diagnosis and interventional treatment of cardiac vessel diseases. Although the analysis of raw backscattered signals allows more accurate plaque characterization than gray-scale images, its applications are limited due to its nature of electrocardiogram-gated acquisition. Images acquired by IVUS devices that do not allow the acquisition of raw signals cannot be characterized. To address these limitations, we developed a method for fast frame-by-frame retrieval and location of calcification according to the jump features of radial gray-level variation curves from sequential IVUS gray-scale images. The proposed method consists of three main steps: (1) radial gray-level variation curves are extracted from each filtered polar view, (2) sequential images are preliminarily queried according to the maximal slopes of radial gray-level variation curves, and finally, (3) key frames that include calcification are selected through checking the gray-level features of successive pixel columns in the preliminary results. Experimental results with clinically acquired in vivo data sets indicate key frames that include calcification can be retrieved with the advantages of simplicity, high efficiency, and accuracy. Recognition results correlate well with manual characterization results obtained by experienced physicians and through virtual histology.
Introduction
Backgrounds and medical context
Cardiac vessel disease is caused by atheromatous plaques that build up along the tunica intima (inner layer) of coronary arterial walls. Detection, tissue-typing, and description of the accumulated plaques are essential to diagnose and plan an interventional treatment of coronary artery diseases [1].
Intravascular ultrasound (IVUS) imaging is currently the most sensitive methodology that invasively detects and measures advanced atheroma within living individuals [2]. Owing to different absorption and reflection properties of different wall tissues, the morphometry and composition of vessel walls, including possible plaques, are visible with different gray scales on echo images [3] (see Fig. 1).
Retrieval of key IVUS frames, including plaques, and discrimination between components of plaques are invaluable in predicting plaque progression and regression. In clinic, IVUS tissue characterization tends to be performed by manual labeling and interpretation because of the relatively low resolution, high speckle noises, non-uniform luminance, and random presence of various artifacts within the images [4]. However, frame-by-frame visual analysis is a complicated, subjective, and tedious process that depends highly on the specialist.
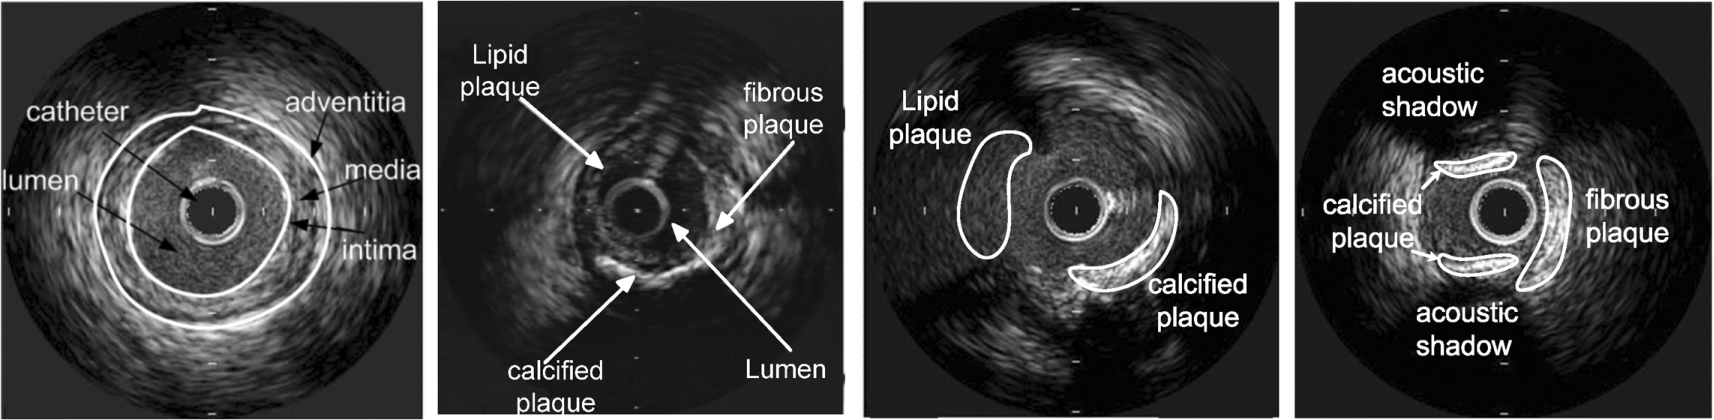
Typical IVUS gray-scale images.
Automated retrieval of IVUS data sets to identify plaque tissues and determine their composition can provide objective, quantitative, and reproducible measures of plaques. Thus far, two types of methods have been proposed according to the source data: radio frequency (RF)-based and image-based.
Raw backscattered RF signals are better data sources than reconstructed gray-scale images for tissue characterization due to the higher resolution of unprocessed data, especially for fatty and fibrotic plaques [5–10]. Recently, three different IVUS tissue characterization software systems based on the analysis of RF signals, namely, virtual histology (VH)-IVUS (Volcano Therapeutics, Inc., Rancho Cordova, CA, USA), integrated backscatter (IB)-IVUS (YD Co., Ltd, Nara, Japan), and iMap (Boston Scientific, MA, USA), became commercially available [11,12]. Methods to characterize tissues through the analysis of textural features during the reconstruction of gray-scale images from RF signals were also proposed in [13–17]. However, one limitation of RF-based methods relates to their dependence on electrocardiogram (ECG)-gated acquisition [4]. The RF signals are acquired according to the R-R wave amplitude of recorded ECG signals during catheter pullback. When ECG signals are not available or R-wave amplitude is too low, the RF-based techniques cannot be used to analyze coronary atherosclerotic plaques. Moreover, they need a large storage to save the IVUS backscattered signals of every subject. Standard outputs of most currently used IVUS equipment in clinic are also routine gray-scale images satisfying the DICOM (Digital Imaging and Communications in Medicine) standard, and raw data are not always available [3]. Related hardware of these IVUS devices should be improved to use RF-based techniques. Another limitation is that RF analysis cannot characterize the areas with acoustic shadows (e.g., calcium and guidewires) as image-based methods can [18].
Methods based on computerized image analysis adopt conventional gray-scale images, which are relatively easier to acquire than RF signals, to characterize plaques. Almost all image-based methods have adopted textural features as quantitative indices [4] combined with priori knowledge about plaque features to identify and classify plaques. For example, in [19], a semi-automated plaque characterization method based on the extraction of texture, intensity-based, and geometrical features as well as feature classification was presented. The method requires accurate detection of the media-adventitia and lumen borders. In [20], a method was presented to classify plaque regions into three classes: soft plaque, hard plaque, or hard plaque shadow. In [21], the performance of five statistical texture analysis techniques (i.e., first-order statistics, Haralick’s method, Laws’ texture energies, neighborhood gray-tone difference matrices, and texture spectrum method) in distinguishing plaques from IVUS images were evaluated. In [22], a detailed summary of the previous study on IVUS tissue characterization adopting textural feature analysis was given. A conclusion that textural descriptors alone are not suitable to distinguish mixed plaques in IVUS gray-scale images was finally drawn. In [23], a context-based framework built on a global object context and on mutual positions of local descriptors was proposed to retrieve IVUS images according to their vascular morphology. In [4], a combination of gray-scale-based features and textural descriptors (LBP, modified run-length, and neighboring gray-level) was adopted to extract IVUS textural features. Support vector machine (SVM) and ECOC classifier were then employed to classify feature vectors. In [24], tissue echomorphology was modeled by means of a mixture of Rayleigh distributions, and model parameters were estimated with the expectation maximization algorithm. The aforementioned methods are based on the extraction and classification of image textural features. They can be used to discriminate plaque compositions in an individual IVUS frame. However, their direct applications in sequential image retrieval are limited due to high computation cost and low automation.
Dense calcium, the most unusual kind of plaque tissue, is characterized by the high echoreflectivity and absorption of the emitted pulse from an ultrasonic transducer and a deep acoustic shadow behind the tissue in echo images. Gray-scale IVUS imaging features both high sensitivity and specificity in detecting calcium [19]. One kind of method for detecting calcification from IVUS images is to locate the calcified region after extracting the lumen and media-adventitia borders [25] based on the snake model or geometric deformable model [26]. A limitation of this kind of method is that it requires the accurate segmentation of inner and outer borders of the vessel wall in each frame. However, such segmentation is difficult to achieve, especially for IVUS images that include calcification. Another kind of method is to directly detect calcification by automatic thresholding of gray-scale images. The acoustic shadow that usually follows calcification regions is used as a discriminant of other bright regions of the image [27,28]. For example, the acoustic shadow was enhanced and recognized using an adaptive threshold method in [29]. In [30,31], calcium quantification was performed through an adaptive thresholding segmentation based on Otsu’s method combined with an analysis of the acoustic shadow regime. The 2-D Renyi’s entropy was used to adaptively threshold the IVUS image that includes calcifications in [32]. In [33], Rayleigh mixture model and Markov random field were adopted to coarsely detect calcified plaques.
Objectives of the work
This paper presents a novel four-step coarse-to-fine strategy that retrieves calcification rapidly without context information from routinely acquired sequential IVUS gray-scale images: (1) original images are filtered to reduce noise, (2) radial gray-scale variation curves (RGVC) are extracted from each filtered polar view, (3) an automatic thresholding scheme based on the jump features of RGVCs is employed to coarsely detect the location of calcified plaques, and (4) coarse query results are refined to remove pseudo calcified plaques by checking the gray-level features of neighboring pixels. For validation, we evaluate the correlation between the calcification detected by our method with the calcified tissues obtained by experienced physicians and by VH-IVUS.
The rest of this paper is organized as follows: Section 2 discusses the proposed method, including image pre-filtering, detection of RGVCs, coarse retrieval of calcified plaques, and refinement and location of calcified plaques. Section 3 lists the experimental results and discussions are given in Section 4. Finally, Section 5 summarizes and concludes this study.
Method
Pre-filtering
The original IVUS images are first filtered with speckle-reducing anisotropic diffusion (SRAD) [34] to reduce speckle noises without blurring or removing the edges or details of calcifications. First, the diffusion coefficient
In Eq. (1), q is the instantaneous coefficient of variation determined by
The first and second step are repeated for P times until the final result image
Extraction of radial gray-scale variation curves
Dense calcification blocks the transmission of ultrasound waves and is thus seen as a very bright area with black acoustic shadows behind in ultrasonic images. The intensities of normal wall tissues and soft plaques are relatively low because ultrasound waves can pass through these tissues. In consequence, the gray scales along the angular direction within the calcified plaque are obviously different from those within non-calcified regions in polar coordinates of the IVUS image.
To model the difference, each filtered IVUS image
(RGVCs).
For an IVUS polar view
A total of 360 RGVCs are obtained for each IVUS frame if 1° is taken as the angular step. The RGVCs represent the variation of gray levels along each radial radius in the polar view. Figure 2(a) and (b) show an example of an IVUS image. The figures show that both RGVCs along radii 1 and 2 are not smooth and change abruptly because of speckle noises and useless textures. Figure 2(c) and (d) show the filtered images. Obviously, both RGVCs are smoothed and their peaks are more prominent than the original ones.

RGVCs of an IVUS image. (a) Original image. (b) Filtered image with SRAD. (c) RGVCs along radii 1 and 2 in (a). (d) RGVCs and their slope profiles along the radius 1 and 2 in (b).
As shown in Fig. 2(d), the RGVC along radius 1 changes more abruptly at the interface between the calcification and the acoustic shadow compared with that along radius 2, which belongs to the non-calcified region. The maximal slope of each RGVC is compared with a threshold ε to coarsely retrieve calcification:
The threshold ε is adaptively selected for each IVUS frame. The detailed steps are as follows:
First, for a filtered polar view
Second, the elements of
Third, the sum of the variances of
Retrieval refinement
Several incorrectly detected bright regions may be included in the preliminary result. To refine the query and improve the robustness, the intensity features of successive N columns of pixels are checked in the preliminary query result. If a column of pixels as well as successive N columns within their neighborhood are determined to belong to the calcified region, these pixels within this neighborhood are identified as the calcification; otherwise, they are non-calcification. The frames that include calcification are finally retrieved and calcified regions are located. Obviously, N should be properly selected to obtain robust retrieval. The dependence of retrieval accuracy on the parameter will be discussed in Section 4 according to experiments with in vivo image data.
Experimental results
We validated our method by studying in vivo data acquired during a routine cardiac catheterization intervention. Sequential images were recorded with a Jomed Endosonic (Beringen, Switzerland) IVUS imaging system. Informed consents were obtained from each patient. MATLAB (MathWorks, Natrick, MA, USA) implementation on a PC equipped with a 2.6 GHz Intel Pentium III Xeon Tanner processor with 2G RAM was used in this work.
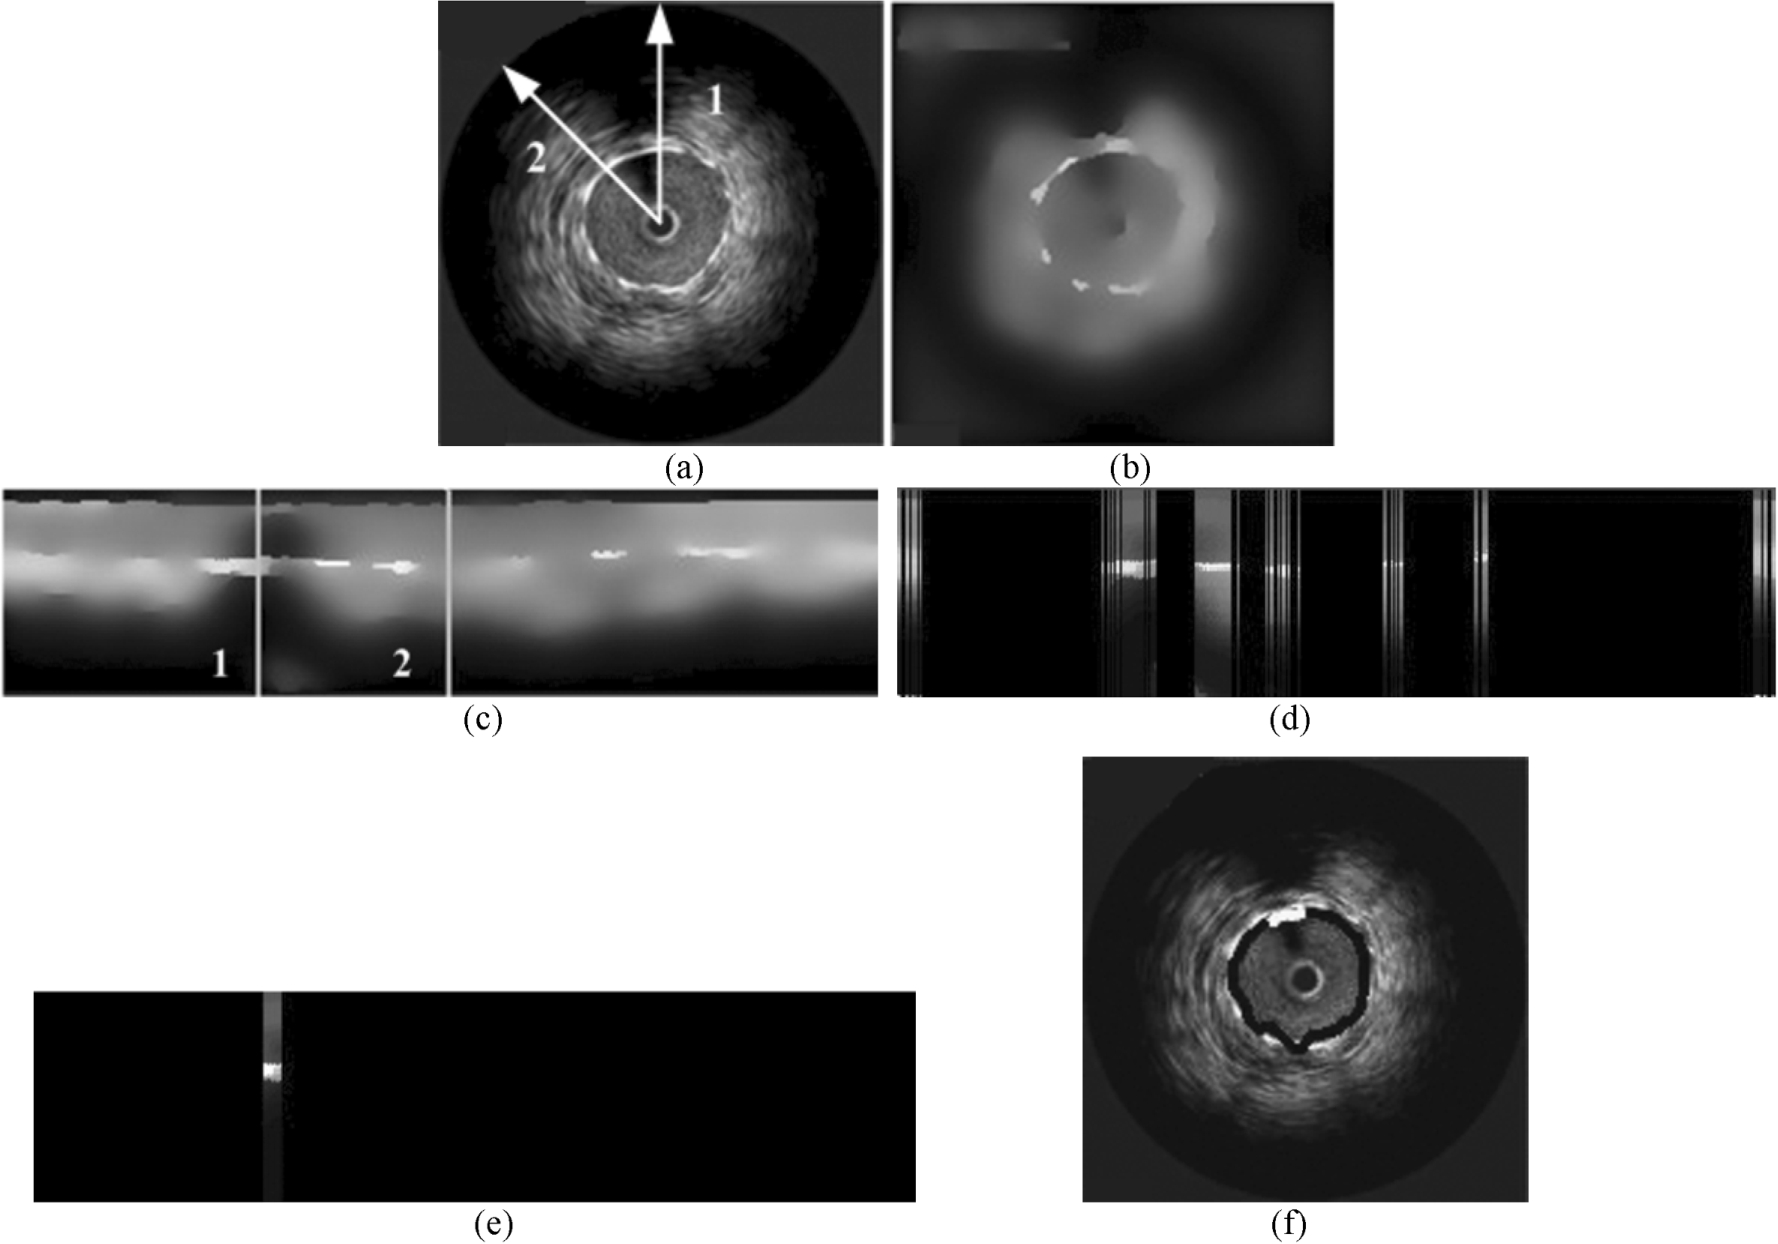
Retrieval results of calcification from an IVUS image. (a) Original image. (b) Filtered image with SRAD. (c) Polar view of (b). (d) Preliminary query results. (e) Detected calcification in the polar view. (f) Cross-sectional view with the detected calcification and lumen contour.
Figure 3(a)–(c) respectively show an IVUS image, as well as the calcification before and after SRAD filtering, where the iteration time is 100. An obvious acoustic shadow is apparent behind the calcification along radius 1, while no acoustic shadow is detected behind radius 2. The RGVCs and their slope curves along radii 1 and 2 are shown in Fig. 2(d). The maximal slope of the RGVC along radius 1 is remarkably larger than that along radius 2. Figure 3(d) shows the preliminary retrieval result, where ε was set as 50. Radius 1 was preliminarily determined to be the calcification region, while the pixels along radius 2 were discarded. Clearly, the preliminary result includes many non-calcification regions. The refinement of the example is shown in Fig. 3(d) and (e), where N is experimentally set as 6. This value means that if a column of pixels as well as six or more successive columns within their neighborhood in the polar view are preliminarily determined to belong to the calcified region, then this neighborhood is finally identified as the calcification. Figure 4 shows three successive frames that include calcification retrieved from the experimental sequence comprising 200 frames, taking a total of 0.47 s when

Three successive frames including calcification retrieved from an experimental sequence with 200 frames.

Three frames with calcification retrieved from an experimental sequence that included 300 frames.
Comparison to texture analysis methods
To quantitatively evaluate our method, three automated methods were compared: our method and two texture analysis methods. The first texture-based method proposed in [35] adopts low-level statistics [i.e., one-order statistics (including mean, standard deviation, coefficient of variation, skew, kurtosis, and entropy of histogram)] and a co-occurrence matrix to describe the image gray-level distribution and an SVM classifier to classify tissue features. This method is called gray-level method for short. Another method proposed in [36] uses K–L transformation to extract classification information and an SVM classifier to determine plaque type. It is called K–L method for short. Calcifications in all the images were traced and labeled manually by experienced physicians to serve as the ground truth for comparison.
Table 1 summarizes the results of three in vivo image sequences with automated methods and the manual operation. In the table, the processing time does not include the time cost for reading and displaying images. We can see that automated processing is much faster than manual operation. The accuracy of our method is higher than that of the gray-level method but is similar to the K–L method. However, the K–L method extracts multi-features of images for classifying through K–L transformation and designs an SVM model to classify image features. In our method, the existence of a calcification is determined only according to the jump features of RGVCs without image segmentation, feature extraction, and feature classification. Therefore, the complexity of our method is much lower than that of the K–L method. These experimental results demonstrate that our method is valid, simple, and fast in the retrieval and location of calcification.
Retrieval results of calcification with three automated methods
Retrieval results of calcification with three automated methods
We constructed a receiver operating characteristic (ROC) curve to compare the performance of our method and the K–L method. The horizontal axis of a ROC curve denotes the false positive rate (FPR), while the vertical axis represents the true positive rate (TPR). The role of calcification retrieval is to classify the pixels in an IVUS image into two categories: calcified (positive) and non-calcified (negative). TPR, also defined as sensitivity, refers to the ratio of correctly classified pixels based on the automated method for calcification to the total pixels correctly classified by the golden standard. On the other hand, FPR, which is equivalent to (1-specificity), defines non-calcified pixels incorrectly detected as calcified ones among all the non-calcifications. As illustrated in Fig. 6, the area under the ROC curve is 0.906 for the proposed method and 0.863 for the K–L method, suggesting that our method performs better.

ROC curves: in red solid line, the proposed method; in green dashed line, the K–L method.
Our method was also applied to in vivo IVUS gray-scale images acquired with a commercially available 2.9F 64-element 20 MHz phased-array IVUS catheter (Eagle Eye, Volcano Therapeutics, Rancho Cordova, CA, USA), and our results were compared with corresponding VH-IVUS images for further validation. Through color-coded VH-IVUS maps, atheromatous tissues were classified into four categories and color coded as green (fibrotic, FT), yellow–green (fibro-fatty, FF), white (dense calcium, DC), or red (necrotic core, NC) [37].
Our experimental data sets consist of IVUS image sequences acquired from five patients. Frames that include calcification were retrieved from the sequential gray-scale images, and the calcified regions were labeled with our method. Characterized images were then validated by their corresponding VH-IVUS images. Figure 7 shows an application of our method in two IVUS frames. The calcified plaques were clearly detected similarly by VH-IVUS and by our method. The correlation coefficient between the calcification detected by our method and the calcified plaques detected by VH-IVUS is 0.661, with

Two cross-sectional IVUS images and corresponding VH-IVUS frames characterizing a calcified plaque.
The size of detected calcified regions depends on N. A large N may result in some small calcified regions to be neglected. We experimentally chose N as 6 according to experimental results with a large amount of in vivo images. This number means that the small calcified points whose width in an IVUS polar view is smaller than 6 pixels cannot be detected with our method.
Conclusion
One of contribution of this study is to provide a simple method for coarse-to-fine retrieval and location of calcification from routinely acquired IVUS gray-scale image sequences, which requires no manual labeling. The calcium detected by our method correlated well with corresponding tissue type by VH-IVUS, one of the widely accepted RF-based tissue characterization techniques. The complexity of our method is lower than those methods based on image texture analysis because vessel wall segmentation and textural feature extraction and classification are not required.
However, our method cannot distinguish calcification and dense fibrosis because their echo features are identical in routine IVUS gray-scale images. Very dense fibrotic tissues may even block ultrasound wave transmission completely and are mistakenly labeled as calcification. In addition, in the current research, we cannot intelligently select the value of N, the successive column number, in fine retrieval according to the size of the calcified regions. Therefore, more attention will be paid to the error rate of false-negative judgments through more experiments with in vivo data.
Although we evaluated in vivo calcium identification according to our method against VH-IVUS, direct comparison between our method and histology was not performed in this study. Therefore, whether or not calcification retrieval with our method correlates well with histological findings is inconclusive. Judgment on the proposed method against a ground truth obtained by histology will be another future work that must be focused on.
Footnotes
Acknowledgements
This work was supported by National Nature Science Foundations of China under Grant no. 61372042, the Fundamental Research Funds for the Central Universities under Grant no. 2014ZD31, and Key Laboratory of Opto-Electronic Information Technology, Ministry of Education (Tianjin University), Tianjin, 300072, P.R. China.
Conflict of interest
The authors have no conflict of interest to report.