
Abstract
Background:
P. aeruginosa considered as a notoriously difficult organism to be controlled by antibiotics or disinfectants. The potential use of alternative means as an aid to avoid the wide use of antibiotics against bacteria pathogen has been recently arisen remarkably.
Objective:
Effect of extremely low frequency positive electric pulse with different duty cycles on Pseudomonas aeruginosa (ATCC: 27853) growth by constructed and implemented exposure device was investigated in this study.
Methods:
The exposure device was applied to give extremely low frequency in the range of 0.1 up to 20 Hz with the capability to control the duty cycle of each pulse with variation from 10% up to 100%. Growth curves of Pseudomonas aeruginosa were investigated before and after exposure to different frequencies (0.1, 0.2, 0.3, 0.4, 0.5, 0.6, 0.7, 0.8, 0.9 Hz) through measuring the optical density and cell count. Exposures to selected frequencies in the whole ranges of duty cycles were done. These studies were followed by DNA fragmentation, transmission electron microscope (TEM), antibiotic susceptibility tests, and dielectric measurements.
Results:
Findings revealed inhibition effect by 48.56% and 47.4% together with change in the DNA structural properties for samples exposed to 0.5 Hz and 0.7 Hz respectively. Moreover the data indicated important role of duty cycle on the inhibition mechanism.
Conclusion:
It is concluded that there are two different mechanisms of interaction between positive electric pulse and microorganism occurred; 0.5 Hz caused rupture in cell wall while 0.7 Hz caused denaturation of the inner consistent of the cell.
Introduction
The principle that electric fields can provoke biological effects has been known since the middle of the 19th century. Currently, the biological possessions of extremely low-frequency electromagnetic field (ELF EMF) have attracted attention of many researchers to not only establish the basic mechanisms of its interaction to living systems but also its potential of practical applications [1]. Considerable efforts have been made through the potential use of physical means as an aid and/or alternative to antibiotics in the battle against bacterial pathogens such as: photodynamic therapy [2], ultrasound wave therapy [3], thermotherapy [4], and weak electric currents [5]. These techniques were all tested as treatment modalities against pathogenic microorganisms. In addition it has been found that low-intensity alternating electric fields of high frequencies (antimicrobial fields) have an in vitro inhibitory effect on the growth of pathogenic bacteria, including Staphylococcus aureus and Pseudomonas aeruginosa [6]. Many efforts in the last few years were devoted to control cellular activities by using electromagnetic waves of frequencies which resonate with bioelectric signals generated during a particular metabolic activity. These trials succeeded to control the growth of Ehrlich tumors in mice [7–10], death of cancer cells [11], fungi [12,13] and bacterial cells [14,15].
Pseudomonas aeruginosa is a major cause of health-care associated infections, including pneumonia and infections involving the urinary tract, wounds, burns, and the bloodstream [16]. P. aeruginosa employs a broad arsenal of virulence determinants to establish infections [17]. Recent study found out the inhibiting frequency of ELF-EM waves that depreciated Salmonela Typhi growth [18].
Much work in this area dealt with orientation, flux density, frequency, wave form (AC, DC, or pulse) of EMF, and the influence of pulse duty on biological systems [19]. The definition of pulse duty is the percentage of the time during which the voltage is switched on in one cycle [20].
In view of these considerations, the objective of the present study is to stimulate and control the cellular functions (inhibition/enhancement) by means of extremely low frequency electromagnetic field through a new device using microcontroller technology to generate extremely low frequency electric field with variation in the duty cycle of each signal that lead to the discovery of inhibitory frequency with bio-signals during cell metabolism and the effect of duty cycle in each resonance frequency.
Materials and methods
Micro-organism growth conditions
Reference strain of P. aeruginosa (Ref 0353P, ATCC 27853, LOT 353604, OXOID) was used in all investigations done through the whole study. Preparation of broth subculture was done by inoculating a test tube containing 5 ml of sterile nutrient broth of pH 7.4 ± 0.2 (Lab M Limited, UK) with two colonies of bacteria from nutrient agar plate, the bacteria was then incubated (plue pard incubator, model PH050A, Italy) at 37°C for 24 h. The bacterial cell concentration was adjusted to 0.5 McFarland standard [21], 20 µl of the standardized bacterial suspension (1.5 × 10⁸ cfu/ml) was dispensed into tubes containing 1.5 ml broth media. Negative control tube contained only 1.5 ml broth medium without organism to act as blank sample. Positive control contains 1.5 ml broth media inoculated with the organism, similar to that number of test tubes were prepared to be exposed to different frequencies, each experiment was carried out in triplicates and the average was considered. Each culture tube was incubated in shaking incubator at 37°C for 24 h. Growth curves of bacterial cell cultures were attained through repeated measurements of optical density (OD) taken at 560 nm each hour by spectrophotometer (humalyzer junior manufactured for Human GmbH ser.# 72333, E.E.A).
Heterotrophic plate count detection
Heterotrophic plate count was done in parallel to OD measurements each hour up to 24 hours to detect number of viable bacterial cell count by using the Heterotrophic plate count standard protocol and reported as colony forming units (CFU/ml) [22].
Experimental setup
It was important to construct an experimental setup, suitable for the exposure protocol. This was done in the faculty of Science Cairo University research lab, to produce extremely low frequency electric field in the range from 0.1 to 20 Hz with intervals of 0.1 Hz. In addition to that, variation in the duty cycle for each frequency is provided in the range of 10% up to 100% by increasing 10% each time as shown in Fig. 1. The design was mainly based on the new technology of using microcontroller; it was programmed to control high voltage power supply circuit (manufactured by Venus Scientific INC, N.Y., USA) that can produce direct current (DC) signal up to 1500 V (maximum output voltage) when applying 12 V as input source. In this study minimum input voltage that equals to 1.5 V was used to produce 187.5 V. This signal was conducted through two parallel copper electrodes (20 × 20 cm2) separated by 50 cm where the samples in glass cuvettes are centered between them during exposure time as shown in Fig. 2. A pilot study was done to investigate frequency effect (inhibition/enhancement) by preparing cultured broth medium with standardized bacterial suspension to be incubated at 37°C and observing bacterial growth through OD readings which were measured every hour, exposure time with different frequencies starts after the first hour of log phase in the bacterial growth curve for complete 1 hour, then OD readings continue to be taken every hour until the bacteria enters the stationary phase. Another pilot study followed the investigation of frequency effect which is to find out the impact of duty cycle factor on the bacterial growth in each frequency.

Sketch diagram for different duty cycles at constant frequency.
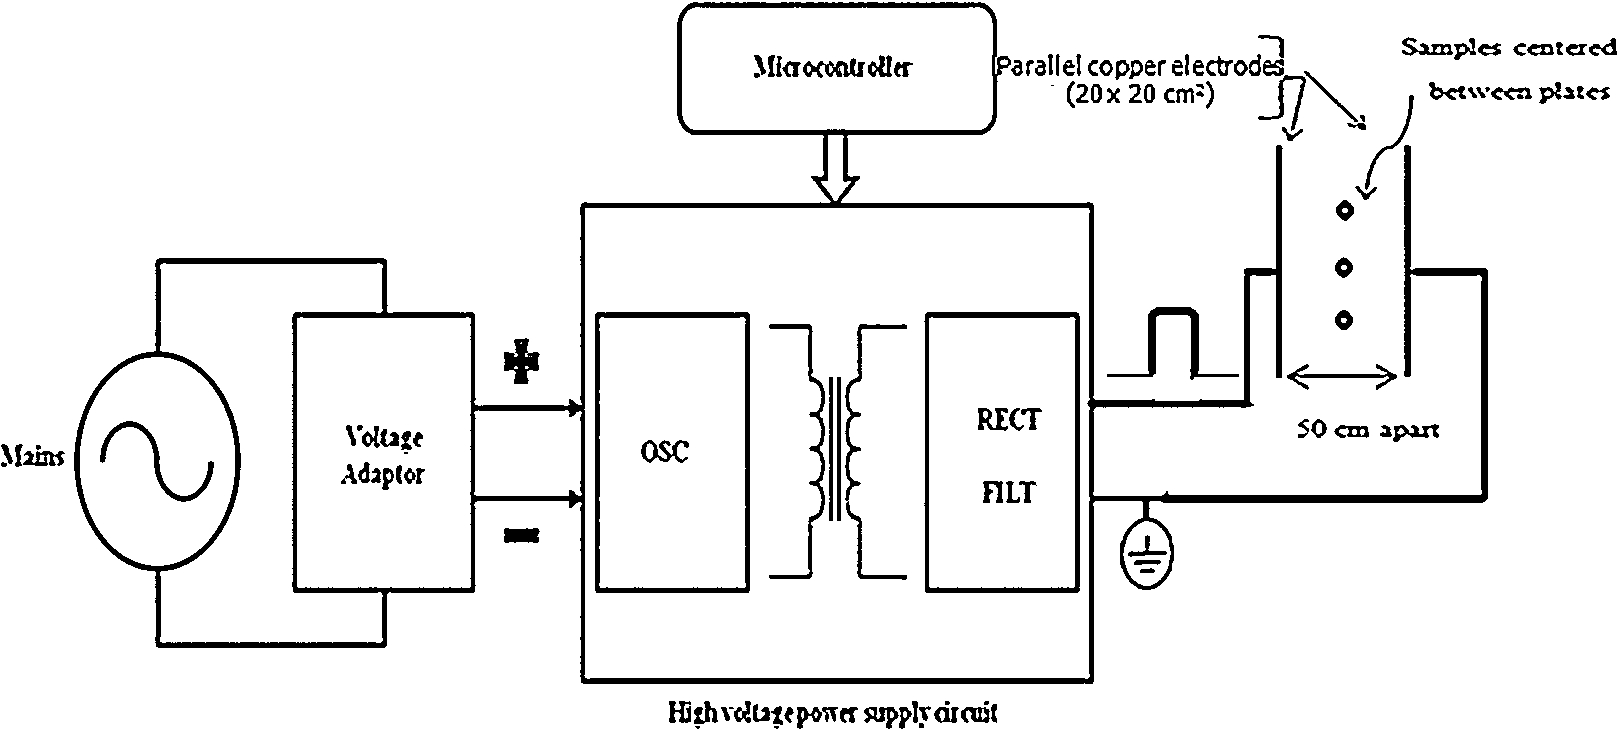
Block diagram for the exposure device.
Agarose gel electrophoresis is the easiest and commonest way of separating, identifying and analyzing DNA fragments using an agarose concentration appropriate for the size of the DNA fragments to be separated [23]. In this study DNA was isolated from bacterial cells, quantified, and subjected to electrophoresis on a 1.5% agarose gel containing 1 µg of ethidium bromide (EtBr) per ml. Wide bare pipette tips were used to avoid shearing of the DNA, tips were autoclaved to avoid DNAse contamination. Moreover vigorous vortexing or extensive pipetting was circumvented because high molecular weight DNA might be sheared [24]. DNA was visualized under ultra violet (UV) light, and the software My Image Analysis Thermo Scientific V.1.0 was used to analyze the image obtained. Finally all experimental wastes were autoclaved to avoid infection [25].
Transmission electron microscope examination
The morphological changes of control and exposed group to inhibitory frequencies with different duty cycles (maximum and minimum inhibition effect) have been determined using TEM. In order to prepare the bacterial sample to be examined by TEM, the sample should undergo some processing according to [26]. The diagnostic cell suspension was transferred to 50 ml conical centrifuge tubes (micro-centrifuge tube), subsequently the suspension was cleared by low speed centrifugation at 4000 rpm 5–10 min at room temperature (RT), to avoid pelleting the cells too densely. The supernatant was poured off, and then pelleting and resuspension of cells with the final concentrations for the fixative in glutaraldehyde and osmium tetroxide were done, followed by dehydration in alcohol and finally embedded in an epoxy resin. Microtome sections were prepared at approximately 500–1000 µm thickness with a Leica Ultracut UCT ultramicrotome (made in Germany). Ultra thin sections were prepared at approximately 75–90 µm thickness and stained with uranyl acetate and lead citrate. This was examined in TEM lab FA-CURP, Faculty of Agriculture, Cairo University by transmission electron microscope type JEM-1400 TEM, manufactured by JEOL in Japan. Images were captured by CCD camera with 1632 × 1632 pixels format as side mount configuration manufactured, this camera uses a 1394 fire wire boared for acquisition.
Antibiotic susceptibility test
The bacterial isolate of P. aeruginosa was subjected to susceptibility testing using five different antibiotic agents namely (Imipenem (IPM), Ceftriaxone (CRO), Amikacin (AK), Tobramycin (TOB), and levolfloxacin (LEV)). The susceptibility of P. aeruginosa against these antibiotics was measured by disc diffusion method, which was carried out and performed by the procedure outlined by the National Committee for Clinical Laboratory Standards (NCCLS) [27].
P. aeruginosa standardized bacterial suspension (1.5 × 10⁸ cfu/ml) was divided into five groups (three samples per each); control and exposed to inhibitory frequencies with minimum and maximum duty cycle effect in each frequency after the first hour of log phase in the bacterial growth curve for 60 minutes. At the end of the exposure period, samples of control and exposed groups were used to be inoculated in Mueller-Hinton agar plates. The inoculated plates were incubated at 37°C for 48 hrs. The mean diameter of each inhibition zone were measured and compared to the previous zone readings.
Dielectric measurements
The dielectric measurements were carried out for the samples in the frequency range 0.1–10 MHz (beta dispersion range) using a Loss Factor Meter (type HIOKI 3532 LCR Hi TESTER, version 1.02, 1999, Japan), with a sample cell type PW 9510/60, manufactured by Philips, Japan. The sample cell is made of glass, has two squared platinum black electrodes of 0.64 cm2 area (A) and separated by 1 cm apart (d). For measurements, the cell is immersed in a glass beaker containing the bacterial sample so as the sample suspension covers the whole volume between the cell electrodes. During the measurements, the sample in glass beaker between the electrodes was kept at a constant temperature of 24 ± 0.1°C. The capacitance (C) of the samples was measured at each frequency (f) and the resistance (R) was recorded. Each run was taken three times and the average was considered.
The relative permittivity (
Statistical analysis
The statistical methods and analysis for evaluation of the results were done by calculating arithmetic means and standard deviations for antibiotic susceptibility results and dielectric measurements. All these measurements have been done for exposed and unexposed samples. The Student’s t-test done for the results revealed that there were significant differences. P values < 0.05 were considered to represent a statistically significant difference.
Results
Bacterial growth
A linear dependence of the absorbance on the micro-organism concentration was indicated by standard calibration curve with a slope
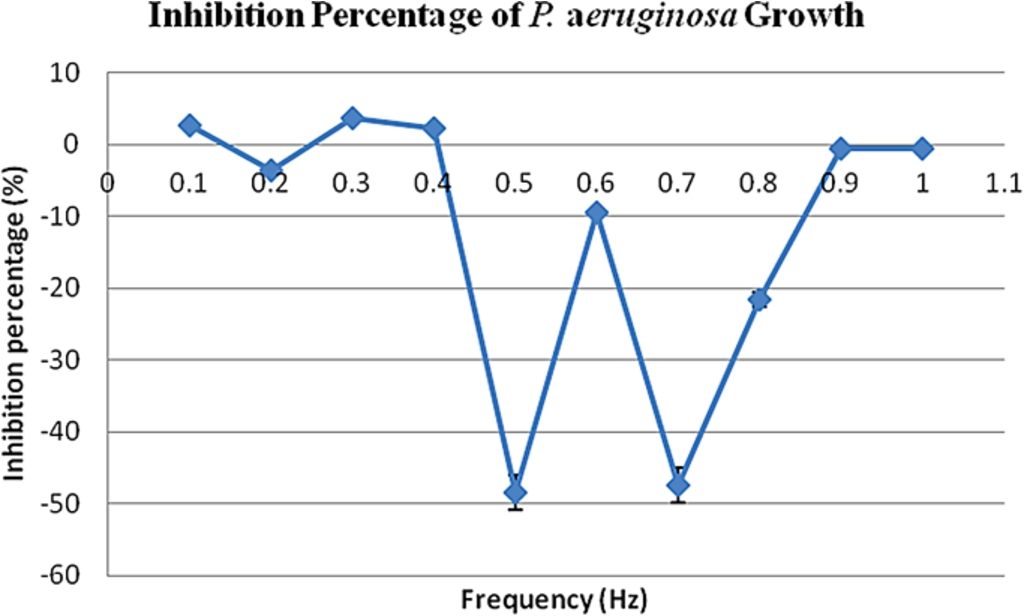
Comparison between the inhibition percentages of different frequencies in the range from 0.1 up to 1 Hz on growth of P. aeruginosa.
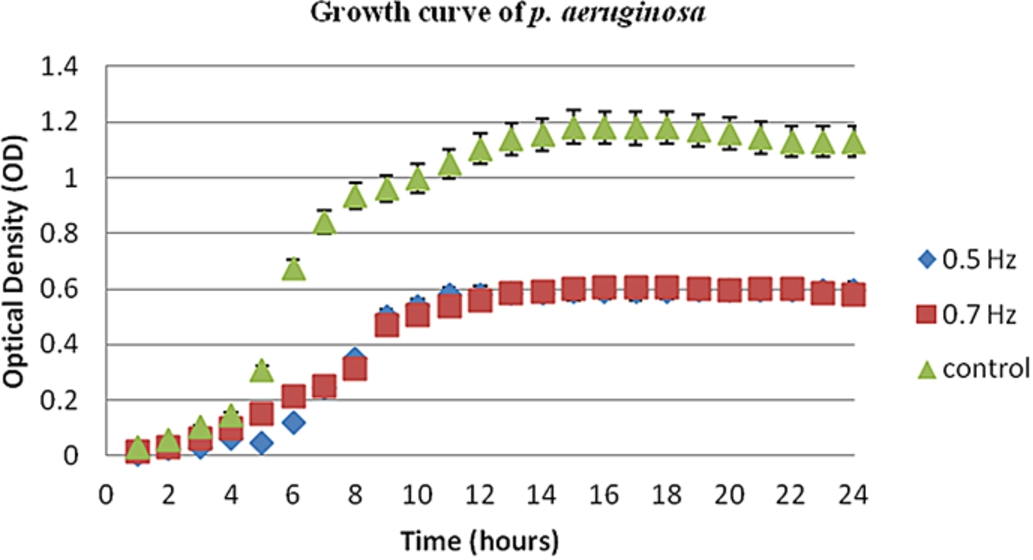
Comparison between P. aeruginosa growth curves exposed to inhibitory frequencies; 0.5 Hz (♢) and 0.7 Hz (■) with control (Δ).
The second pilot study after confirming the inhibitory frequencies was to investigate the effect of duty cycle factor in each frequency; this was done by repeating the same previously detailed procedure for both 0.5 and 0.7 Hz but with keeping the frequency constant while varying the duty cycle from 10% up to 100% by 10% intervals. A comparison done between the growth curves with different duty cycles at same frequency 0.5 Hz showed that duty cycle of 50% has the maximum inhibition effect while 80% has the minimum inhibition effect on P. aeruginosa at inhibitory frequency 0.5 Hz as shown Fig. 5.

Percentage of inhibition effect on P. aeruginosa at inhibitory frequency 0.5 Hz for different duty cycles showing that duty cycle of 50% has the maximum inhibition effect while 80% has the minimum inhibition effect on P. aeruginosa growth.

Percentage of inhibition effect on P. aeruginosa at inhibitory frequency 0.7 Hz for different duty cycles showing that duty cycle of 100% has the maximum inhibition effect while 30% has the minimum inhibition effect on P. aeruginosa growth.
The other inhibitory frequency 0.7 duty cycle factor showed its maximum inhibition effect at 100% while its minimum inhibition effect was recorded at 30% as shown in Fig. 6.
DNA of exposed samples has experienced DNA structural change compared to the control sample. Fragmentation appeared with variation among the different exposed samples where the most affected sample was Pseudomonas aeruginosa exposed to 0.5 Hz at duty cycle 50%, then sample exposed to 0.7 Hz at duty cycle 100%, then sample exposed to 0.5 Hz at duty cycle 80%, and the sample exposed to 0.7 Hz at duty cycle 30% was the least affected sample. These are considered markers for structural change in DNA as shown in Fig. 7. The analysis of the image obtained confirmed the variation of DNA fragmentation as shown in Table 1 where the purity percentage reflects the comparison between fluorescence intensities of ethidium bromide-stained DNA sample bands to the fluorescence intensities of DNA standards on agarose gels; so the higher the percentage the higher the effect on the DNA.

Agarose gel 1.5% showing DNA Fragmentation in the different samples. Where M is 100 base pair molecular size marker, lane 1 is the sample exposed to 0.7 Hz at duty cycle 30%, lane 2 is sample exposed to 0.5 Hz at duty cycle 50%, lane 3 is sample exposed to 0.5 Hz at duty cycle 80%, lane 4 is sample exposed to 0.7 Hz at duty cycle 100%, and lane 5 is the control sample.
Results of TEM images well matched the results of DNA fragmentation where control samples came clearly with typical rod shaped cells of Pseudomonas aeruginosa as shown in Fig. 8(a) and after 1 hour of exposure to 0.5 Hz at duty cycle 50% the cells showed in Fig. 8(b) complete rupture of cell wall, similar to that damage of parts in cell wall causing leakage of the internal cell contents when exposed to 0.5 Hz at duty cycle 80% as shown in Fig. 8(c). Figure 9(b) & (c) represents non homogeneity of inner-constituents of the cell with slight partial destruction in the cell wall when exposed to 0.7 Hz at duty cycle 100% and 0.7 Hz at duty cycle 30% respectively compared with Fig. 9(a) that represents the unexposed sample of P. aeruginosa.
Analysis results of DNA fragmentation
Analysis results of DNA fragmentation

TEM images at 30000× for control sample (a), samples exposed to 0.5 Hz at duty cycle 50% (b), samples exposed to 0.5 Hz at duty cycle 80% (c).
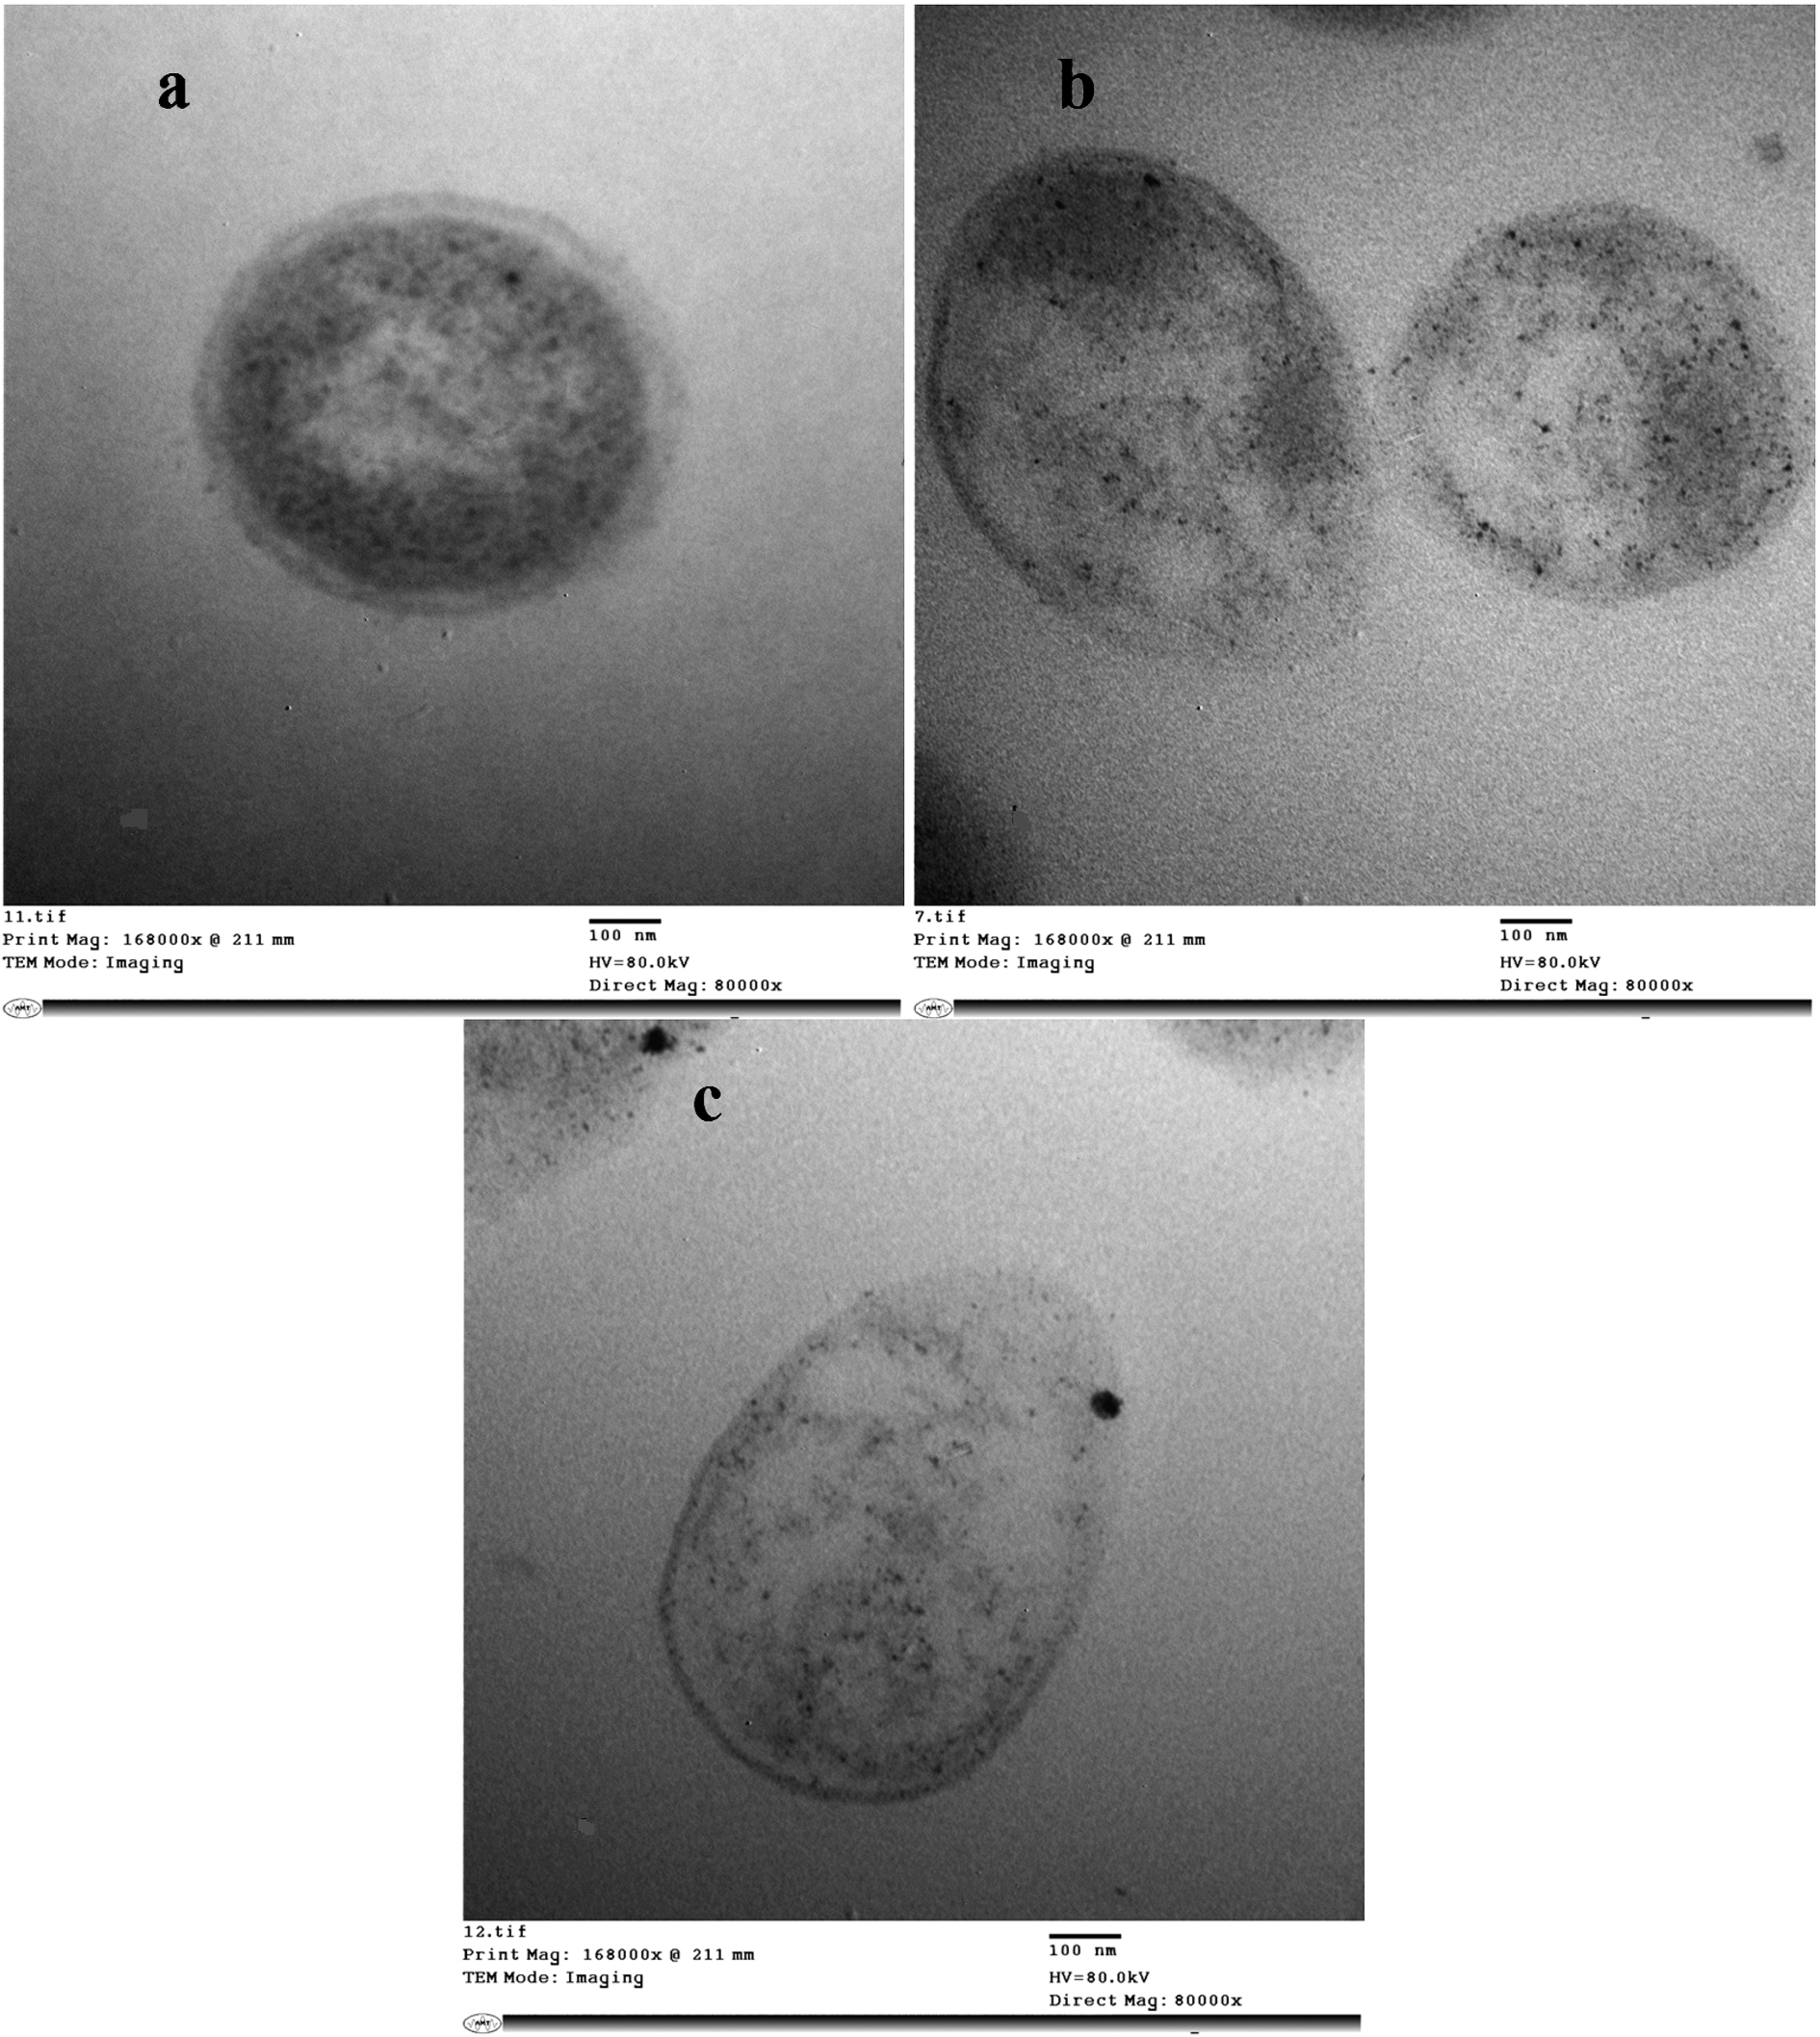
TEM images at 80000× for control sample (a), samples exposed to 0.7 Hz at duty cycle 100% (b), and samples exposed to 0.7 Hz at duty cycle 30% (c).
The antibiotic susceptibility test results for control and exposed to 0.5 and 0.7 Hz samples in minimum and maximum inhibition effect in terms of duty cycle factor are detailed in Table 2 showing a significant difference between unexposed and all exposed samples where
Dielectric measurements
Properties of molecules are affected majorly by the dielectric behavior of biological tissues, so on the molecular level useful information was provided by the interpretation of the following dielectric data, where Table 3 shows the differences of relative permittivity and conductivity between control and exposed microorganism at inhibitory frequency of 0.5 Hz, and 0.7 Hz.
The mean inhibition zone diameter (mm) of different antibiotic agents for the control and exposed Pseudomonas aeruginosa strain
The mean inhibition zone diameter (mm) of different antibiotic agents for the control and exposed Pseudomonas aeruginosa strain
Dielectric parameters for Pseudomonas aeruginosa exposed to 0.5 and 0.7 Hz as compared with the control
The main objective of this study is to investigate the frequency that affects the growth of Pseudomonas aeruginosa with the constructed device and reveal the impact of the duty cycle factor. The microcontroller technology used enabled the detection of the inhibitory frequencies at 0.5 and 0.7 Hz, and ensured that duty cycle has an effect on the growth of the microorganism where in the same frequency there was minimum and maximum inhibitory effect at 50% and 80% respectively for 0.5 Hz. 100% and 30% were recorded for 0.7 as the minimum and maximum effect respectively.
The results of these inhibitory frequencies may cause changes in the microorganism molecular structure at the log phase that leads to affect its cellular division, as the growth curves of the exposed Pseudomonas aeruginosa differ from the control sample starting from the log phase Fig. 4. During the log phase population is most uniform in terms of chemical and physical properties [28]. The physical requirements for growth are temperature, pH, and osmotic pressure, where the chemicals required for all structures are carbon, oxygen, and hydrogen. Nitrogen is required for making bacterial amino acids and nucleic acids, while sulfur is required for making some bacterial amino acids; on the other hand phosphorus is required for making bacterial nucleic acids, membrane phospholipid bilayer, and ATP. Functioning of certain bacterial enzymes demands potassium, magnesium, and calcium, finally bacterial metabolism depends on iron [29–33]. From the previous facts it may be concluded that permittivity of cell membrane changed leading to changes in inner constituents of cell, since the changes happened in the log phase stage.
Resolving duty cycle factor results were built on the fact that cell membrane permittivity may be changed due to exposure by the inhibitory frequencies at different duty cycles. It inhibited the growth of Pseudomonas aeruginosa in each inhibitory frequency (0.5 and 0.7 Hz) as on one hand it gave maximum inhibition effect at 50% and minimum inhibition effect at 80% for 0.5 Hz and on the other hand the bacteria was influenced at different duty cycles for 0.7 Hz since 100% indicated maximum inhibition effect and 30% recorded minimum inhibition effect Figs 5 and 6. These results are well-matched with [19] findings where they found that the influence of pulsed EMF on PC12 cells in vitro is strongly dependent on pulse duty, as low (10%) pulse on-time significantly inhibited the percentage of neurite bearing cells, but at the same time increased the average length of neurites, while 100% on-time (DC) had exactly the opposite effects. Also Ward [34] indicated that duty cycle is an effective factor in maximal electrically induced torque (MEIT) of the wrist extensors where duty cycle of 20% or less considered greatest MEIT on the contrary of the commonly used clinically duty cycle 50% from the point of view of maximum muscle force production.
Costerton [35] have shown that the efficacy of biocides and antimicrobial agents in the killing of bacteria can be enhanced if these agents are used within a low-intensity electric field. The susceptibility increase against protein synthesis inhibitors may be related to changes on bacterial uptake process of aminoglycoside which are cationic molecules that bind to anionic components of the bacterial cell membrane in a reversible and concentration-dependent manner [36]. Also the susceptibility increase of the microorganism to cell wall synthesis inhibitors after exposure may be due to the pulsed electric field effect on mucopeptide synthesis in the bacterial cell wall. It could also be related to pH modifications, the production and transportation of antimicrobial agents into the biofilm by an electrophoretic process, the genesis of additional biocide ions, or hyperoxygenation [37–39].
A distinctive feature of apoptosis at the biochemical level is DNA fragmentation. This method was used as a semi-quantitative method for measuring apoptosis [40]. Apoptosis is a form of programmed cell death characterized by cytoplasmic condensation, plasma membrane blebbing and nuclear pycnosis, leading to nuclear DNA breakdown into multiples of ∼200 bp oligonucleosomal size fragments [41]. In the present study DNA damage of Pseudomonas aeruginosa exposed to inhibitory frequencies at 0.5 Hz and 0.7 Hz at maximum and minimum duty cycle effect was estimated through electrophoretic analysis in agarose gels. DNA structural changes were detected in all exposed microorganisms as shown in Fig. 7. These results were in agreement with Enzmann [42] who considered the presence of fragmented DNA as an evidence of damage in genetic material. Teow [43] reported that ions interact with DNA and RNA under in vitro conditions without causing a significant DNA change in its structure conformation. These leads to the result that DNA was damaged due to exposure by extremely low frequency produced by the exposure device implemented through this study.
Edwin [44] concluded that the resistance of the bacterial membrane is too high to explain the effective conductivities of microorganisms. This supports the conclusion that the low-frequency conductivities of bacteria are determined by the properties of their cell walls. Since the mobile ion concentration is as great in the wall as it is in the cytoplasm, it is possible to rule out leakage as an important contribution to the population of ions in the wall and thus support the postulate that cell wall conductivity is directly related to the concentration of fixed charge in this region. (These can support the present findings of antibiotic sensitivity test.)
There are several parameters involved to effect the cellular division of the microorganism such as its cellular membrane packing properties and structure, synthesis, intracellular constituents and DNA. Changes in permeability or in structure of cellular membrane may lead to the loss of the inter-constituents of the cell and/or the permeation of extracellular components to come inside the cell [45]. There is a decrease in the average values of the dielectric increment (
Since dielectric measurements were done for the whole alive microbial cells, and the dielectric dispersion in the measured region (100 KHz up to 10 MHz) is mainly due to protein molecules which have to be for free molecular motions, the measured changes in
By relating results obtained from the different examination tests (DNA fragmentation, TEM, antibiotic susceptibility tests, and dielectrics measurements) that investigated the effect of inhibitory frequencies 0.5 Hz & 0.7 Hz and the impact of duty cycle on Pseudomonas aeruginosa, it is clearly obvious that the increase in conductivity for exposed samples indicated by dielectrics measurement may be due to fragmentation of the DNA and rupture of cell wall. This conclusion is served by DNA fragmentation results where DNA damage appeared in the exposed samples, which may indicate interaction with DNA of microorganism changing its DNA properties. Antibiotic susceptibility test concerned with inhibitors of cell wall synthesis showed highly significant difference in diameter zone confirming the effect of inhibitory frequencies on cell wall, and finally all these speculations are confirmed by TEM images that revealed visibly the cell wall rupture and DNA structural changes at 0.5 Hz and 0.7 Hz respectively.
Conflict of interest
We certify that there is no conflict of interest with any financial organization regarding the material discussed in the manuscript.