
Abstract
The effect of myocardial infarction on the global functioning of the heart is well known. Less is understood regarding the effect of LV fibrotic infarction on the cardiac mechanics of the septal wall. To determine this unknown, the stress and strain of septal wall on the healthy and infarcted rat heart model is measured by using finite element models of rat heart geometries. The main objective of this study was to utilized computational methods to study the effect of LV free wall fibrotic infarction on the healthy septal wall. Three-dimensional biventricular rat heart geometries were developed from cardiac magnetic resonance images of a healthy heart and a heart with left ventricular (LV) fibrotic infarction after infarct induction. From these geometries, FE models were established. Three-dimensional biventricular rat heart geometries developed from cardiac magnetic resonance images were used in creating FE models of healthy and infarcted rat hearts. The average radial strain percentage change of the healthy septal wall on the epicardium, mid-wall and endocardium was 61%, 52% and 14% higher than the infarcted septal wall, respectively. It was concluded that the fibrotic infarction has a potential cause the malfunction of the heart due to high myocardial stress and strain that the septal wall experiences
Keywords
Introduction
A standout amongst the most well-known histological components of the failing heart is myocardial fibrosis. Substitution fibrosis, frequently introduce in the terminal phases of heart failure, has been accounted for in histopathological examination studies [1,2]. The pathophysiological instruments that prompt this fibrosis are different, with some being intense, as in myocardial infarction [3], and others being advanced and possibly reversible, as in hypertensive cardiomyopathy [4]. Myocardial fibrosis in creature and patient studies is connected with compounding ventricular systolic capacity, unusual heart remodelling, and amplified ventricular stiffness [5–8]. In recent clinical studies, fibrosis has also been shown to be a major independent predictive factor of adverse cardiac outcome [9–12].
It is generally understood that the fibrotic infarction on the heart influences the overall functioning of the heart [13–15]. Fibrotic infarction on the LV free wall impacts on the overall functioning of the heart. Understanding the ventricular communication of the heart is imperative in cardiac mechanics. The overall cardiac mechanics of the healthy heart maybe influenced by the myocardial infarction [16]. The ventricular septum of the heart is the separating wall between the right and left ventricles of the heart. That partition of the septum that isolates the two upper chambers (the right and left atria) of the heart is named the atrial (or interatrial) septum while the wall of the septum that lies between the two lower chambers (the right and left ventricles) of the heart is known as the ventricular (or interventricular) septum.
This study focuses on the study of mechanics of ventricular septum with fibrotic infarction in the LV free wall. To compare the results, the cardiac mechanics of healthy LV free wall with healthy ventricular septum is compared with fibrotic infarction of LV free wall in healthy ventricular septum. Late reports have exhibited the benefits of utilizing finite element for the noninvasive demonstrating of heart failure in patients [16–18]. The field of computational modelling is quickly advancing with proceeding with innovative advance and the late improvement of utilizations that have assist upgraded its ability to contemplate the behaviour myocardial tissue [19–22]. This advancement has led to the understanding of various disease mechanisms in the area of soft tissue behaviour [23–26]. To achieve the goal of this research, three-dimensional biventricular rat heart geometries were developed from cardiac magnetic resonance images of a healthy heart and a heart with left ventricular (LV) fibrotic infarction after infarct induction. From these geometries, FE models were established. To represent the myocardium, a structure-based constitutive model and a rule-based myofibre distribution were developed to simulate both passive mechanics and active contraction.
One of the important goals of cardiac mechanics research is to gain an understanding of tissue properties and how changes in tissue structure and properties affect the pumping function of the heart. The integration of structural constitutive laws, specimen-specific geometry and physiological boundary conditions can be achieved by computational modelling [27]. Magnetic resonance imaging (MRI) measured in-vivo data of the heart can be used to reconstruct the 3D models of healthy and infarcted hearts. Understanding of the regional mechanics of the heart plays an important role in understanding and improving the heart function after myocardial infarction. Once the understanding is achieved several therapies can be pursued.
Myocardial infarction (MI) is caused by blocking of blood and oxygen in the arteries. This condition is normally known as heart attack (HA). It is a result of damaged tissue of the heart wall due to decreased blood flow. The MI is caused by the blockage of blood by blood clot that obstructs an artery. MI has four main phases, namely: 1) acute ischemia, 2) necrosis, 3) fibrosis and 4) remodelling. The fibrosis phase happens between one and three-week in the rat. During this period the mechanical properties of the infarcted region decouple from collagen content. It is reported that, while collagen may continue to increase, the stiffness of the infarct is observed to decrease. The effect of the remodelling phase can be seen at both the microscopic and global levels. At the global level, the scar tissue is seen to begin shrinking. The shrinkage is a result of decoupling of collagen content and will also result in the reduction of volume of the ventricle. The present study was undertaken to determine the effect that the fibrotic infarction of the LV free wall has on the healthy ventricular septum.
Materials and methods
Acquisition and processing of MRI data
In this study the scans obtained were performed on a MAGNETOM Allegra 3T MRI scanner (Siemens, Erlangen, Germany) at the University of Cape Town, Cape Town, South Africa. This scanner is mainly for brain scanning; hence it has a small bore diameter. The scanner has maximum gradient of strength of 40 mT m−1 and a slew rate of 400 mT m−1. In order to scan small animals like rate, the small polarized circular coil of inner diameter of 70 mm was used to receive and transmit the signal [28]. The GE sequence (fast low angle shot (FLASH)) was used to obtain cine cardiac images for functional and structural assessment of rat heart as shown in Fig. 1.
The rat heart was divided into 10 slices with a thickness of 1 mm. the imaging parameters used in this study were matrix size = 256 × 256, TR = 6.30–7.60 ms, TE = 2.89–3.46 ms and signal averages 1–3 depending on the noise level. The cardiac images were captured by first taking long axis images and then used long axis image to capture short axis images of 1 mm slices [28].
Geometrical reconstruction of rat heart
The MRI data was processed by Segment (

Segmented short axis slices on Segment ©. Long-axis MR image of the rat heart and Short-axis segmented MR image at the mid-ventricle (between the base and the apex); This figure shows the MRI snapshot of the healthy rat heart.
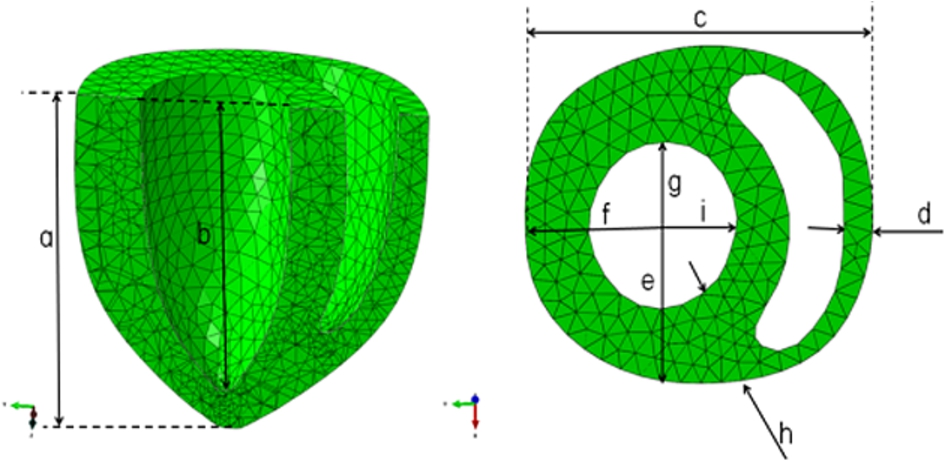
Reconstructed ventricular geometry of the healthy rat heart. This figure illustrates the elements used in the analysis. The elements were created in Abaqus 6.12 (research/academic version). The overall dimensions of the model are also shown, and are labelled (a) to (i). The thickness of the left and right ventricles is also given.
Biventricular FE models were created for the healthy rat heart (baseline) using the animal-specific surface geometries from MRI data and the mesh were generated using Abaqus® FEA (D S Simulia. ©Dassault Systemes, Providence, USA, 2007). The ventricular walls of each model were meshed with approximately 8510 10-node tetrahedral quadratic elements as shown in Fig. 2. Values of material parameters used in this model are shown in Table 1. The transmural mesh density was adjusted until the ventricular volume changed by 5% for a given load. It was found that three elements are sufficient for accurate ventricular volume calculations and computational efficiency [29]. The basic construction of the mesh involved a continuous ring (three elements wide) of elements around the perimeter of both ventricular chambers, which was tangent to the epicardium of the heart. Then, the three layers of elements were generated to represent the septum. The myofibre angles were assigned to each element using a custom inhouse ORIENT Abaqus© subroutine. This fibre distribution was used throughout the entire LV, including the septum, and RV free wall. The endocardium of each ventricle was lined with shell elements in order to create an airbag for computing the cavity volume.
Healthy rat heart main dimensions. This table shows the material parameters of the healthy rat heart geometry that were used in simulating the passive filling of the rat heart. The measurements are in millimeters
Healthy rat heart main dimensions. This table shows the material parameters of the healthy rat heart geometry that were used in simulating the passive filling of the rat heart. The measurements are in millimeters
The boundary conditions were applied such that the real conditions are mimicked. At the basal position, the nodes were constrained in both the circumferential and longitudinal directions. The displacements in the radial direction were left free to move. In simulating the passive filling of the healthy condition of the rat heart, the inner walls of the LV and RV the pressures of 4.8 kPa and 0.0098 kPa were applied respectively.
Material properties of the heart
Nearly incompressible, transversely isotropic, hyperelastic constitutive laws for passive myocardium [30] were modelled with a user-defined material subroutine in the explicit FE solver, Abaqus® FEA (D S Simulia. ©Dassault Systemes, Providence, USA, 2007). Passive material properties were represented by the strain energy function [30]. Material parameters of the proposed function are shown in Table 2.
Values for the material constants bf, bt and bfs were chosen as 9.2, 3.0 and 3.7, respectively, based on the previous studies of canine myocardium [30]. In order to validate the models, the material constant C was adjusted until the LV and RV ED volumes matched the experimentally measured values. It should be noted that the myocardial material properties [31] have been used in previous biventricular FE simulations of the canine heart [32].
Stress scaling coefficients for healthy and infarcted (fibrotic–two-week after infarction) rat heart models. In this model, the stress scalling factor were changed and validated by utilising the chamber volume at end-systolic and end-diastolic
Average radial stain, circumferential strain and longitudinal strain in the free wall and septal wall. The healthy septal wall was compred with the infarcted septal wall. In this case the infarcted septal wall mneans that the septal wall is in the model that has the infarcted LV free wall. Similarly, the healthy septal wall means that it is situated in the healthy LV free wall
Average radial stress, circumferential stress and longitudinal stress in the free wall and septal wall. The healthy septal wall was compred with the infarcted septal wall. In this case the infarcted septal wall mneans that the septal wall is in the model that has the infarcted LV free wall. Similarly, the healthy septal wall means that it is situated in the healthy LV free wall
Ventricular remodelling and tissue healing after myocardial infarction are dynamic and simultaneous processes [33]. With the aim of providing a basis to systematic development of MI therapies based on the understanding of the mechanical mechanisms involved, Holmes and colleagues presented a description of the mechanics of healing myocardial infarcts [34] and distinguished four stages of myocardial infarction:
Acute ischemia (first minutes to hours after infarction),
Necrotic phase (hours to 1 week after infarction),
Fibrotic phase (1 week to 2–4 weeks after infarction), and
Remodelling phase (2–4 weeks to 4–8 days after infarction).
This research work concentrates on the fibrotic phase which may occur between one week and 3 weeks after myocardial infarction.
End-diastolic strain along intramural paths in the left ventricle
The mechanical performance of the rodent heart has been of enthusiasm throughout the years to numerous researchers who have concentrated on both the complete heart in vivo and the secluded heart muscle preparation. In spite of the fact that studies done in vivo may all the more firmly estimated the circumstance in clinical circumstance, it is frequently troublesome in these examinations to control sufficiently all exploratory factors. A more inflexible control of these factors can be achieved when utilizing the finite element modelling.
Three-dimensional biventricular rat heart geometries developed from cardiac magnetic resonance images were used in creating FE models of healthy and infarcted rat hearts. The average radial strain percentage change of the healthy septal wall on the epicardium, mid-wall and endocardium is 61%, 52% and 14% higher than the infarcted septal wall, respectively. Similarly, the average circumferential strain percentage change of the healthy septal wall on the epicardium, mid-wall and endocardium is 67%, 47% and 20% higher than the infarcted septal wall, respectively. Moreover, the average longitudinal strain percentage change of the healthy septal wall on the epicardium, mid-wall and endocardium is 85%, 59% and 28% higher than the infarcted septal wall, respectively (See Fig. 7).
To capture the mechanical behaviour of the myocardium, the strain and stress were obtained by looking at various paths from the epicardium to the endocardium (see Fig. 3). This is attributed to the boundary conditions applied in the model. In addition, paths labelled E and F have the highest radial strain of −0.35. This is because the wall in this region is free to move and it is not restricted as compared to other walls, like the wall between the LV and RV. On the other side, the wall between the RV and LV is restricted because the pressure of 3.8 kPa and 1.2 kPa is applied on wall cavity. To note here is that both the strains and stresses in radial direction are negative and this simply means that the wall might be in compression. The radial strains increase from the epicardium to the endocardium. Similar to the radial stresses, the radial strains show that the myocardium is in radial compression. The radial strain at the infarcted regions is shown to be lower than in the healthy regions.
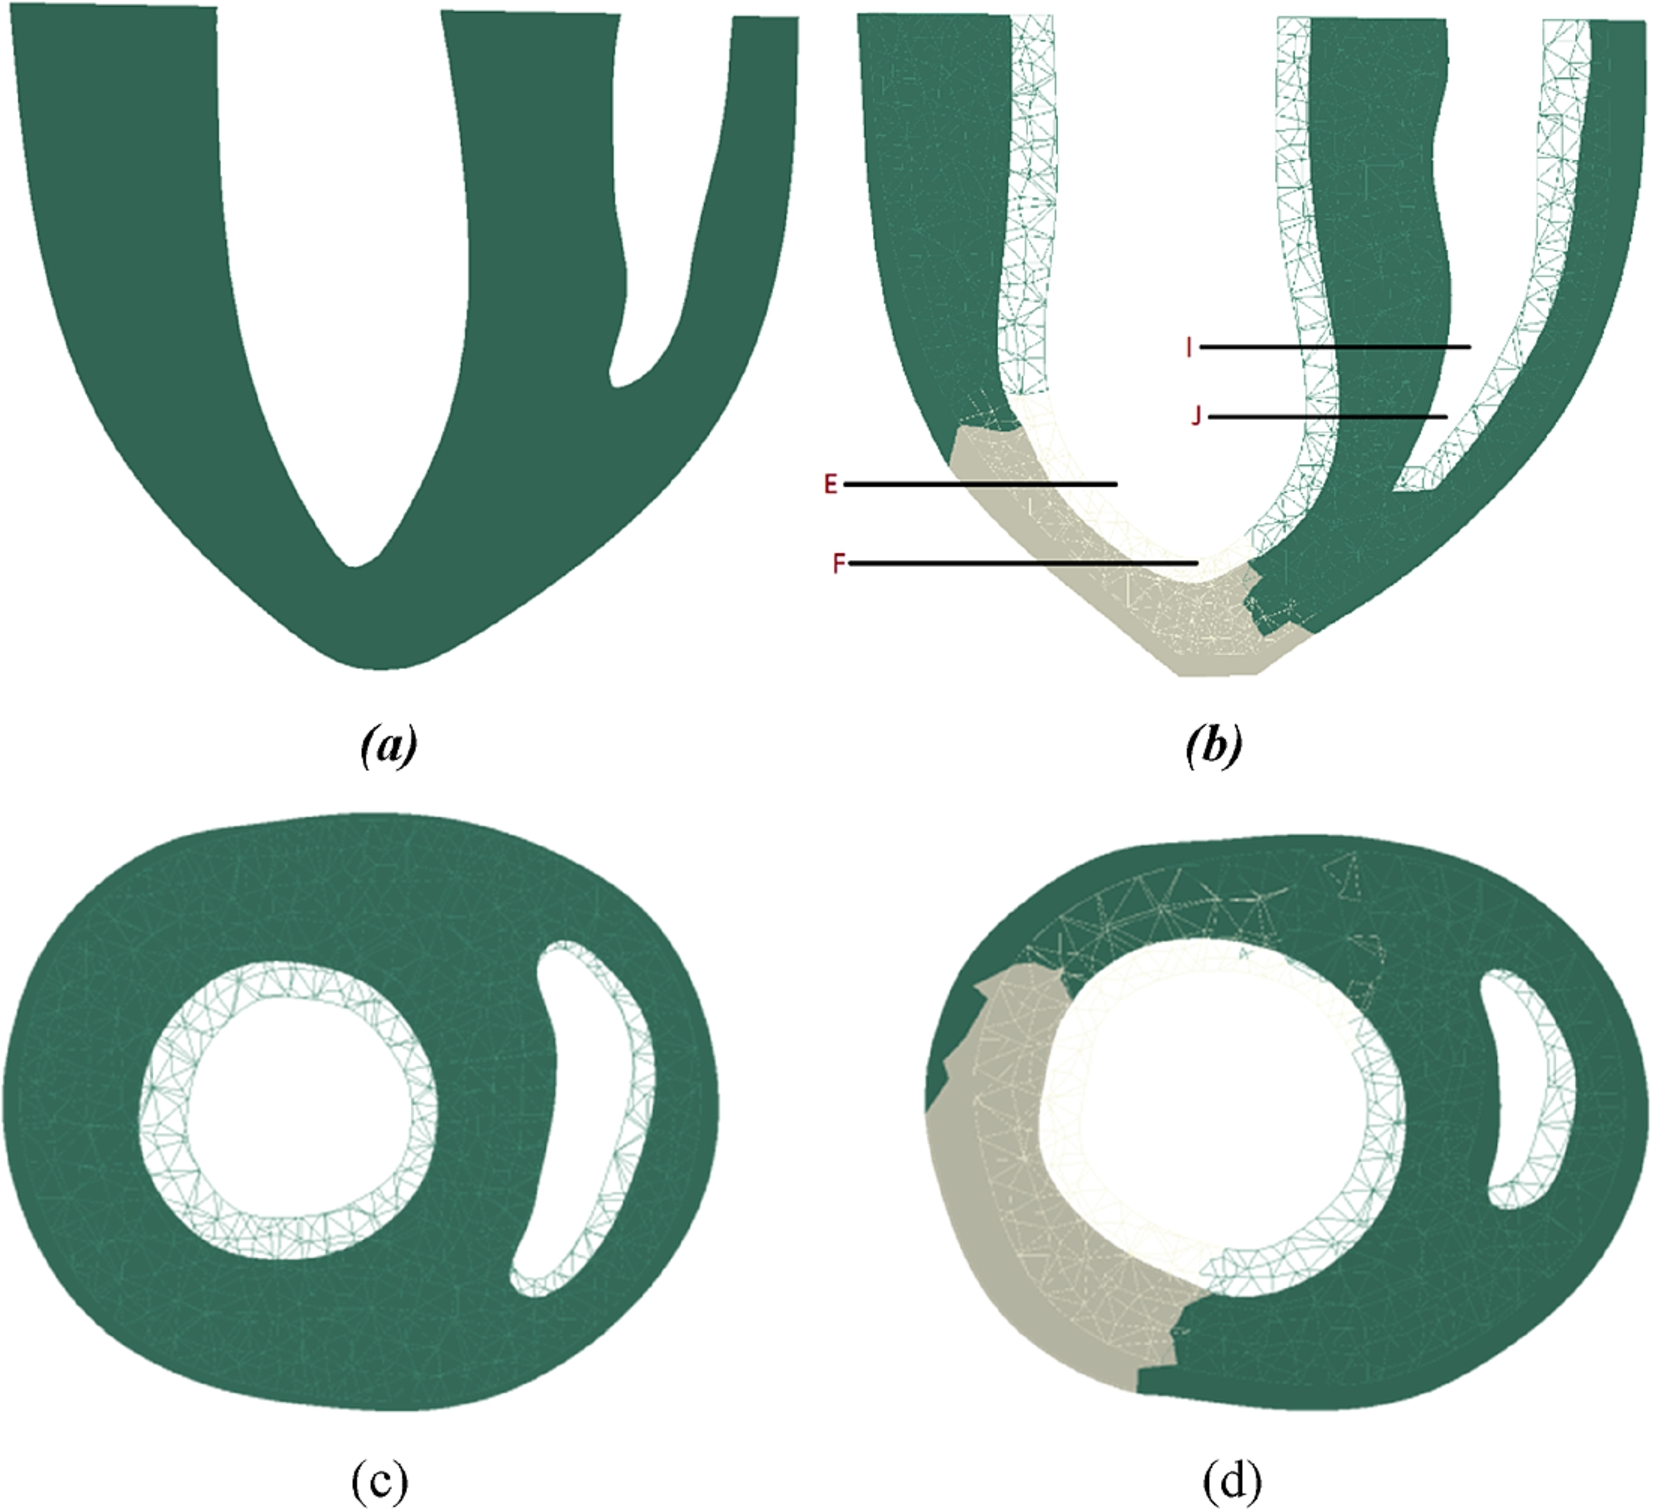
Location of paths in the healthy rat heart model. This figure illustrates the position considered when processing the stress and strain results of both the healthy and overloaded models. (a) Long-axis paths E and F on LV free wall, (b) Long axis I and J on inter-ventricular septum, (c) Short-axis showing the healthy rat heart moidel and (d) Short-axis model showing the fibrotic infarction in the rat heart model.
As shown in Fig. 4(b), the circumferential strains vary from the epicardial wall to the endocardial wall. The values increase exponentially from the epicardium to the endocardium. The values of circumferential strains are positive, indicating that the wall in this direction is under tension. Again, the paths E and F move more than the other regions. The circumferential strains values are higher than those of the radial and longitudinal strains. This concludes that the heart model moves more in the circumferential direction. The circumferential strains are generally higher than those of the healthy model including the infarcted paths E and F. Similarly, the circumferential strains increase from the epicardial to the endocardial wall. In this case, the majority of strains values are positive. This means that the myocardium is in tension in the circumferential direction. This behaviour includes the infarcted regions.
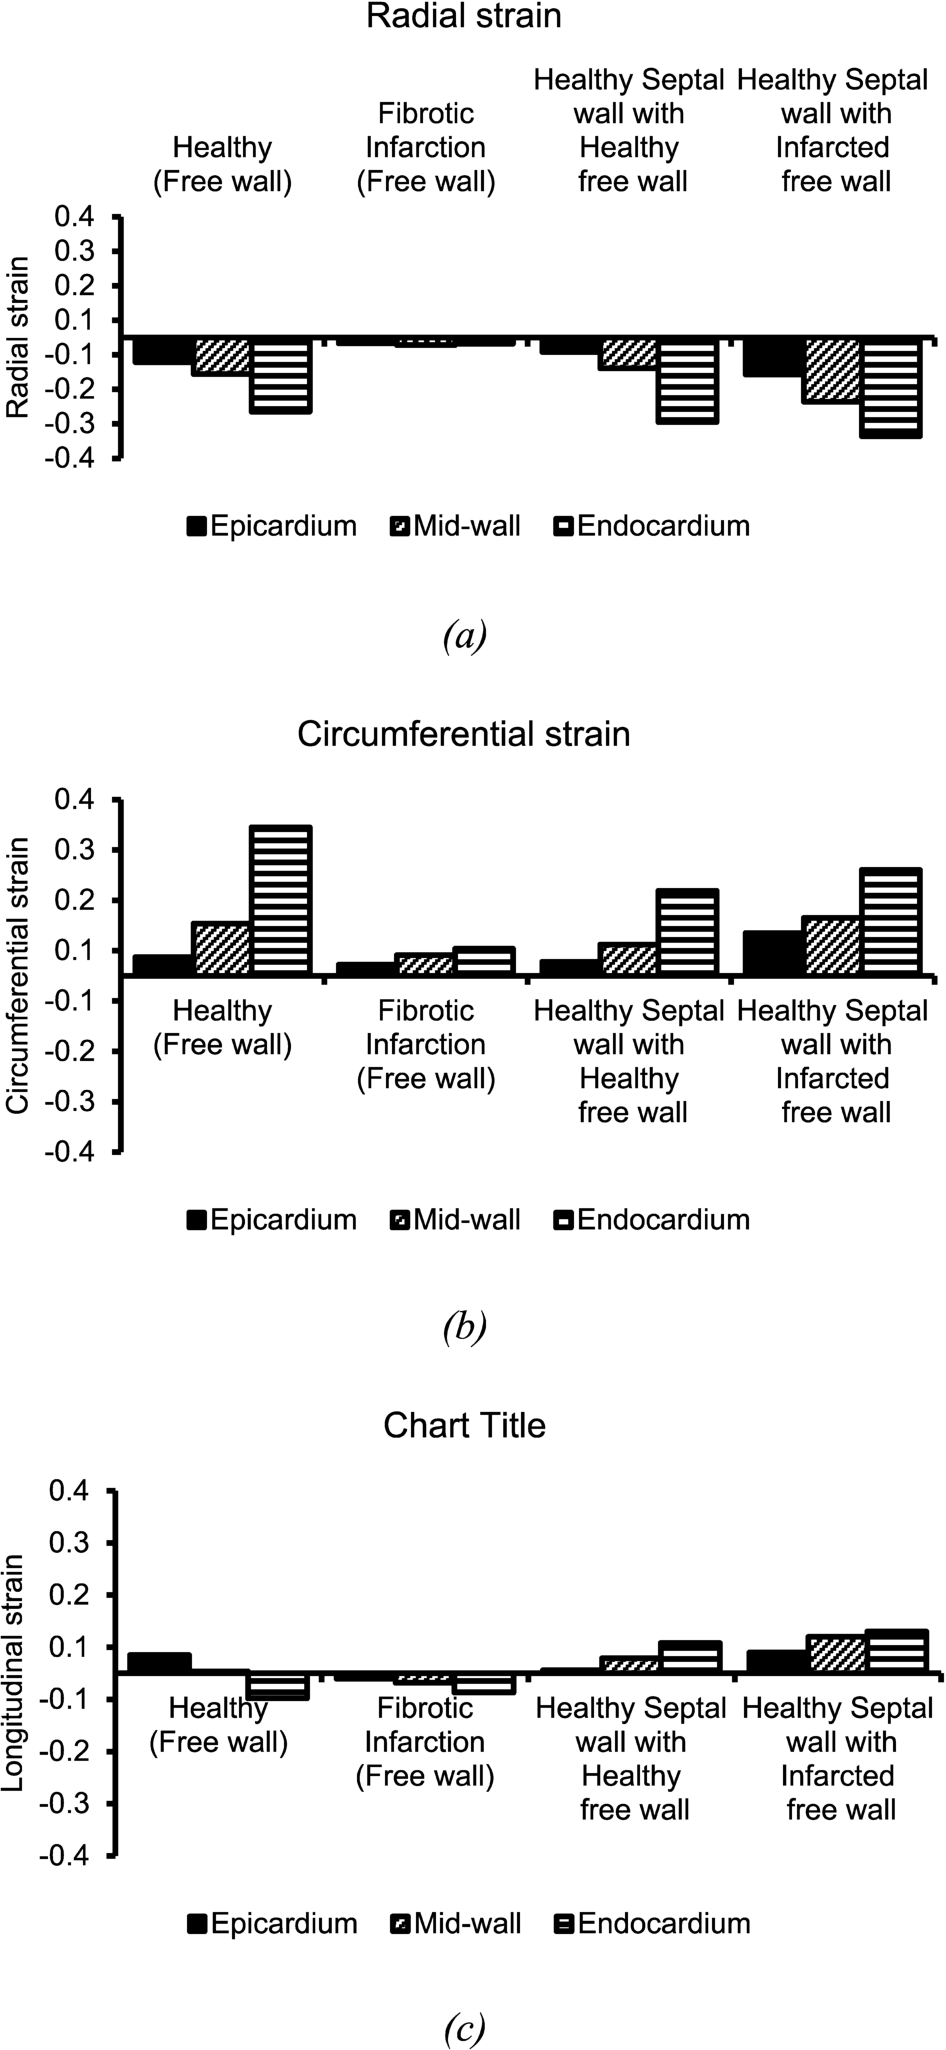
Comparison of average end-diastolic strain at paths EF and IJ at endocardium, mid-wall and epicardium of the healthy and fibrotic infarct models. (a) Radial strain, (b) Circumferential strain, and (c) Longitudinal strain. This Figure shows the average strain in the radial, circumferential and longitudinal directions in the epicardium, mid-wall and endocardium. These values were calculated using the identified paths as shown in Fig. 3.
As shown in Fig. 4(c), the longitudinal strains behave slightly differently to the longitudinal stresses. The longitudinal stresses show higher stress value at both the endocardium and the epicardium wall. Furthermore, the longitudinal strains behaviour is similar to that of the radial and circumferential strains. This means that the longitudinal strains are nearly zero at the epicardium wall and increase as they approach the endocardium. The longitudinal strains are at the highest at the endocardium wall. Figure 4(c) shows the behaviour of longitudinal strains in eight paths on LV. The values show that the fibrotic infarct model has low movement in the longitudinal direction.
Figure 3 shows the arrangement of intramural paths along which stress and strain results will be assessed and illustrated. Depending on the cardiac region, the transmural position is expressed by the normalised myocardial thickness ranging between 0 and 1 as follows:
LV free wall: 0 = epicardium, 0.5 = mid-wall and 1 = endocardium,
Septal wall: 0 = RV endocardium, 0.5 = mid-wall and 1 = LV endocardium.
Figure 5(a)–(c) shows the transmural radial stress. The myocardium is in compression state in the radial direction. Generally, on the free wall, the radial stresses increase from 0.6 kPa to 4.8 kPa on epicardium and endocardium, respectively. However, on the septal wall, the radial stress has a high value of −0.9 kPa at the epicardium of the RV. This is because the load pressure is applied to the endocardium. The epicardial wall is left to be free with no external load applied on it. The radial stress near the boundary condition at the base that was fixed in both radial and longitudinal directions is not predictable and remains negligible compared to other regions or paths.
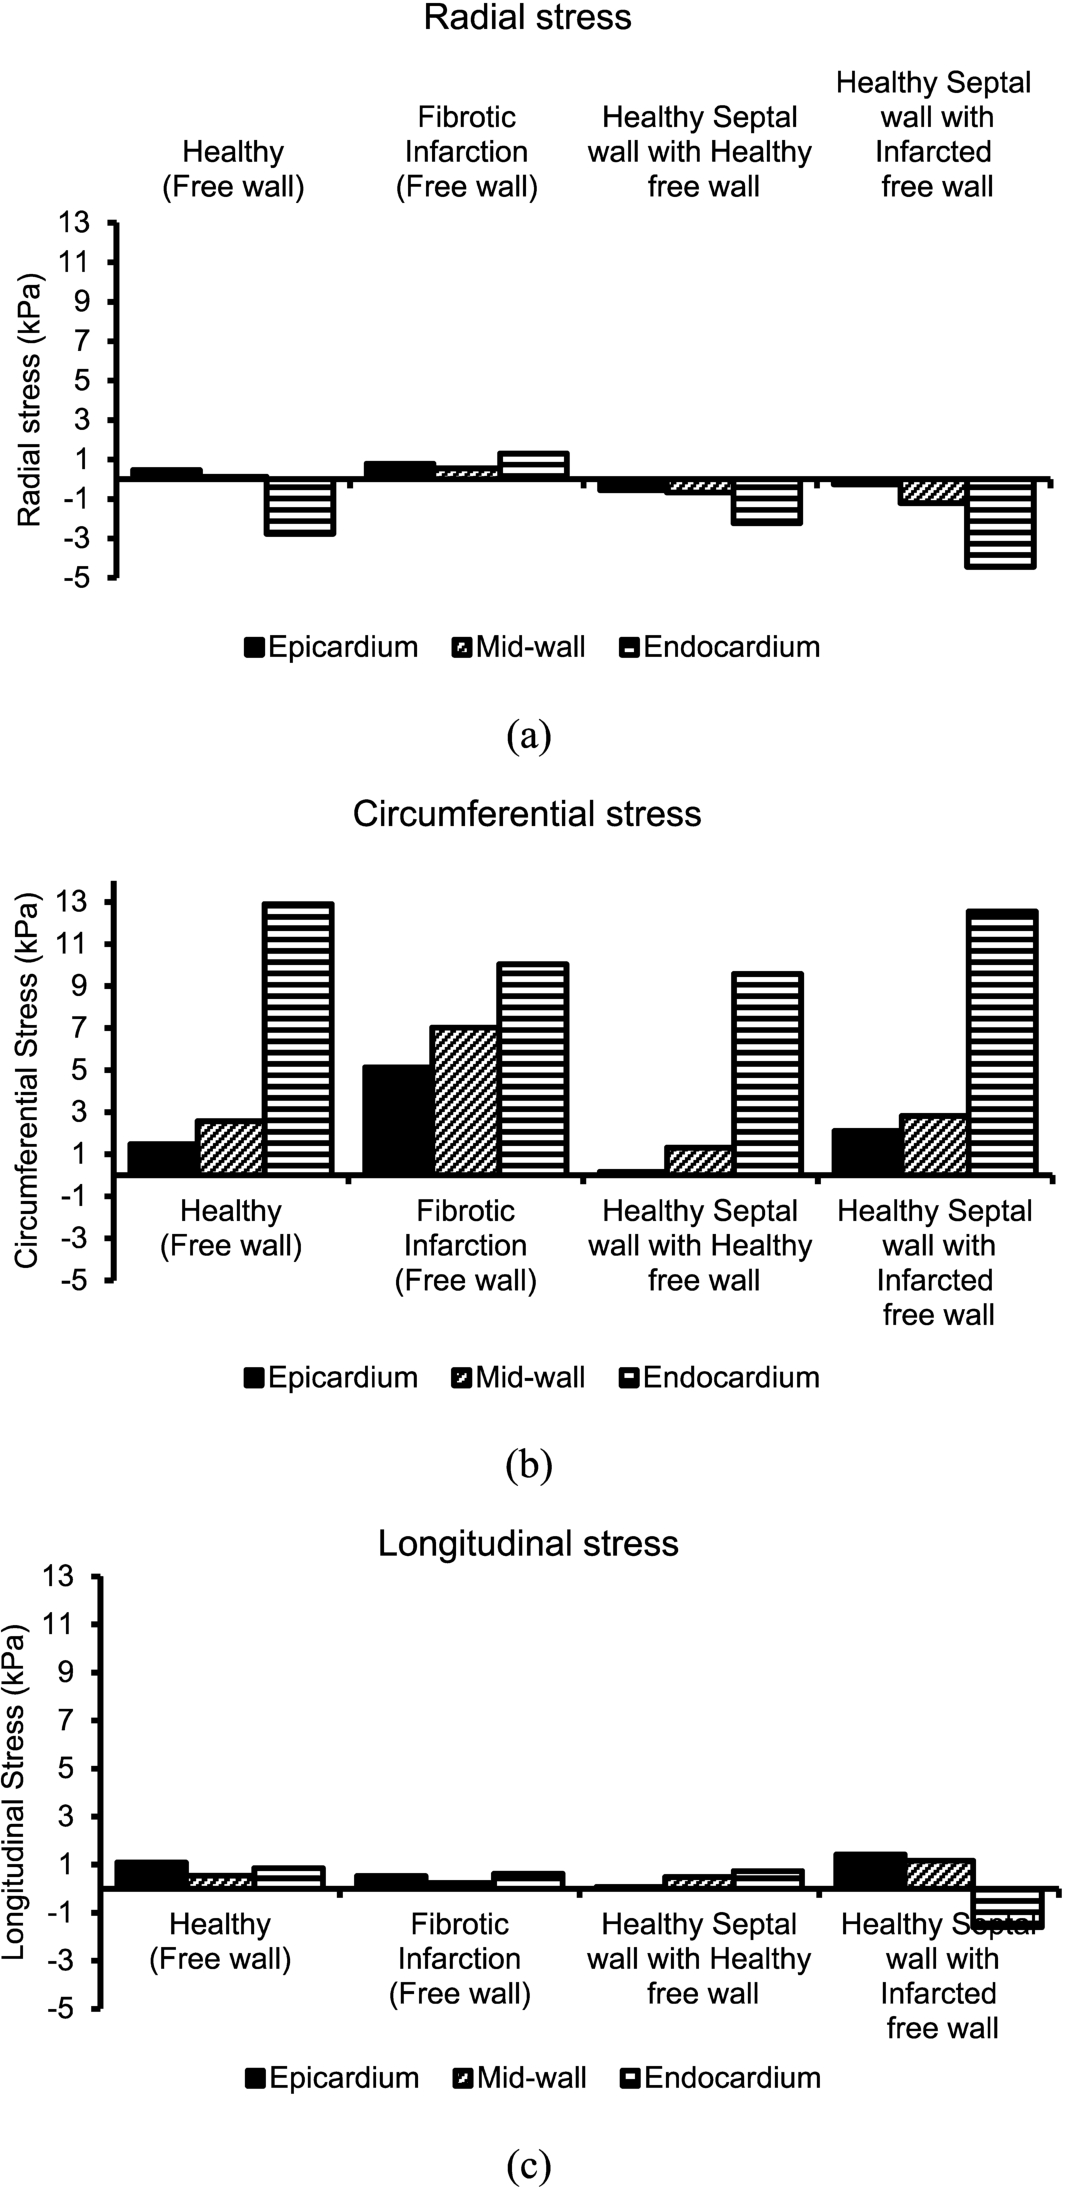
Comparison of average end-diastolic stress at paths EF and I, J, at endocardium, mid-wall and epicardium of the healthy and fibrotic infarct models. (a) Radial stress, (b) Circumferential stress, and (c) Longitudinal stress. This Figure shows the average stress in the radial, circumferential and longitudinal directions in the epicardium, mid-wall and endocardium. This values were calculated using the identified paths as shown in Fig. 3.
The infarcted regions as shown in Fig. 5(a) are paths E and F. The rest of the paths are on the healthy myocardium and are expected to behave like the healthy model. Again, the infarcted regions on the four-week heart models are represented by regions E and F (see Fig. 5(b)). As shown in Fig. 5(b), the circumferential stress remains high to the value of 5.6 kPa as compared to the radial stresses. Again, the circumferential stresses increase as a function of normalised myocardial thickness. The stress is high at the epicardium and low at the endocardium. The highest circumferential stress is approximately 19 kPa whereas the radial stress is 4.8 kPa. In both the healthy and infarcted rat heart models, the circumferential stresses were observed to be higher than both radial and longitudinal stress at the infarcted and healthy regions.
Figure 4(c) shows the longitudinal stresses of the healthy and infarcted rat heart models. Paths A to F indicate low longitudinal stresses in all rat heart models when compared to both the radial and circumferential stresses. The paths I and Jin the septal region show lower longitudinal stresses compared to the values reported along paths A to F. As shown in Fig. 5(c) the healthy model shows the lower longitudinal stresses in paths E and F. This behaviour is also observed in both the two and four-week infarct models. In Fig. 5(c), the longitudinal stresses in paths E and F increase. The longitudinal stresses increase from average of 1.5 kPa to 3.2 kPa on E and F paths is attributed to the wall thinning on the model due to infarcted tissue.
The circumferential stresses values at the infarcted regions for two and four-week models in path E and F are generally lower than those in the healthy regions. (Please note that the healthy region is found in both the healthy and infarct models). As shown in Fig. 5(b), the circumferential stresses for the four-week infarct model are higher than both healthy and the fibrotic infarct models due to the stretching effect. This may be attributed to the further thinning of the wall in the four-week infarct model. The paths E and F circumferential stress start with low value at the epicardium and increases as it approaches the endocardium. It is important to note that the circumferential stresses of the septal wall exhibit different behaviour than those of the wall on LV. The circumferential stresses begin at the epicardial wall of LV at a value of approximately zero.
The longitudinal stresses as shown in Fig. 5(c) show that the myocardium is under tension longitudinally. In the infarcted heart models considered, the longitudinal direction has the lowest average stress value of 1.5 kPa as compared to 4.8 kPa of both the radial stresses. It is important to note that the longitudinal stresses vary as a function of normalised myocardial thickness. However, for all three models, the longitudinal stress has different behaviour when compared to radial and circumferential stress. In addition, the radial stress varies from endocardium to epicardium with nearly 0.2 kPa and 4.8 kPa at the epicardium and endocardium, respectively. Comparing the healthy and fibrotic infarct model, the longitudinal stresses remain the lowest when compared with both radial and circumferential stresses. At the infarcted regions E and F, the longitudinal stresses have decreased by an average of 65% when compared to radial and circumferential stresses. This exhibits a similar trend with that of the healthy model. The longitudinal stresses show that the myocardium is under tensile state. The radial and circumferential stresses path shows a steady increase from the epicardium to the endocardium for all heart models. In this case, the stress values are high at both end i.e. endocardium and epicardium. In the majority of paths the longitudinal stresses have lower value at the mid-wall.
The average radial stress percentage change of the healthy septal wall on the epicardium was 114% lower than the infarcted septal wall. The average radial stress percentage change of the healthy septal wall on the mid-wall and endocardium was 45% and 50% higher than the infarcted septal wall, respectively. Similarly, the average circumferential stress percentage change of the healthy septal wall on the epicardium, mid-wall and endocardium was 93%, 54% and 24% higher than the infarcted septal wall, respectively. Moreover, the average longitudinal stress percentage change of the healthy septal wall on the epicardium, mid-wall and endocardium was 95%, 58% and 145% higher than the infarcted septal wall, respectively (see Fig. 7).
Animals with fibrotic myocardial infarction on the free wall LV may also present heart failure, even though they may have a healthy pumping chamber. It is clear that fibrotic infarction in the LV free wall may play a role in the early heart failure or unexpected heart failure due to an increased stress and strain in the health septal wall. A further understanding of remodelling LV free wall mechanics is needed not only to complete this investigation but also to observe the effect of LV remodelling in the septal wall. In animal with fibrotic infarction on the LV free wall, both stress and strain increased on the septal wall have been observed. These observations and effects of stress and strain increase in the septal wall due to fibrotic infarction are important as this may affect the global functioning of the heart and lead to heart failure. It is noted that the percentage change of stress and strain in mid-wall, epicardium and endocardium has increased by up to 1220%. Indeed, this study has demonstrated an in vivo difference that septal wall may over stretched to compensate for the loss of pumping function of the free wall due to fibrotic infarction.
End-diastolic stress in the septal wall
The discoveries reported in this study are consistent with the outcomes displayed [30,32,35–38]. In physiological conditions, the fibrillar collagen system is in intimate contact with all the diverse cell types of the myocardium and assumes a basic part in the support of ventricular shape, size, and function. Myocardial fibrosis, characterized by a noteworthy increment in the collagen volume fraction of myocardial tissue, is constantly present in end-stage heart failure [39]. The circulation of myocardial fibrosis, nonetheless, shifts as indicated by the basic pathology and records for inconsistencies among various pathological reports in which just qualitative rather than quantitative estimations were made [39–42]. Investigations of LV diastolic chamber properties with myocardial infarction in human and in various animals models have shown adjustments in ventricular chamber firmness and in myocardial stiffness. It has been brought up that adjustments in chamber properties may reflect changes in inherent myocardial properties, and different variables, for example, ventricular thickness and geometry.
In both animal models and in the human heart, it is for the most part held that cardiac myocyte or pump is the essential starting occasion that prompts heart remodelling, in spite of the fact that remodelling can happen without myocyte brokenness in some exploratory models. Various studies have recommended that coming up short human cardiac myocytes experience various vital changes that may be relied upon to prompt a dynamic loss of contractile function.
Various changes that happen amid the procedure of LV free wall fibrotic infarction may add to declining heart function. Main among these progressions is the expansion in LV wall stress that happens amid LV free wall fibrotic infarction. To be sure, one of the principal perceptions as for the irregular geometry of remodelled ventricle was the reliable finding that the remodelled heart was larger as well as more circular fit as a fiddle. The expansion in wall thinning made by LV widening prompts an utilitarian an increase stress and diminished strain that may encourage add to a decline in forward cardiac output [43].
Figure 7(a) shows the radial stresses at LV endocardium, mid-wall and LV epicardium in the septal wall of healthy and fibrotic infarct models. The septal region of interest was defined by the paths I and J. The radial stresses at I, J, K and L regions have the average value of 3.8 kPa in the endocardium wall. The healthy model shows the radial stress as lower than the applied pressure of 4.8 kPa in the endocardium wall. Region K shows the lowest radial stress for the healthy model at 1.1 kPa at the endocardial wall. This is similar in the mid-wall, because the radial stress at the mid-wall in the healthy model is the lowest at less than 1 kPa. Furthermore, the radial stresses in regions I and J, are shown to be equal in the epicardium for healthy, fibrotic and four-week infarct models. The four-week infarct model has the highest value of radial stress at region K at both the endocardium and the epicardium. For the fibrotic infarct model, the highest radial stress is located at region L with the value of 4.7 kPa. At the same position and model, the radial stress at the mid-wall is the highest at region L with the value of approximately 2 kPa. At the epicardium in region I, the radial stress is 0.8 kPa for both the healthy and four-week infarct models. The radial stress in region I for the fibrotic infarct model is lower than both the healthy and four-week infarct models at a value of 0.67 kPa.
Figure 7(a)–(c) shows the stress in the radial, circumferential and longitudinal directions for healthy, two and four-week infarct models in the I and J regions/paths. These stresses are measured by the defined paths in the endocardium, mid-wall and epicardium positions at end-diastole phase. It can be seen from Fig. 7(a)–(b) that the radial, circumferential and longitudinal stresses are high at the endocardium. This is because the applied pressure mimicking the end-diastolic pressure of 4.5 kPa and 0.92 kPa was applied on the endocardial wall of LV and RV, respectively. The circumferential stresses as shown in Fig. 7(a)–(c) are high at all positions from endocardium to the epicardium. It is vital to note that the stresses in radial, circumferential and longitudinal directions are high at the four-week infarct model followed by the fibrotic infarct model. The healthy model is showing low stress in all directions when compared to the four and fibrotic infarct models.
The highest radial stress is 4.5 kPa shown in region K followed by region J at the endocardium on the four-week infarct model. All models, including the healthy and infarcted, have no pressure applied on the epicardium. However, their radial stress at the epicardium is the lowest in all regions when compared to endocardium and mid-wall positions. In general, the radial stresses at the epicardium in regions I and J for healthy, two and four-week infarct models show stress which is flat. In other words, the radial stress remains the same in regions I and J irrespective of the models as shown in Fig. 3(c). This observation could be attributed to the fact that all surfaces at the epicardial position experience the same pressure irrespective of whether the model is healthy or infarcted. The regions I and J are positioned between the LV and the RV. In fact this wall divides the RV and the LV. However, this wall is subjected to the applied pressures on both sides of the wall.
Figure 7(b) shows the circumferential stress in the epicardial position in the regions I andJ for healthy and infarct models. Furthermore, the circumferential stresses in all regions are approximately equal in magnitude for the four-week infarct model. The healthy model shows the minimum circumferential stress as compared to infarct models at end-diastole at the epicardial position. The average stress for the four-week infarct models in regions I and J is estimated to be 3.0 kPa. At the endocardium, the highest circumferential stress is 22 kPa at region I followed by 20.0 kPa at region K for the four-week infarct model. Again, the circumferential stress for the healthy model at the endocardium is lower compared to the infarct models. The general trend observed in Fig. 7(c) is that at each region, the highest circumferential stress is linked to the four-week infarct model followed by the fibrotic infarct model and lastly the healthy model. When comparing the circumferential stress at the mid-wall and epicardium for all models, it can be seen that the average circumferential stress is 6 kPa at the mid-wall, while the average circumferential stress is 3.0 kPa at the epicardium. To note here is that the circumferential stresses are all positive which indicates that the model is under tension in endocardial, mid-wall and epicardial positions at the end-diastole phase as shown in Fig. 7(a)–(c).
Figure 7(c) shows the longitudinal stresses in regions I and J at endocardial, mid-wall and epicardial positions for healthy and infarct models. Generally, the longitudinal stresses at endocardium, mid-wall and epicardium in the regions I and J are approximately equal for healthy and infarct models. This behaviour is expected because the movement in the longitudinal direction is the same in all models since the pressure applied on the endocardial wall is the same. The longitudinal stresses in mid-wall and epicardial positions are positive and this indicates that the models are under tension. In other words, the heart models expand in the longitudinal direction.
Therefore, early multifactorial interventions might be necessary to arrest the malfunctioning of the septal wall after left ventricular fibrotic infarction has occurred. This study exhibits that dynamic left ventricular dilatation is connected with dynamic global heart dysfunction. Nonetheless, dilatation of the left ventricle after fibrotic infarction is not really dynamic and does not really predict a poor result. A few factors have been distinguished that foresee an expansion in left ventricular volume after myocardial localized fibrosis. These incorporate infarct area, and the area (foremost) of the infarct. A patent infarct-related course is additionally connected with a smaller left ventricular volume and better survival in patients after myocardial fibrotic infarction [44].
Left ventricular amplification and the improvement of continual heart failure are intense indicators of survival in patients after myocardial infarction. The aggregate rate of heart failure ascends in the years after fibrotic infarction, and its clinical indicator is connected with an adverse prognosis. Dilatation of the left ventricle may assume a vital dynamic part in the advancement of chronic heart failure, and left ventricular volume is the most effective indicator of survival in patients with coronary illness. Worsening of cardiac performance corresponds with the level of dilatation in trial localized necrosis, and left ventricular dilatation goes before decay of practice execution in patients. However, the connection of left ventricular dilatation to chronic heart failure is construct principally in light of circuitous evidence and has not been thoroughly examined in individual patients. Dilatation of infarcted and non-infarcted heart of the left ventricle has been observed.
Animal models have characterized myocardial infarct size as a noteworthy determinant of left ventricular dilatation, and late clinical studies have affirmed this perception. Infarct size, prognosis, and ejection fraction are firmly related; the last has been utilized to choose patients inclined to ventricular dilatation. In patients, left ventricular dilatation has all the earmarks of being the consequence of a long-term intelligent procedure of numerous factors. Their relative significance for dilatation and heart failure has not been evaluated, and no forthcoming criteria are accessible to distinguish singular patients who might be at high hazard for advanced dilatation and perpetual heart failure.
Generally, the percentage change average radial stress in the pericardium, mid-wall and endocardium of healthy vs fibrotic infarction (free wall) is higher than the healthy vs fibrotic infarction (septal wall). In the radial direction, 312% stress percentage change is recorded on the endocardium of the healthy and fibrotic infarction (free wall). Similar trend is observed in the circumferential direction where the highest percentage change of 71% is recorded on the epicardium of the healthy and fibrotic infarction (free wall). In the longitudinal direction, the percentage change of strain of 106% on the epicardium of the healthy and fibrotic infarction (free wall) is observed. When looking at the healthy vs fibrotic infarction (septal wall), the highest percentage change is observed on the epicardium. The highest percentage change (strain) in the radial and circumferential directions for healthy vs fibrotic infarction (septal wall) are 114% and 93% in the epicardium, respectively. The smallest percentage change (stress) in the radial, circumferential and longitudinal directions of 45%, 24% and 58% in the mid-wall, endocardium and mid-wall are observed in the healthy and fibrotic infarction (septal wall) (see Fig. 7). The highest percentage change (strain) in the longitudinal direction for healthy vs fibrotic infarction (septal wall) are 145% in the endocardium, respectively.
End-diastolic strain in the septal wall
A major finding of this study is the marked increase in myocardial stiffness in septal wall from animals with fibrotic infarction in the LV free wall. In addition, fibrotic infarction in the LV free wall significantly increased the average stress and strain in the ventricular with a potential increased heart failure compared with healthy LV free wall. The present study demonstrates that the increased stress and strain on the septal wall is associated with myocardial fibrosis, increased myocardial stiffness. In this work, the anatomically realistic model of the rat biventricular model that employs a structure-based constitutive Fung model and a rule-based cardiac fibre distribution was developed. The model uses the Fung orthotropic model assuming that the myocardium is incompressible due to its high water content. This model was then used to simulate the diastolic mechanics of the healthy and infarcted hearts. The left and right ventricular myocardium were treated as an inhomogeneous, thick-walled, nonlinearly elastic, incompressible material, following the modelling framework of the Fung Model.
Figure 6(a)–(c) shows the strains in the radial, circumferential and longitudinal directions for healthy and fibrotic infarct models in the I and J regions/paths. As shown in Fig. 7(a), the radial strain is higher than the circumferential and longitudinal strains. The radial strains in all regions are low in the healthy model. At the endocardial position, the radial strains are high followed by the strain at the mid-wall. The radial strain at the epicardium is seen to be the lowest when comparing it to the endocardium and mid-wall.
As shown in Fig. 6(a), the radial strain at the endocardial position is observed to be the highest when compared to the circumferential and longitudinal strains in the healthy and fibrotic models. The longitudinal strains at the endocardium are −0.037 and −0.048 in the free wall of healthy and fibrotic infarct models, respectively. In addition, the circumferential strains of the free wall at the endocardium are 0.295 and 0.054 for healthy and fibrotic models, respectively. When looking at Fig. 6(a), it can be seen that the healthy model has lower radial strains at the epicardium. As shown in Fig. 6, the magnitude of the longitudinal strain in epicardium, mid-wall and endocardium are relatively small compared to both the radial and circumferential strain. It is important to note that the radial strains are positive at the endocardium, mid-wall and epicardium in regions I and J are in compression state. Figure 6(c) shows that the magnitude of longitudinal strain in the heathy septal wall is greater than the longitudinal strain of the septal wall in the infarcted model. Further, Fig. 6(a) shows that the radial strain at the endocardium in the septal wall of the infarcted model has increased when compared to the radial strain of the healthy septal wall.

Average stress percentage change of free wall (healthy and infarcted) and septal wall (healthy and infarcted). (a) Percentage change radial stress, (b) Percentage change circumferential stress and (c) Percentage change longitudinal stress. This figure shows the percentage change of free wall (Healthy vs infarcted LV free wall) and septal wall (healthy septal vs infarcted LV free wall model). The healthy septal wall was compred with the infarcted septal wall. In this case the infarcted septal wall mneans that the septal wall is in the model that has the infarcted LV free wall. Similarly, the healthy septal wall means that it is situated in the healthy LV free wall.
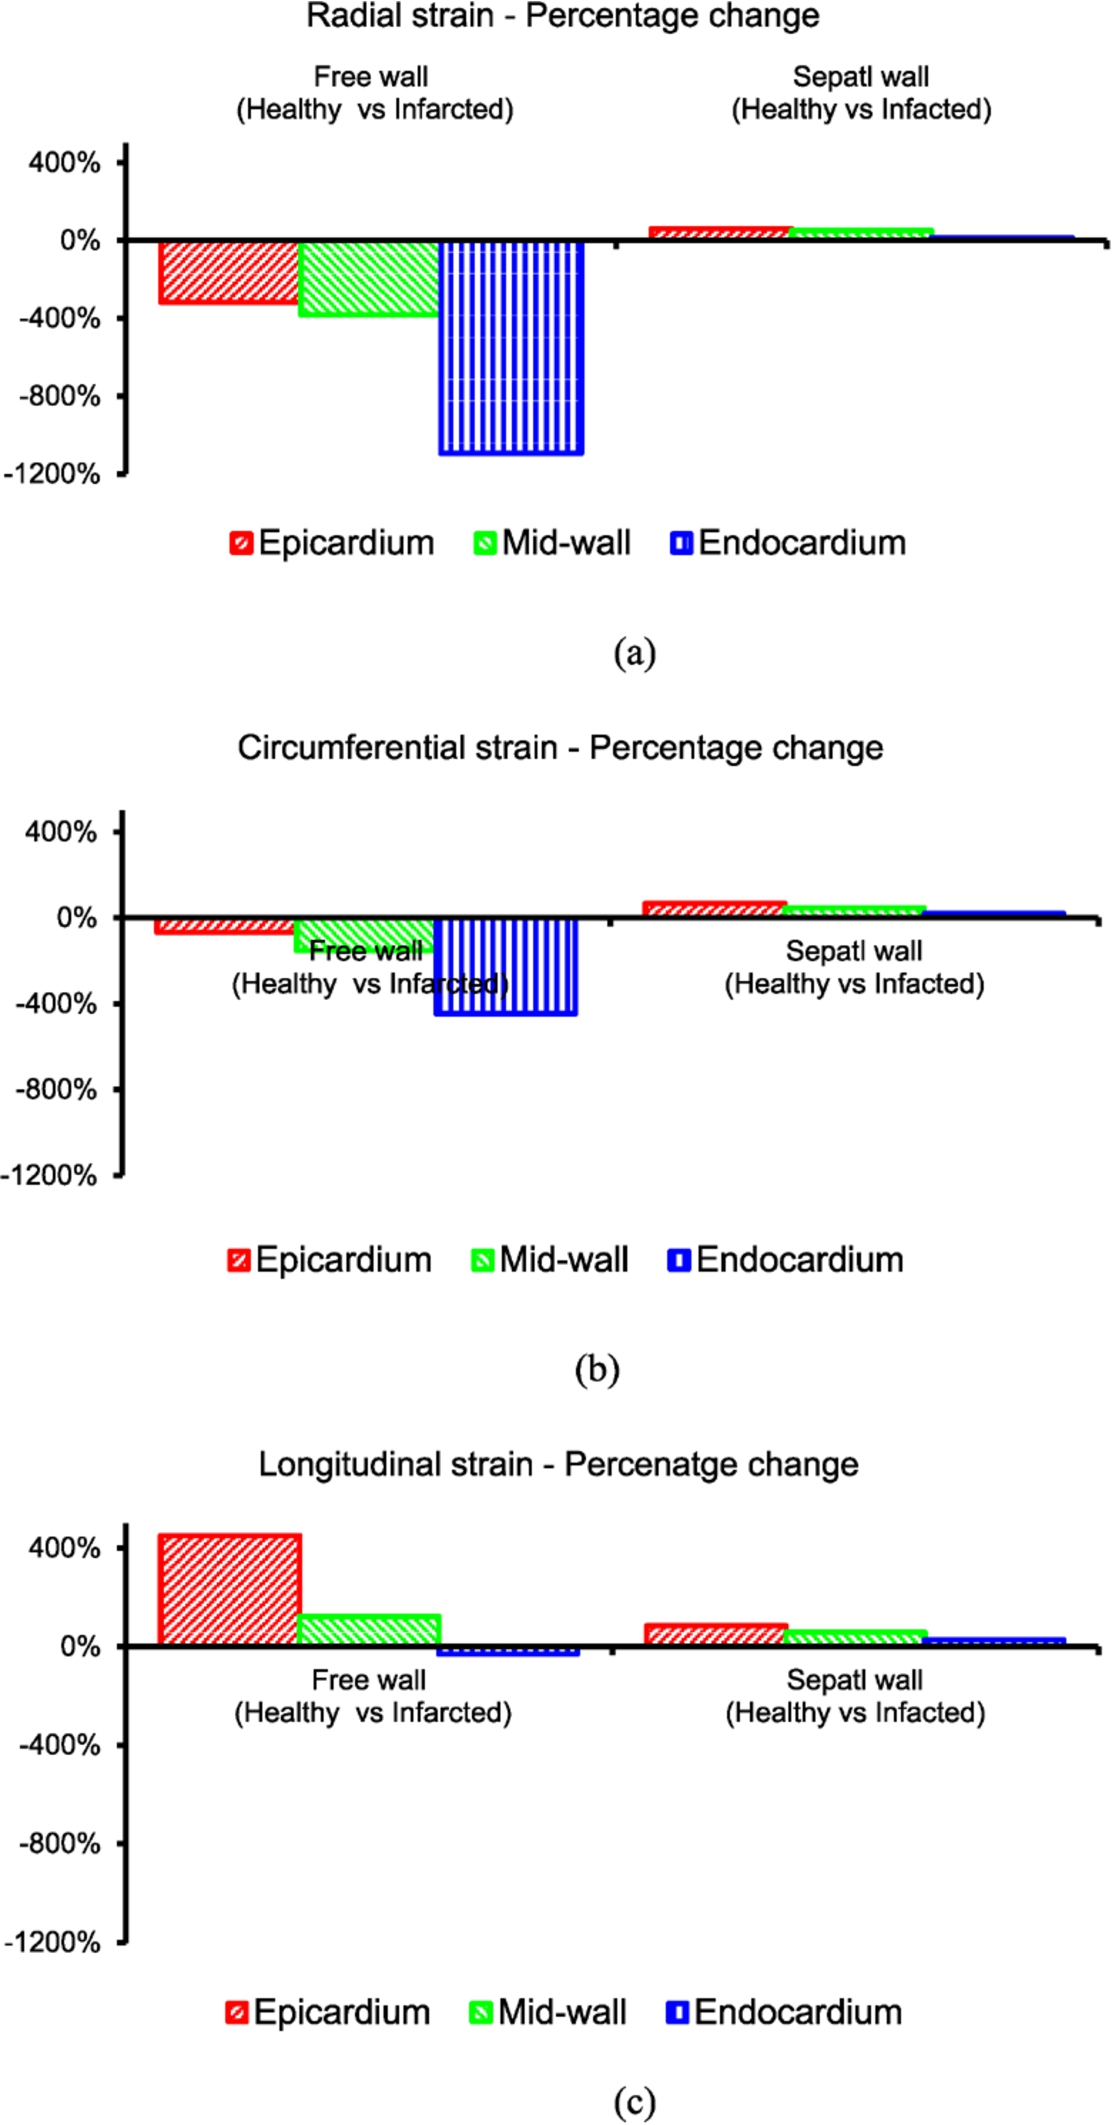
Average strain percentage change of free wall (healthy and infarcted) and septal wall (healthy and infarcted). (a) Percentage change radial strain, (b) Percentage change circumferential strain and (c) Percentage change longitudinal strain. This figure shows the percentage change of free wall (Healthy vs infarcted LV free wall) and septal wall (healthy septal vs infarcted LV free wall model). The healthy septal wall was compred with the infarcted septal wall. In this case the infarcted septal wall mneans that the septal wall is in the model that has the infarcted LV free wall. Similarly, the healthy septal wall means that it is situated in the healthy LV free wall.
Generally, the percentage change average radial strain in the pericardium, mid-wall and endocardium of healthy vs fibrotic infarction (free wall) is higher than the healthy vs fibrotic infarction (septal wall). In the radial direction, 1094% percentage change is recorded on the endocardium of the healthy and fibrotic infarction (free wall). Similar trend is observed in the circumferential direction where the highest percentage change of 446% is recorded on the endocardium of the healthy and fibrotic infarction (free wall). In the longitudinal direction, the percentage change of strain of 450% on the epicardium of the healthy and fibrotic infarction (free wall) is observed. When looking at the healthy vs fibrotic infarction (septal wall), the highest percentage change is observed on the epicardium. The highest percentage change (strain) in the radial, circumferential and longitudinal directions for healthy vs fibrotic infarction (septal wall) are 61%, 97% and 85% in the epicardium, respectively. The smallest percentage change (strain) is observed in the endocardium (see Fig. 7).
Various biaxial testing of resting heart shows that there is a slightly different mechanical properties between the healthy LV and RV [45,46]. In this study, it was assumed that the LV and RV material properties are the same and were assigned as such in the computational model. There is a disagreement that during fibrotic infarction phase, the mechanical properties of the infarct are the same as the healthy myocardium. In this study, the infarct was assigned different materials properties with a scaling factor applied in the infarct region. The assigned mechanical properties of the infarct and the healthy tissue may affect the stress and strain in both the septal wall and LV free wall.
Conclusions
A major finding of this study is the marked increase in myocardial stiffness in septal wall from animals with fibrotic infarction in the LV free wall. In addition, fibrotic infarction in the LV free wall significantly increased the average stress and strain in the ventricular with a potential increased heart failure compared with healthy LV free wall. The present study demonstrates that the increased stress and strain on the septal wall is associated with myocardial fibrosis, increased myocardial stiffness. In this work, the anatomically realistic model of the rat biventricular model that employs a structure-based constitutive Fung model and a rule-based cardiac fibre distribution was developed. The model uses the Fung orthotropic model assuming that the myocardium is incompressible due to its high water content. This model was then used to simulate the diastolic mechanics of the healthy and infarcted hearts. The left and right ventricular myocardium was treated as an inhomogeneous, thick-walled, nonlinearly elastic, incompressible material, following the modelling framework of the Fung Model.
The transmural distributions of the stress and strain of the healthy model were compared with results in fibrotic regions at end-diastole. This study has focussed on the behaviour of healthy septal wall with the infarcted free wall. The aim was to determine if there is an influence of free wall infarct in the healthy septal wall. It is clear that the infarct free wall has a negative impact in the behaviour of septal wall mechanics. It is concluded that the mechanics of the healthy septal wall is affected by the infarct in the free wall. The Fung model takes into account the fibre-reinforced microstructure of ventricular myocardium. After fibrotic infarction, the magnitude of the average strain in the septal wall of the infarcted LV free wall model has increased when compared to the healthy LV free wall model. Furthermore, this models shows that after fibrotic infarction, the magnitude of the average stress in the septal wall of the infarcted LV free wall model has increased when compared to the healthy LV free wall model. It was concluded that the fibrotic infarction has a potential cause the malfunction of the heart due to high myocardial stress and strain that the septal wall experiences.
Footnotes
Acknowledgements
The authors would like to thank Prof. Thomas Franz, Dr. Laura Dubius and Prof. Davies of the University of Cape Town (Mechanobiology Lab) for their contribution in the area of soft tissue mechanics. Further, the author would like to thank Dr. Mohamed Saleh, Prof. E. Meintjes, Dr. E.M. Alhamud A. and Dr. B.S. Spottiswoode for the development of GE sequence (fast low angle shot (FLASH)) used to obtain cine cardiac images for functional and structural assessment and Dr. S.-K. Sharp for handling the animals at the University of Cape Town. All the funding sources are gratefully acknowledged.
Conflict of interest
The author declares that he does not have conflicts of interest with regard to this manuscript and the data presented therein. FM carried out the simulation of the model, including pre-processing and post-processing of the results presented in the study. The author has read and approved the final manuscript. All animal study were approved by the University of Cape Town, Faculty of Health Sciences Animal Research Ethics Committee (REC) and performed in accordance with the National Institute of Health (NIH, Bethesda, MD, USA) guidelines.