
Abstract
BACKGROUND:
Escherichia coli (E. coli) bacteria normally live in the intestines of people and animals. Most E. coli are harmless and the treatment of the infection could be achieved by using antibiotics, however the effectiveness is still debatable and needs more investigation.
OBJECTIVE:
Researching the inhibition resonance frequency of square amplitude modulating waves (QAMW) that can inhibit the growth activity of E. coli and its ability to make division.
METHODS:
A range of different extremely low frequencies of square amplitude modulated waves (QAMW) from 0.1 to 1.0 Hz from two generators with a constant carrier frequency of 10 MHz, amplitude of 10 Vpp, modulating depth ± 2 Vpp and constant field strength 200 V/m were used to treat E. coli cells at 37 °C.
RESULTS:
The exposure of E. coli to 0.3 Hz QAMW for 90 min was the most inhibited frequency where the bacterial growth inhibited by 42.3%. Furthermore, a significant increase in antibiotic susceptibility to protein and cell wall inhibitors was investigated. Also, results of the chromosomal DNA sequences, dielectric relaxation and TEM indicated highly significant molecular and morphological changes after the exposure.
CONCLUSIONS:
We concluded that the exposure of E. coli to QAMW at the inhibiting frequency interfered with the bioelectric signals generated from the bacteria during the cell division and changed the cellular activity and DNA sequences, and these changes lead to a significant inhibition of the bacterial growth. This is a new promising technique that aids to avoid the repetitive use of antibiotics against the bacterial pathogens.
Introduction
Escherichia coli (abbreviated as E. coli) is a Gram-negative, facultative anaerobic, rod-shaped bacterium of the genus Escherichia that is commonly found in the lower intestine of warm-blooded organisms (endotherms) [1]. Some serotypes of E. coli can cause serious food poisoning in their hosts, and are occasionally responsible for product recalls due to food contamination [2]. E. coli and other facultative anaerobes constitute about 0.1% of gut flora, and fecal-oral transmission is the major route through which pathogenic strains of the bacterium cause disease [3,4]. Treatment of bacterial infection can be managed by using antibiotics such as fluoroquinolones, ciprofloxacin or azithromycin [5], however the effectiveness is still questionable and needs extensive investigation as well as the side effects of the used antibiotics and hence drawbacks on human health. Therefore, several studies have been performed to investigate the direct effects of electric, magnetic and electromagnetic fields on bacterial growth as alternative methods for the treatment of bacterial infections [6,7]. Recently, extremely low electromagnetic waves of very low field intensity which resonates with bioelectric signals generated during a particular metabolic activity were used to control physiological functions and cellular activity of microorganisms. These studies succeeded to control the growth of Ehrlich tumors in mice [8,9], fungi [10] and bacteria [11–13]. Therefore, the aim of the present work was to research the resonance frequency of the electromagnetic waves that inhibit the activity of E. coli and overlap its ability to make division, as well as to investigate the changes that may occur at the morphological and molecular level and changes in cellular membrane properties as a step forward to find out an imagination for the interaction mechanism of electromagnetic fields (ELF-EMFs) on the microbe.
Materials and methods
Microorganism growth conditions
The strain of Escherichia coli (ATCC 25922) used in this study was obtained from the Microbiology Center, Faculty of Science, King Saud University, Riyadh, Kingdom of Saudi Arabia. Physiological and biochemical tests were performed according to the methods mentioned by Hayward [14]. Bacteriological characteristics have been done according to Bergey's Manual of Systematic Bacteriology [15].
Bacterial reproduction
Firstly, a bacterial culture was prepared by inoculation of three colonies of bacterial cells, using a sterilized platinum loop, into 10 ml of sterilized nutrient broth/pH 7.1 (Biolife, Milan, Italy). Then, the bacterial culture was incubated for 48 h at 37 °C. After that, bacterial suspension was prepared by adding 400 μl of bacterial culture to 20 ml of sterilized nutrient broth to reach a final concentration of 108 cfu/ml. The bacterial suspension was then incubated at 37 °C and every 1 h the incubation was interrupted for absorbance measurements (using nutrient broth as reference). The Bacterial growth of E. coli was determined by measuring the absorbance at 600 nm (A600) every 1 h using the Shimadzu UV-VIS Spectrophotometer. The absorbance of bacterial suspension was then plotted as a function of incubation time.
Count-absorbance calibration curve
To study the bacterial growth, standard calibration curve was plotted between the absorbance of the samples at 600 nm and the concentration of the cells (CFU/ml) as determined by plate counting technique [16].
ELF EM exposure system
Samples of E. coli suspension were exposed to different extremely low frequencies of square amplitude modulating waves (QAMW) generated by Arbitrary/Function Generator (Tektronix AFG3052C Dual Channel Arbitrary/Function Generator) manufactured by Sony Tectonics, Japan. The carrier frequency was 10 MHz sine wave, the modulating waveform was square, the amplitude of the wave carrier was 10 Vpp and the modulating depth was ±2 V. Different groups of E. coli were exposed to different frequencies of the QAMW through two parallel copper electrodes of separation distance 1 cm with constant field strength of 200 V/m.
Determination of resonance frequency of growth inhibition
A fresh bacterial suspension of E. coli was prepared as mentioned previously. The concentration of the suspension has been adjusted to approximately 108 CFU/ml. The E. coli suspension was then divided into eleven groups (each group contains three samples of E. coli suspension). One group was kept as the control group and the other ten groups were exposed to different frequencies of QAMW in the range from 0.1 to 1 Hz in steps of 0.1 Hz for a period of 60 min. At the end of the exposure period, the control and exposed groups were incubated at 37 °C and every 1 h the incubations were interrupted for absorbance measurements at 600 nm in order to determine the resonance frequency of growth inhibition.
Determination of the optimum exposure time
In order to determine the optimum exposure time after obtaining the resonance frequency of growth inhibition, eight groups of E. coli suspension were prepared; one was kept as control and the other groups were exposed to QAMW at the inhibiting resonance frequency for bacterial growth at periods up to 120 min. After the exposure, all the samples were incubated at 37 °C without shaking. Every 1 h they were shaken and the absorbance of all samples were measured. The corresponding number of cells was calculated from the calibration curve.
Antibiotic sensitivity test
E. coli samples were subjected to susceptibility testing using: Ampicillin 10 μg (AM), Carbenicillin 100 μg (PY), Cefaclor 30 μg (CEC), Aztreonam 30 μg (ATM) and Rifampin 5 μg (RA). The antimicrobial sensitivity test was carried out in line with the procedures outlined by the National Committee for Clinical Laboratory Standards (NCCLS) [17]. The test was carried three times for each of the exposed samples and the control, and then the average value was calculated.
Dielectric measurements
The dielectric measurements have been done for control group, and group exposed to QAMW at resonance frequency for the most effective exposure time. The dielectric measurements were carried out for the samples in the frequency range 0.1-4 MHz using a Loss Factor Meter type HIOKI 3532 LCR Hi TESTER, version 1.02,1999, Japan, with a sample cell type PW 9510/60, manufactured by Philips. The sample cell is made of glass with two squared platinum black electrodes of 0.64 cm2 area and separated by 1 cm apart. For measurements, the sample cell was immersed in a glass beaker containing each bacterial sample so that the bacterial suspension covered the whole volume between the cell electrodes. The concentration of bacterial cells of different samples was adjusted to approximately 107 CFU/ml. During the measurements, the sample between the electrodes was kept at a constant temperature of 24 ± 0.1 °C in an incubator (Kottermann type 2771, Germany). The capacitance of the bacterial samples were measured at each frequency (f) and the resistance (R) was recorded. Each run was performed three times and the average was taken. The relative permittivity
DNA was extracted from 60 mg of fresh culture of E. coli (either control or exposed) according to the method developed by Dellaporta et al. [18]. The quality and quantity of extracting DNA were measured by means of agarose gel electrophoresis and confirmed by spectrophotometer. Code and nucleotide sequence of the primers used in the random amplified polymorphic DNA (RAPD) reactions are shown in Table 1. RAPD reactions were performed according to Williams, et al. [19]. RAPD reactions were conducted in a Techne TC-412 thermocycler (Barloworld Scientific Ltd, UK). Mid-range DNA Ladder (100 to 3000 bp) (Jena Bioscience, place, Germany) was used for molecular size differentiations. Gel documentation system (AAB Advanced American Biotechnology 1166 E. Valencia Dr. Unit 6 C, Fullerton, CA 92631) was used for DNA band scanning. The similarity level was determined by un-weighted pair group method based on the arithmetic mean (UPGMA).
RAPD primer sequences
RAPD primer sequences
The morphological changes of control and exposed samples to QAMW at the inhibition resonance frequency for the most effective time have been determined using TEM (JEM-1400; JEOL Ltd., Akishima, Tokyo, Japan) provided with CCD camera model AMT, Optronics camera with 1632 × 1632 pixel presented at Faculty of Agriculture, Research Park-Cairo University, Egypt. In order to prepare the bacterial sample to be examined by TEM, the samples should undergo some processing according to Demicheli et al. [20].
Statistical analysis
The statistical analysis of the data was performed using Student’s t-test and ANOVA analyses, the level of significance was set at p < 0.05. Each experiment was performed at least three times.

The growth curve of E. coli exposed to 0.3 Hz QAMW for a period of 60 min (■) as compared with control (⧫).
The concentration of E. coli in (CFU/ml) for control and exposed sample at 0.3 Hz for 1 h with its inhibition percentage difference
∗Significant (P < 0.05) ∗∗Highly Significant (P < 0.01) ∗∗∗Very High Significant (P < 0.001).
Growth curve characteristics of E. coli
Figure 1 illustrates the growth curve of E. coli cells after being exposed to 0.3 Hz QAMW for 1 h as compared with control (non-exposed). The difference from control was significant (P < 0.05). The number of CFU/ml for the control and exposed sample to QAMW at 0.3 Hz (the resonance frequency) post 12 h incubation was calculated from the standard calibration curve as shown in Table 2. It is suggested that the population intensity of the exposed bacterial sample had been reduced as compared to that of the control one with highly significant inhibition (P < 0.01).
Figure 2 shows the variation of absorbance of the samples exposed to QAMW in the range 0.0 Hz up to 1 Hz for 1 h measured at 12 h post incubation (as refer to its control samples) as a function of the applied field frequency. The data in the figure indicate highly significant growth inhibition occurred after exposure to 0.3 Hz for 1 h (P < 0.01).
Changes in the absorbance for exposed E. coli sample to QAMW post 12 h incubation with respect to control as a function of applied frequency.
Figure 3 shows the histogram for the growth inhibition percentages at 12 h post incubation after the exposure of E. coli cells to 0.3 Hz QAMW for several exposure periods. It is clear from the figure that the exposure of E. coli suspension for 90 min gives the maximum growth inhibition at the resonance frequency (0.3 Hz).
Antibiotic susceptibility test
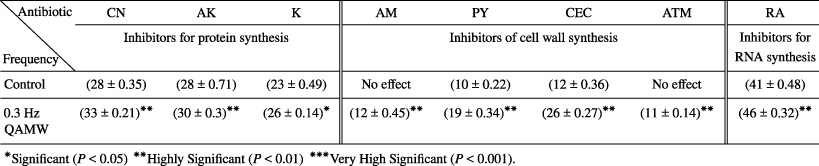
Table 3 shows the antibiotic susceptibility test results of E. coli for the control group and the group exposed to 0.3 Hz QAMW for 90 min. As can be seen in the Table, the group exposed to QAMW at 0.3 Hz had a highly significant increase in susceptibility to protein synthesis inhibitors (CN, AK and K), cell wall synthesis inhibitors (PY, AM, ATM and CEC), and the RNA synthesis inhibitor (RA) with respect to the control group.
The mean inhibition zone diameter (mm) of different antimicrobial agents for control and E. coli samples exposed to QAMW at 0.3 Hz for 90 min
The mean inhibition zone diameter (mm) of different antimicrobial agents for control and E. coli samples exposed to QAMW at 0.3 Hz for 90 min
Dielectric relaxation
As shown in Table 4, the values of the relaxation time (𝜏), the dielectric increment (
The relaxation time (𝜏), the dielectric increment (
) and the conductivity (𝜎) of control and exposed samples to 0.3 Hz QAMW for 90 min
The relaxation time (𝜏), the dielectric increment (
∗Significant (P < 0.05) ∗∗Highly Significant (P < 0.01) ∗∗∗Very High Significant (P < 0.001).
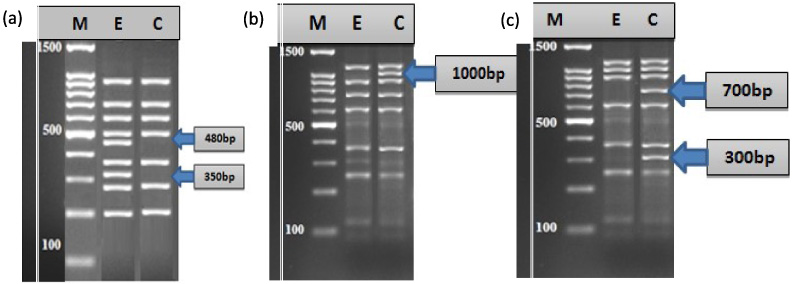
Electrophoretic RAPD patterns of E. coli DNA extracted from control and exposed groups to the inhibiting resonance frequency (0.3 Hz QAMW for 90 min) are shown in Figs 4a, b and c. Five different random primers were used in these patterns (OPA-10, OPA-13, OPK-08, OPA-02 and OPK-10). The results showed that only three, out of five screened primers, provided an informative RAPD pattern for all isolates. Figure 4a indicates the appearance of new bands in the exposed samples at 480, 350 bp for OPA-10 primer; however, Figs 4b, c show the disappearance of bands at 1000 bp for OPA-13 primer and at 700, 300 bp for OPK-08 primer for the exposed samples. There are no any differences in RAPD patterns for both control and exposed samples noticed for primers OPA-02 and OPK-10.
Histogram for the most effective inhibition time of E. coli sample exposed to 0.3 Hz QAMW for different exposure periods at 12 h of incubation.
Electrophoretic RAPD patterns of the nuclear DNA extracted from E. coli before and after exposure to 0.3 Hz QAMW for 90 min. (a) RAPD pattern using OPA-10 primer. (b) RAPD pattern using OPA-13 primer. (c) RAPD pattern using OPK-08 primer. M = DNA Ladder (DNA Marker). C = DNA of control sample. E = DNA of the treated sample exposed to 0.3 Hz QAMW for 90 min.
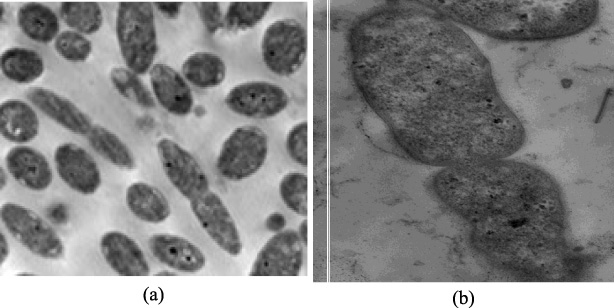
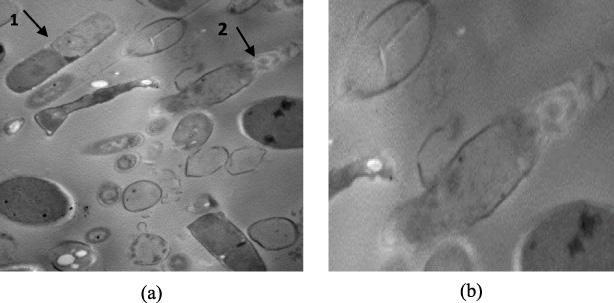
Figures 5a and b show selected images for the control E. coli cells as viewed by TEM. The cell envelope is a well preserved, a symmetrically stained, taut outer membrane and a semi-translucent periplasmic gel. Additionally, the cells look robust and during the binary fission, their chromosome is spread throughout the entire cytoplasm which indicates active metabolic processes. On the other hand, significant ultrastructural changes were observed in the morphological shape of exposed bacterial cells. Exposed cells to 0.3 Hz QAMW are shown in Figs 6a and b; fragmentation of DNA, a less dense electron space and a heterogeneous appearance of the cytoplasm which is an indication to the dissolution of the cell wall, pores which are formed by irreversible cell membrane breakdown, an extrusion of cytoplasmic contents from the cell wall and abnormal septations were observed.

TEM images of control E. coli cells with different field sizes. (a) The cell image reveals its uniform outer cell wall and membrane with high density organelles (Magnification 15000×). (b) The binary fission cell micrograph illuminates chromosome spread throughout the entire cytoplasm which suggesting an active metabolism (Magnification 50000×).

TEM images of exposed E. coli cells to 0.3 Hz QAMW for 90 min; (a) Showing abnormal septation, pores which are formed by an irreversible cell membrane breakdown and disorganization of cell contents during the cell binary fission (arrow 1 and 2) (Magnification 6000×). (b) Showing the dissolution of the cell wall and an extrusion of cytoplasmic contents from the cell wall (Magnification 40000×).
In the present work, a new method for controlling the growth of Escherichia coli by using extremely low frequency electromagnetic waves (ELF-EM) was studied. The changes that may occur in the nuclear DNA, antibiotic susceptibility and dielectric properties of E. coli after the exposure to QAMW at resonance frequency have been studied. Several studies that focused on the effect of electromagnetic fields on the growth of bacteria [21] observed a decrease in the number of viable bacteria following exposure to low-frequency electromagnetic fields at 50 Hz [22] and a decrease of optical densities for different bacterial strains exposed to a 50 Hz electromagnetic field at room temperature. Cellini L. et al. [23] demonstrated that the exposure of E. coli to 50 Hz electromagnetic fields acts as a stressing factor leading to phenotypical and transcriptional changes. In the previous studies only one type of field was investigated regardless the effect of frequency and resonance phenomenon. However, in the present study the effects of different frequencies of ELF-EMF on the growth characteristics of E. coli were investigated in order to determine the resonance frequency of growth inhibition. The present findings indicate that the exposure of E. coli suspension to 0.3 Hz QAMW for 1 h cause highly significant growth inhibition by 31.6% (Fig. 1 and Table 2) which indicates that 0.3 Hz QAMW is the resonance frequency of growth inhibition for E. coli. It may be presumed from the present results that the inhibition effect of the ELF-EMF is due to the interference of this field, according to its frequency with the bioelectric signals generated from physiological functions of bacterial cells. The mode of interference pattern affected the results of these interference reactions which may lead to inhibition (destructive mode) or enhancement (constructive mode) to the running physiological process [24]. Different biological effects recognized by the exposure of bacterial cells to ELF-EMF include; cellular division changes and cell morphotype [23], DNA and gene expression alterations [25,26], protein synthesis [27] and transport of ions by cell membranes [28]. To illustrate the changes that may have occurred in the cellular membrane structure as a result of exposure to QAMW at resonance frequency, two different experiments were performed, a) The dielectric relaxation and b) Antibiotic susceptibility test. The dielectric relaxation results as shown in Table 4, indicate a pronounced decrease in the average values of the dielectric increment (
The used strain of E. coli (ATCC 25922) is one of pathogenic strains of the bacterium which causes disease and there are different groups of E. coli that cause different symptoms e.g. diarrhea, fever, bloody diarrhea, and Shiga toxin-producing E. coli. Different trails should be done to investigate if there are any differences between these groups. We first applied 0.3 Hz QAMW for 90 min because it was the most inhibited frequency. In-vivo applications have been studied using electromagnetic field e.g., to prevent Ehrlich tumor metastasis in liver, kidney and spleen where the experiment was done on 30 female Balb/c mice. The whole body of mice were exposed to electromagnetic waves [8]. The exposure of E. coli to 0.3 Hz QAMW caused changes in the cell structure properties, which may affect the activity of the microbial division and cell to cell communication. The present findings suggest that the exposure of E. coli to QAMW at the inhibiting resonance frequency is a new non thermal technique may be an aid to avoid the repetitions uses of antibiotics against bacterial pathogens. The advantages of this technique are of being nondestructive, non-expensive for some extent and safer. On the basis of the present in-vitro study, our work now is to go in-vivo study to examine the optimal resonance frequency to inhibit the activity of E. coli and its ability to make the division.
Footnotes
Acknowledgements
The authors would like to thank the Deanship of Scientific Research at Princess Nourah bint Abdulrahman University for funding this work (project no. 164-37).
Conflict of interest
None to report.