



Abstract
In order to enhance lipophilicity and oral bioavailability of paeoniflorin (PF), this study developed paeoniflorin-phospholipid complex (PF-PLC) by solvent-evaporation method. The optimum preparation technology of PF-PLC was screened by the combination of single factor and orthogonal experiment. The physicochemical properties of PF-PLC were evaluated via differential scanning calorimetry (DSC), Fourier-transform infrared spectroscopy (FTIR), X-ray powder diffraction (XRD) and oil-water partition coefficient study (lgP). The result of FTIR spectra indicated that there was some strong hydrogen bond interaction and good compatibility between the phospholipid molecule and PF in the complex. DSC and XRD structure analysis showed that PF was in form of amorphous structure in PF-PLC, and lgP of PF-PLC was enhanced, suggesting that the lipophilicity of PF-PLC was higher than that of PF. In vitro release of PF-PLC showed slower release than PF solution with its cumulative release rate of 93.81% at 24 h compared to 93.43% of PF at 1.5 h. In pharmacokinetic experiments, the AUC and Cmax of the PF-PLC were 1.97-fold and 2.5-fold higher than PF solution. These results suggested that PF-PLC could enhance lipophilicity and oral bioavailability of PF and provide a promising delivery system for the application of PF.
Introduction
Paeoniflorin (PF) (Fig. 1) is a bioactive monoterpene glucoside and the main active ingredient that is extracted from the root of the Chinese herbals such as Paeonia albiflora pall, Paeonia suffruticosa Andr and Paeonia delavayi Franch [1–4]. It is stable in acidic environments (pH 2--6), but unstable in alkaline environments. A large number of studies have confirmed that PF has widely pharmacological activities including relieving a depressed liver, dilating blood vessels and relieving pain, anti-cancer, anti-inflammatory, hypoglycemic and protecting against various kidney diseases [5–8]. The mechanism of PF in anti-tumor may be induced by BNIP3, Bcl-2 family protein, NF-𝜅B signaling pathway, Fas/FasL signaling pathway, JNK signaling pathway and other signal pathways, mediated by extracellular-signal related kinases (ERK) to inhibit tumor cell proliferation, invasion and metastasis, and promote apoptosis to inhibited tumorigenesis, progression and metastasis [9–13]. Although PF has potential clinical value, some problems have hampered its clinical application. In general, PF is a highly water-soluble phenolic glucoside with poor liposolubility, and is not easy to pass through the cell membrane [14,15]. There was a research reveal that PF in the oral groups (25 and 50 mg/kg) were undetected by HPLC [16]. A new study of in situ intestinal absorption in rat showed that the absorption mechanism of PF was passive diffusion without the effect of bile and other excretory products [17]. In recent years, related research had shown that poor absorption of PF was mainly due to intestinal first pass effect, drug transporters and physicochemical properties, which leaded to low bioavailability (3%–4%) [18]. Liu et al. have found that the causes of PF’s poor bioavailability included poor permeation due to lack of lipophilicity, efflux via P-gp, and hydrolytic degradation in the intestinal brush border by some certain esterases [19].
Phosphate-containing lipids, known as phospholipids, are a vital component of cell membrane with good biocompatibility, biodegradability and low toxicity. Phospholipids (PL) play a major role in drug delivery due to its amphiphilicity that can modify the absorption rate of drug for the enhancement of drug permeation across biological barriers. Phospholipid complexes (PLC) were relatively stable compounds or complexes of drug and PL molecules formed by charge transfer [20–23]. After the drug and the PL formed a complex, the physical and chemical properties of the original drugs, such as phase transition characteristics, crystal characteristics, water dispersion properties, solubility, oil-water partition coefficient, etc. would change [24–27]. Just because PL are the basic components of the cell membrane, PLC generally had better transmembrane absorption on account of increased lipophilicity [28–30]. In conclusion, PLC can improve the physical and chemical properties of the original drug, and improve oral bioavailability.
The objective of this study was to develop paeoniflorin-phospholipid complex (PF-PLC) in order to facilitate the incorporation of PF into cell and improve its oral bioavailability. In this study, PF-PLC was prepared by a simple method and characterized by DSC, FTIR and XRD. Its n-octanol/water partition coefficient (lgP) and release were investigated. Furthermore, an in vivo bioavailability study after oral administration was performed in rats to study its pharmacokinetic behavior and bioavailability.
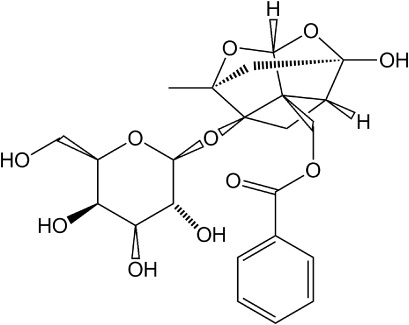
The chemical structure of PF.
Materials
PF (98%, purity by HPLC assay) was purchased from Wuhan Yuan Cheng Co., Ltd, and PL was obtained from Shanghai Tywei Pharmaceutical Co., Ltd. Perchloric acid and acetonitrile were high performance liquid chromatography (HPLC). All other chemical reagents employed in the experiments were analytical purity grade. Water used in experiments was deionized.
Preparation of PF-PLC
PF-PLC was prepared by the solvent evaporation method. Briefly, a certain amount of PF and PL with the molar ratio of 1:1, 1:2 and 1:3 w/w, respectively, was all dissolved in 4.00 mL ethanol to obtain uniform solution. The mixture solution was maintained at various temperatures with different times, i.e., 25 °C, 40 °C, or 60 °C for 1 h, 2 h or 4 h to form PF-PLC. After evaporating the organic solvent by rotating decompression, the resultant product was washed with n-hexane to remove excess PL. Furthermore, the dried residues were placed in dryer overnight to obtain PF-PLC for further use. The same ratio of PF and PL was simply mixed to form physical mixture (PF-PM) as control. The levels and factors of single factor investigation can be found in Table 1.
The levels and factors of single factor investigation
The levels and factors of single factor investigation
The concentration of PF in PF-PLC was determined by HPLC (Shimadzu Technologies, Japan). The COSMOSIL C18 column (4.6 mm × 250 mm, 5 μm; Nacalai Inc., Kyoto, Japan) was selected as the stationary phase and operated at room temperature. The mobile phase was comprised of water and acetonitrile (83:17, v/v) and maintained at a flow rate of 1.0 mL/min. The samples were analyzed by HPLC at 231 nm and the injection volume was 20 μL.
Combination ratio of PF-PLC
The combination ratio was calculated on the following basic formula:
lgP of PF-PLC
lgP of PF and PF-PLC was carried out by adding excess of PF and PF-PLC into 10.00 mL phosphate buffer (pH 2.06, 2.55, 4.64, 5.62, 6.86, 7.13, 8.11) in sealed glass containers at 25 °C, respectively. Each experiment was performed in triplicate. All the resultant liquids were vibrated for 1 h and centrifuged at 4000 r/min for 10 min to remove excessive residues. Then, 1.00 mL supernatant was taken and an equal volume of water saturated n-octanol was added, after which they were shaken for 1 h and centrifuged at 4000 r/min for 10 minutes. After diluting 0.10 mL of the sub-layer aqueous solution to 50 mL with water, the mixture solution was injected into a HPLC system and detected as the previous description. P of PF determination of PF material and PF-PLC was calculated as follows:
Fourier-transform infrared spectroscopy (FTIR)
FTIR spectrophotometry (FTIR Spectrometer, JASCO 6100, Japan) was used to study the interaction between PF and PL. The IR spectra of PF, PL, the prepared PF-PLC and PF-PM were obtained by mixing with KBr. Scanning took place over the wavelength range from 4000 cm−1 to 400 cm−1.
Differential scanning calorimetry (DSC)
The thermograms of PF, PF-PLC, PF-PM and PL were investigated by means of differential scanning calorimetry (DSC) (Q200 F3 NETZSCH, Selb, Germany). The thermal behavior was studied by heating 2.0 ± 0.2 mg of each individual sample in aluminium pan under nitrogen gas flow. The investigation was carried out over the temperature range 0–180 °C at a heating rate of 10 °C/min. An empty aluminum pan was used as reference to calibrate the temperature and energy scale of the DSC apparatus.
X-ray diffraction (XRD)
The crystalline state of PF in the different samples was evaluated with XRD diffractometer (Bruker axs System, D8, Germany) using Cu K𝛼 radiation (tube operated at 40 kV, 40 mA). Data was collected over an angular range from 3° to 45° with a step size of 0.02° at room temperature in continuous scan mode.
In vitro release of PF
The solution of PF and PF-PLC were prepared to investigate the dissolution profile using USP dissolution apparatus II method under sink conditions. Briefly, equivalent amount of PF for the two formulations were put into two dialysis bags (molecular weight cut off 8000–14000 Da, USA) and the dialysis bags were placed into a beaker filled with 200 mL of the release medium (ultra-pure water) and shaken at a rotation speed of 100 r/min at a constant temperature of 37 ± 0.5 °C. Then, at 5, 10 min, 0.5, 1, 2, 4, 6, 8, 10, 12, 24 h, 2.00 mL dissolution medium was taken out for analysis and replaced with an equal volume of fresh release media. The PF samples were analyzed by HPLC at 231 nm. All experiments were performed in triplicate.
Pharmacokinetic study in rats
All animal experimental protocols were approved by the Animal Care Committee of Anhui University of Chinese Medicine. Twelve healthy Sprague Dawley (SD) rats were supplied from Experimental Animal Center of Anhui Province (2011-002, Hefei, Anhui, China) and were randomly divided into two groups with half male and half female rats. One group for administration of PF at a dose of 200 mg/kg and the other group for administration of PF-PLC at a dose equivalent to 200 mg/kg of PF. The healthy rats were fasted overnight but were allowed to take water freely. Blood samples were collected at specific time intervals and centrifuged at 3000 rpm for 15 min to separate the plasma. After the plasma protein was precipitated with 6% perchloric acid, the concentration of PF was measured by HPLC.
Statistical analysis
The pharmacokinetic parameters were computed by the software program DAS 2.0. All values were expressed as mean ± the standard deviation (SD). Statistical analysis was carried out using Student’s t-test. Differences were considered statistically significant at p < 0.05.
Results and discussion
Preparation of PF-PLC
The results of orthogonal experiment design are shown in Table 2. The optimized preparation was X1(60 °C), X2(1:2) and X3(80). In order to validate it, three parallel tests were performed using the optimized preparation conditions. The combination ratio of PF and PL was 99.13 ± 1.47%, indicating that the PF was combined fully with PL. The prepared PF-PLC were subjected to further investigations in order to confirm complex formation.
The results of orthogonal experiment design
The results of orthogonal experiment design
FTIR spectroscopy can confirm the formation of PF-PLC by comparing the spectrum of PF-PLC with that of PF. Figure 2 was characterized to investigate the possible interactions between PF and PL in the phospholipid complex. The spectrum of PF (Fig. 2d) showed a characteristic peaks at 3541 cm−1 (-OH, Hydroxyl stretching), 1470 cm−1 (C=C, aromatic ring stretching) and 1705 cm−1 (C=O, Carbonyl stretching). The spectrum of PL (Fig. 2a) had peaks at 1732 cm−1 (C=O stretching), 1217 cm−1 (P=O stretching) and 1086 cm−1 (P–O–C stretching). The peaks at 1086 cm−1 and 1217 cm−1 kept in the PF-PM (Fig. 2b), but there were not observable in the spectrum of PF-PLC (Fig. 2c) probably because of the characteristic hydroxyl from PF being connected with P=O at 1217 cm−1 through van der Waals forces. In addition, the peaks at 1705 cm−1 of PF moved to 1723 cm−1 in spectrum of PF-PLC, meaning that there was shifting to high frequency in the formation of complex. The results indicated that some weak physical interactions between PF and PL had occurred during the complex formation.

FT-IR spectra of PL (a), PF-PM (b), PF-PLC (c) and PF (d).
DSC measurements were used to obtain distinct information on the polymorphism and crystallinity of the interaction between the drug and phospholipids from DSC thermograms that provide information, such as the elimination of endothermic peaks, the appearance of new peaks, and changes in peak shape and onset, peak temperature, or enthalpy. DSC was a fast and reliable method to screen drug-excipient compatibility and provided maximum information about the possible interactions. Figure 3 shows the DSC thermogram of PF (a), PL (d), PF-PLC (c) and PF-PM (b). The DSC curve of PF (Fig. 3a) exhibited a sharp exothermic peak at 126 °C, which could be owing to the phase transition from a gel-like state to a liquid-crystal state and the carbon-chain in the PF may have perhaps undergone melting, isomeric or crystal changes. While there was no peak appeared in the DSC of PF-PLC (Fig. 3c). These indicated that there was no crystallization of the PF in the PF-PLC, and PF may be dispersed molecularly or amorphously in the phospholipid molecule. The degree of the amorphization of PF-PLC was significantly higher than PF, which result in a decrease of the crystallinity and an increase of solubility. DSC analysis indicated that PF-PLC may generate a change in PF from a crystalline to an amorphous state. Compared to PF, the change of DSC thermogram of the PF-PLC signified an interaction between PF and PL.
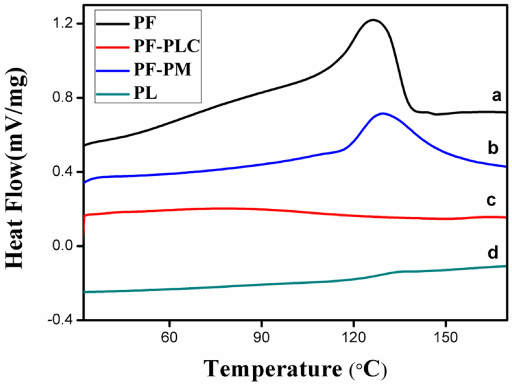
DSC thermograms of PF (a), PF-PM (b), PF-PLC (c) and PL (d).
Figure 4 shows the X-ray diffraction patterns of PF, PL, PF-PM and PF-PLC. The spectrum of PF (a) displayed characteristic peaks, which was the characteristic of a molecule with some crystallinity. On the other hand, no peaks were detected in the spectrum of PL (c), which pointed to its amorphous nature. The diffraction pattern of PF-PM (b) still showed the characteristic peaks of the drug, suggested that simple physical mixing did not change drug’s state of existence. Compared with the PF-PM (d), all the crystalline peaks had disappeared in the PF-PLC, indicated that the formed PF-PLC changed PF’s existing state from crystalline to amorphous state. The result could be attributed to the formation of complex, which was consistent with the tests of DSC and XRD.
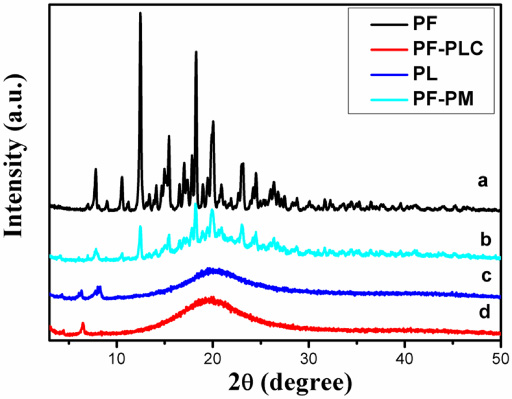
XRD pattern of PF (a), PF-PM (b), PL (c) and PF-PLC (d).
Table 3 shows lgP of PF and PF-PLC at different pH values. Figure 5a shows that lgP of PF was less than −0.3, which suggests that it was a water-soluble drug. The lgP of PF-PLC (b) was around 0.4, indicating that the liposolubility of PF was much improved. It can be seen in Fig. 5 that pH had a certain influence on the lgP of PF. In the range of pH 2.5 ∼ 4.6, the lgP of PF increased with pH value. However, decreased with the increase of pH value in the range of pH 5.0 ∼ 8. The lgP of PF in phosphate buffer at pH 4.6 was the highest. These were due to the strong dispersibility and amorphous form of the PF-PLC, and polar group of PF was masked by PL.
lgP of PF and PF-PLC at different pH values
lgP of PF and PF-PLC at different pH values
Values are mean ± SD (n = 3).
Figure 6 shows the dissolution profile of PF and PF-PLC in deionized water, respectively. The results revealed that during 2 h, the PF dissolution in deionized water was complete, but the PF-PLC was released 50%, probably released completely in 24 h. Compared to quickly release of PF solution within 2 h, PF-PLC solution could sustain the drug release for a longer period of time. Release of PF in PF-PLC follows first order release equation ln (1-Q/96.4) = −0.1216 × t-0.3201(r = 0.978, Q means cumulative released quantity). There was a quick release about 50% at the initial 2 h followed by a prolonged release with the rest of time. The quick release at the initial time could attribute to free drugs that were not in combination with PL.
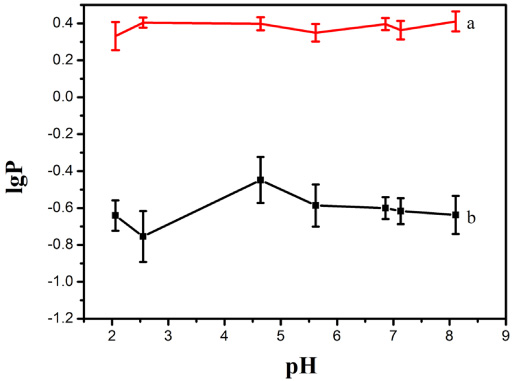
lgP of PF (b) and PF-PLC (a) at different pH values.

In vitro release profile of PF and PF-PLC in water.
The plasma concentration-time profiles of PF in rats following the oral administration of PF and PF-PLC are shown in Fig. 7. The major pharmacokinetic parameters are shown in Table 4. After oral administration of PF-PLC, the C max was 1.061 mg/mL with a t 1∕2 of about 198.303 min, while the C max was 0.424 mg/ml with a t 1∕2 of about 255.938 min of PF. The bioavailability of PF-PLC (AUC 0−∞ , 367.284 μg/mL ⋅ min) in vivo was significantly increased compared to that of PF groups (AUC 0−∞ , 186.712 μg/mL ⋅ min). The increased bioavailability of PF-PLC might be due to the enhanced lipophilicity and drug absorption in gastrointestinal tract increased by PL in formed PF-PLC.

In vivo pharmacokinetic profile of PF and PF-PLC in rats after oral administration.
Pharmacokinetic parameters of PF and PF-PLC solution in rats after oral administration (mean ± SD, n = 6)
This investigation illustrated the potential use of PL to form the complex for the enhancement of oral bioavailability of PF. PF-PLC was successfully prepared with high combination ratio (99.13 ± 1.47%) by the solvent evaporation method. In the PF-PLC, there are hydrogen bonds or van der Waals forces formed between PF with amorphous phase and PL verified by FTIR, DSC and XRD. PF-PLC exhibited better lipophilicity with high lgP and showed slower release fitting with the first order kinetics. The in vivo study indicated that the oral bioavailability of PF-PLC was markedly improved 1.97-fold compared to PF. The absorption mechanism of PF-PLC through small intestine and in vivo therapeutic evaluation should be further studied. In general, PF-PLC would be a promising formulation for PF to further exploration.
Footnotes
Acknowledgements
The authors acknowledge the funding support from the National Natural Science Foundation of China (51303006, 81703805), the Provincial Natural Science Foundation of Anhui Province (KJ2018ZD031, 1408085MH196) and the University’s Excellent Top-notch Personnel Training Fund of Anhui Province (gxfx2017050).
Conflict of interest
The authors report no conflict of interest. The authors alone are responsible for the content and writing of this article.