
Abstract
BACKGROUND:
In vivo evaluation of the elastic properties of the knee joint capsule has not been adequately performed.
OBJECTIVES:
To establish a methodology to assess the stiffness of the normal knee joint capsule over a range of knee flexion angles using ultrasound elastography.
METHODS:
Ultrasound elastography with an acoustic coupler was used to assess the stiffness of the anteromedial capsule of the knee joints of 10 male (mean age 22.63 ± 1.02 years) and 10 female (mean age 21.6 ± 0.8 years) subjects at static knee flexion angles of 0°, 45°, 90°, and 120°. Relative stiffness of the capsule was obtained using the strain ratio (SR), defined as the ratio of the strain in the capsule to that in the acoustic coupler.
RESULTS:
The intraclass correlation coefficient (1, 3) ranged from 0.95 to 0.96, and the correlation coefficient between examiners (2, 3) was 0.94. SR values decreased significantly as the flexion angle increased (P < 0.01). At 90° and 120°, it was significantly higher in female than in male subjects (P < 0.01).
CONCLUSIONS:
This study established a feasible and reproducible method to obtain the stiffness characteristics of the anteromedial knee joint capsule using ultrasound elastography with an acoustic coupler.
Keywords
Introduction
The joint capsule of the knee is a two-layer sleeve covering the knee joint. The outer layer is a fibrous membrane that contains ligament tissues, and the inner layer contains the synovial membrane that secretes synovial fluid. Therefore, the major functions of the knee capsule include providing stability to the joint and lubricating the articular surfaces to facilitate smooth joint movements. Research findings provide evidence that larger forces transferred between capsular regions and the knee capsule play vital roles in stabilizing the knee joint against rotatory stresses [1,2]. In addition, the knee capsule is highly innervated, including several types of proprioceptors such as free nerve endings, which are sensitive to pain, Ruffini receptors responsible for sensing joint angle, velocity, and intra-articular pressure, and type II Pacinian corpuscles for sensing dynamic changes in the joint [3,4]. The knee capsule is one of the sources of nociception in knee osteoarthritis (OA) [5]. In recent years, flexibility of the joint capsule has been considered one of the factors related to knee pain and the limited knee flexion range present with knee OA. However, there is no established methodology to measure the flexibility of the knee joint capsule in vivo; there has only been an in vitro study reported by Rachmat et al. [6], which assessed the mechanical properties of the normal posterior knee joint capsule. In their study, knee capsules were dissected from five cadavers, and each posterior capsule was sliced into three specimens (medial, lateral, and central) with a width of 5 mm. Tensile testing was then performed on each specimen, and the global and local deformations were quantified. The findings showed that overall stiffness of the normal posterior capsule would be estimated to be 93 N/mm, and the capsule ruptures when reaching strain of 30% [6]. There are some concerns with respect to applying these findings to gain an understanding of the stiffness of the knee capsule, since their purpose was to use their findings with the finite element method, capsular specimens were taken from five elderly donors (79.2 ± 7.9 years), and the stiffness values obtained from the specimens varied widely. In addition, understanding of the tissue elongation pattern through in vitro studies is debatable because the tissue may not behave in the same way that it would in vivo due to various forces acting on it from surrounding soft tissues.
Ultrasound elastography has become a widely used technique for stiffness imaging. It was first used to diagnose breast and liver malignancies, since it provides an objective way to differentiate benign from malignant lesions [7]. Strain elastography (SEG) is one of the elastography techniques used to estimate the relative stiffness of living tissues by creating tissue strain. In this method, repeated light compression is applied to a target tissue using a hand-held ultrasound transducer, and the amount of strain (displacement) induced by the compression is estimated by comparing sets of pre and post displacement ultrasound images. Changes in the B-mode image over time are displayed real-time in a strain distribution map or elastogram. In the elastogram, softer areas of the tissue are shown in red, harder areas in blue, and areas with intermediate stiffness are in yellow or green colours. Furthermore, SEG provides semi-quantitative measurement of stiffness of the target tissue. Built-in software of the elastography machine calculates the ratio of the relative strains between a target tissue area and a reference material (strain ratio, SR). Overlying fat pads and subcutaneous tissues are commonly used as reference tissues [8,9]. However, using a fat pad and subcutaneous tissue as internal reference materials is debatable because the strain of these materials may change with sex, age, and certain pathological conditions. Therefore, in recent years, an acoustic coupler with a known Young’s modulus has been developed and recommended as a standard reference when measuring the SR [10,11]. It was reported that the coupler with an acoustic impedance has a constant hardness that is equal to the body surface and has an ability to adapt to the shape of areas where the SR measurements are difficult to obtain [11]. Recently, a few studies have used SEG with an acoustic coupler to detect changes in the elastic properties of the supraspinatus muscle belly and its tendon and the Achilles tendon [12,13]. They confirmed that ultrasound elastography with an acoustic coupler is a reproducible method for assessing the elastic properties of these soft tissues. SEG has been widely used for assessing soft tissues such as the Achilles and patellar tendons [8–10,13–15]. However, similar assessment of the knee joint capsule has not yet been reported.
Therefore, the aims of this in vivo study were to apply ultrasound elastography to assess the stiffness of the normal anteromedial joint capsule at different knee flexion angles and to investigate sex-specific differences in the obtained values.
Materials and methods
Study population
Twenty healthy young adults with no history of knee joint injury, painful conditions, or joint abnormalities were recruited for this study. The study sample included 10 male (age 22.63 ± 1.02 years, BMI 21.84 ± 2.46 kg/m2) and 10 female (age 21.6 ± 0.8 years, BMI 19.40 ± 1.73 kg/m2) subjects. They were informed of the study objectives, examination procedure, and the safety of ultrasound elastography, and written informed consent was obtained from each subject. This study was approved by the Institutional Internal Review Board.
Examination procedure
RTE was performed using a general-purpose ultrasonic device (Hi Vision Avius; Hitachi Aloka Medical Corp., Tokyo, Japan) with a 10 MHz ultrasonic linear probe (EUP-L 75; Hitachi Aloka Medical Corp.). As the reference material, an acoustic coupler (EZU-TECPL1; Hitachi Aloka Medical Corp.) with a known Young’s modulus (22.6 ± 2.2 kPa) was used. It was attached to the tip of the probe using a dedicated plastic attachment (EZU-TEATC2; Hitachi Aloka Medical Corp.) [12,13] (Fig. 1). Before performing SEG, subjects were asked to perform knee flexion and extension 15 times to precondition the soft tissues around the knee joint. The acoustic coupler was also preconditioned by applying 10–15 compressions manually. The measurement site for the knee joint capsule was the anteromedial aspect of the right knee, 3.5 cm above the knee joint space and 1.5 cm medial to the medial epicondyle of the femur, as shown in Fig. 2. Based on the evidence that reproducibility of SR is good in longitudinal elastograms [14], SEG was performed in the longitudinal plane in the present study. First, through ultrasound B-mode scanning, a clear image of the anteromedial joint capsule of the knee was obtained. Then, slight repeated compressions were applied through the hand-held ultrasound probe. One to two compressions with a depth of 2 mm were applied per second while referring to the strain graph to maintain a uniform compression force [7]. Compression-relaxation cycles were displayed in the strain graph, and the best superimposed image was chosen from the last three images. Elastographic and B-mode images (bottom) of the anteromedial knee joint capsule are shown with the strain graph in Fig. 3.
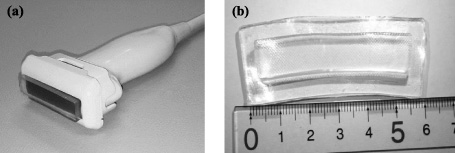
(a) Ultrasonic linear probe and acoustic coupler with the attachment. (b) Acoustic coupler.

(a) Ultrasound probe placement for the anteromedial knee joint capsule. The rectangular shape indicates where the probe is placed, about 3.5 cm above the knee joint space and about 1.5 cm medial to the medial epicondyle of the femur. (b) Ultrasound probe placement on the anteromedial knee joint capsule.

(a) Elastographic (top) and B-mode images (bottom) of the anteromedial knee joint capsule are shown with the strain graph, with strain ratio values of both the capsule and coupler. The yellow rectangle indicates the ROI of the acoustic coupler, and the yellow oblique shape indicates the ROI of the anteromedial knee joint capsule. (b) An enlarged view of the ROIs of the capsule and the coupler.
In this study, relative stiffness of the knee capsule was obtained using the SR, and it was defined by the ratio of the strain in the capsule to that in the acoustic coupler as follows:
This SR calculation is done by built-in software in the ultrasound machine comparing the displacement that occurred in the target tissue and in the reference material in response to the applied compressions. As shown in Fig. 3, the region of interest (ROI) of the coupler was set by marking a rectangular area covering the entire area of the coupler (4 cm in width and 0.5 cm in height), and the ROI of the capsule was drawn covering the capsular length of approximately 2 cm in the strain image. Uniformity of the applied compression force was controlled by referring to the strain graph, maintaining the same colour distribution of the coupler ROI, as well as by keeping the strain of the coupler between 0.30% and 0.40% in every knee position. Lower SR values indicate greater capsular stiffness.
SR measurements were obtained in four different static positions of knee joint flexion: 0° (full extension), 45°, 90°, and 120°. The knee flexion angles were measured using a universal goniometer. For the 0° position, SEG was performed with the subjects lying supine. They were placed in the right lateral decubitus position for the three other knee flexion positions by keeping their right limbs straight on the examination couch and the left limbs comfortably flexed on a cushion wedge. Three SR were obtained in each subject in each knee flexion angle.
Data analysis
In the present study, each subject was examined three times by two examiners in the 0° position in order to assess the reliability of the application of SEG. Measurement reliability of the obtained SR values were assessed using intraclass correlation coefficient (ICC). ICC is a measure of the reliability of measurements or ratings. The intra-rater correlation coefficient, ICC(1, 3) estimates the correlation between the three measurements of the subject obtained within the same examiner. The inter-rater correlation coefficient ICC(2, 3) estimates the correlation of the measurements within the same subject between the two examiners. These inter and intra-rater correlation coefficient values classified as poor (ICC value between 0.00–0.20), fair (ICC value between 0.20–0.40) and excellent (ICC >0.75) measurement reliability [16]. Data analyses were performed using SPSS (Statistical Package for Social Sciences version 23.0., IBM Corp. Armonk, NY, USA).
To assess changes in SR of the knee capsule from 0° to 45°, 90°, and 120° knee flexion, multiple comparison one-way ANOVA with the post hoc Tukey test was used. SR values were compared among male and female subjects at each flexion angle by two-sided paired t-tests. Also the present study calculated normalized SR. It was defined as, amount of change of the SR value in the knee capsule at each knee flexion angle to the SR value at 0° as follows:
The ICC(1, 3) values of the SR measurements obtained by each examiner, in the 0° knee flexion position were 0.95 and 0.96, respectively, and ICC(2, 3) value of the SR measurement between the examiners was 0.94, as presented in Table 1. These results indicated higher measurement reliability.
Intra-rater and inter-rater reliabilities of strain ratio measurements obtained from three measurements of each examiner with the knee in the 0° position
Intra-rater and inter-rater reliabilities of strain ratio measurements obtained from three measurements of each examiner with the knee in the 0° position
The typical changes in the SEG images of the anteromedial knee joint capsule in each flexion angle are illustrated in Fig. 4. At 0°, the capsule appeared in mixed red and yellow colours (soft) and gradually turned to a blue colour (stiff) at 120°, indicating that the capsular stiffness increased with knee flexion. The post hoc Tukey test also showed that SR values of the whole study sample decreased significantly (P < 0.01) as the knee flexion angle increased, as shown in Fig. 5. The average SR values of male and female subjects were 1.65 ± 0.15 and 1.58 ± 0.16 at 0°, respectively, 0.88 ± 0.15 and 0.91 ± 0.15 at 45°, respectively, 0.49 ± 0.10 and 0.60 ± 0.14 at 90°, respectively, and 0.32 ± 0.11 and 0.42 ± 0.12 at 120°, respectively (Fig. 6). At 90° and 120° flexion, the SR values of female subjects were significantly higher than of male subjects (P < 0.01), indicating lower capsular stiffness in female subjects.
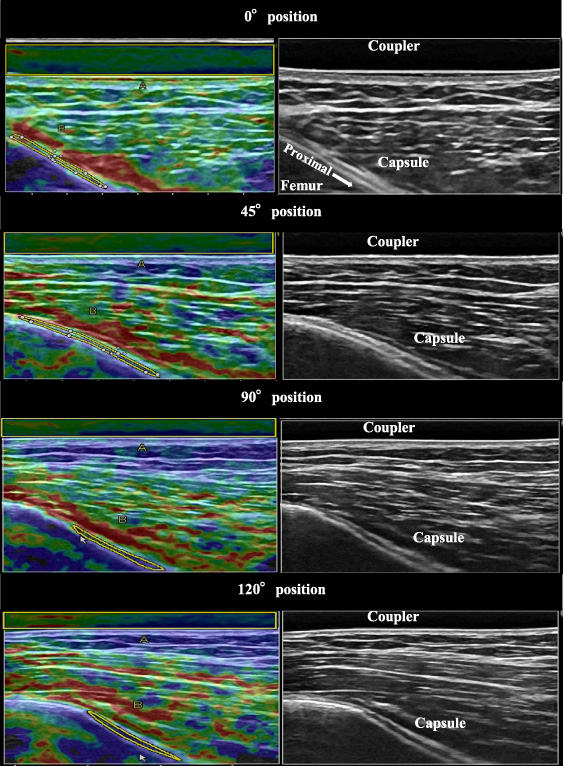
The left side images show the changes on SEG images (soft to hard) in the anteromedial knee capsule when knee flexion increases from 0° to 120°. At 0°, the capsule appears in mixed red and yellow colours and gradually turns to a blue colour at 120°, indicating that stiffness increases with knee flexion. The right side grey images are the corresponding B-mode images. The yellow colour rectangles are the ROIs of the acoustic coupler, and the yellow oblique shapes are the ROIs of the capsular area.

Strain ratio of the anteromedial knee joint capsule in the whole study sample (both male and female) at different knee flexion angles. SR values decrease significantly as the knee flexion angle increases from 0° to 120° (P < 0.01). The bars and error bars indicate averages and standard deviation, respectively.
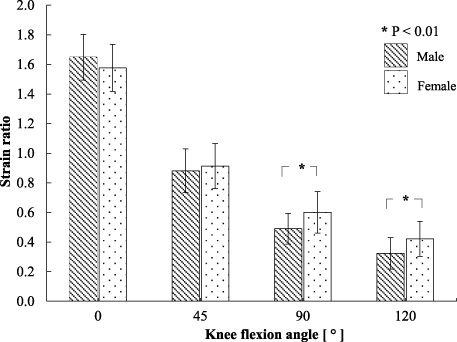
Strain ratio of the anteromedial knee joint capsule in the male and female subjects in the different knee flexion angles. In the 90° and 120° knee positions, the SR values are significantly higher for female than for male knee capsules (P < 0.01). The bars and error bars indicate averages and standard deviation, respectively.
The analysis of the normalized SR of the study sample (both male and female) showed significant differences (P < 0.01) at each knee position compared to that in 0° flexion, as presented in Fig. 7. The normalized SR was 44%, 66%, and 77% at 45°, 90°, and 120° flexion, respectively. Figure 8 shows that the normalized SR was higher in male than in female subjects, and the difference was significant in the 90° and 120° positions (P < 0.05).
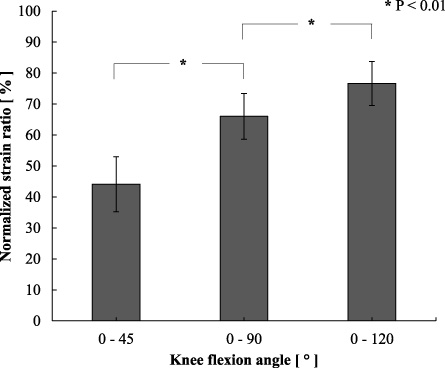
Normalized strain ratio of the whole study sample at 45°, 90°, and 120° knee flexion angles. The normalised strain ratio at each knee position was defined by calculating the change in the SR at 45°, 90°, and 120° to the SR at 0°. It shows significant differences at each knee angle compared to 0° (P < 0.01). The bars and error bars indicate averages and standard deviation, respectively.
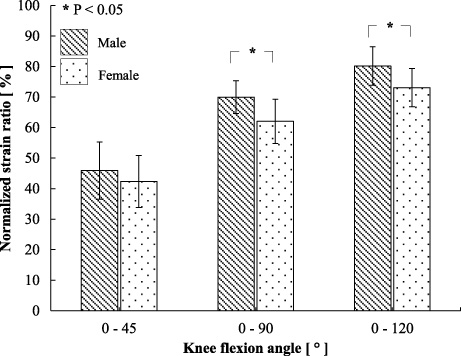
Differences of the normalized strain ratio between the male and female subjects in the 45°, 90°, and 120° knee flexion positions. SR is normalized from the 0° knee position. The normalized SR is greater in male than in female subjects, and it is significantly greater in the 90° and 120° knee flexion positions (P < 0.05). The bars and error bars indicate averages and standard deviation, respectively.
This study is the first attempt to describe the elasticity of the anteromedial knee joint capsule in vivo over a range of knee flexion angles using ultrasound SEG with an acoustic coupler. The present results with high intra-rater (ICC(1, 3), 0.95–0.96) and inter-rater reliability (ICC(2, 3), 0.94) demonstrated that the measurement method in the present study offered good reliability. There is a concern that manual compressions applied in SEG can affect measurement reliability. Therefore, in the present study, the following precautions were taken when obtaining SR values. Apart from observing uniformity in the strain graph, a constant strain image of the coupler with strain values between 0.30% and 0.40% was maintained in all measuring positions of each subject, the examiners were given a training session prior to the study, and SR values were obtained from an average of three measurements. In addition, limb positions were fixed in the corresponding knee flexion angles before the scanning process, since it may affect the reliability of the SR values [17], and the capsule and coupler were preconditioned prior to the examination procedure. Therefore, the measuring method that was used in this study ensured reproducibility. Muraki et al. [12], in their study measuring SR of the supraspinatus muscle belly and the tendon using the same acoustic coupler and the same ultrasound system as in the present study, reported high intra-rater reliability, ranging from 0.931 to 0.998. Another SEG study using the same acoustic coupler and the same ultrasound system for the Achilles tendon also showed intra-rater reliability of 0.87 and 0.93 [13]. However, intra-rater reliability of 0.66 to 0.78 and inter-rater reliability of 0.51 were reported by Drakonaki et al. [14] in their study using Kager’s fat pad as the reference material to assess the Achilles tendon. These findings suggested that our measurement procedure with an acoustic coupler as the reference would assure measurement reliability.
The findings of the present study showed that the relative stiffness of the knee capsule increased when the knee flexion angle increased. Rachmat et al. [6] also found that Young’s modulus of the posterior knee joint capsule increased with increasing of the applied load. The general force-displacement curve of hard tissues such as bones increases linearly with applied force or the displacement is equal. In contrast, soft tissues such as tendons [18] show non-linear behaviour, in which stiffness differs from point to point. Therefore, it is important to identify the stiffness of a soft tissue at different flexion angles to estimate overall elastic behaviour. The findings of the present study showed that the relative stiffness of the anteromedial knee joint capsule increased non-linearly when knee flexion increased from 0–120°. Many previously reported ultrasonography studies examined soft tissue elasticity at one joint angle [8,14]. However, a few studies analysing elastic behaviour at different joint positions obtained findings similar to those of the present study showing that the elastic behaviour of musculotendinous structures varies with the joint movement angle [19–21]. Pearson et al. [19], who examined the patellar tendon in varying knee positions, reported greater tendon strain at greater knee flexion angles, and that the elastic behaviour of the tendon was different at each angle.
The present study calculated the normalised SR values when the knee joint was flexed from 0° to 45°, 90°, and 120°. The results showed that the relative stiffness of the knee joint capsule increased at each flexion angle. This calculation of the normalized SR values in the present study indicated that SEG can be taken as a quantitative technique to assess tissue stiffness, since the difference in the SR values at each flexion angle (compared to the 0° position of the knee) can be obtained quantitatively.
The average SR of the knee joint capsule in both male and female subjects of the present study was 1.61 ± 0.16. Previous studies using ultrasound elastography found that the SR ranged from 0.6 to 5.2 (average 1.8) and was 1.23 ± 0.95 in the Achilles tendon [14,15], 0.138 ± 0.14 in the supraspinatus tendon [12], 1.47–1.73 in the quadriceps tendon [8], and 1.47 ± 0.64 in the patellar tendon [9]. The values obtained in the present study are in accordance with the SR values of the Achilles, patellar, and quadriceps tendons. On the other hand, some studies reported contrasting SR values, such as 0.37–0.46 for the Achilles tendon and 0.41–0.62 for the patellar tendon [8,13]. Therefore, it can be suggested that the SR may be used only as a comparative value, rather than as a definite absolute value.
The present results showed that the relative stiffness of the knee capsule was greater in male than in female subjects as knee flexion increased, and the difference was significant at 90° and 120° flexion. This finding agrees with many previous reports of other soft tissues, such as the Achilles, patellar, and gastrocnemius tendons [21–24]. There are still unidentified factors causing the differences in the soft tissue properties between males and females. This could be partly due to higher body mass and muscle strength in males, metabolic factors, differences in dimensions of the soft tissues, or intrinsic differences in tendon composition or tendon moment arm [23,25,26]. Recent studies reported that female sex hormones have an effect on soft tissue properties [27–29]. Musculotendinous stiffness is found be low during the ovulatory phase of the menstrual cycle [27]. However, some studies reported contrasting findings for certain soft tissues, with no significant difference in tendon stiffness between male and female subjects [30,31].
There were a couple of limitations in this study. First, there is a concern that SR measurements could be affected by the applied manual compression. However, good intra-rater and inter-rater reliabilities were obtained with certain precautions added to the methodology. Second, the capsular ROI of the present study did not represent the total area of the anteromedial capsule. Other areas of the capsule should also be evaluated in future studies. Generally, joint capsules possess viscoelastic properties [6], and their mechanical characteristics depend on the applied strain rate. The present study measured the stiffness of the knee joint capsule at four different static knee flexion angles. To minimize the effect of viscosity on capsular stiffness, the capsule and the other soft tissues around the knee joint were preconditioned with active knee bending and straightening movements.
In the present study, basic data regarding the relative stiffness of the knee joint capsule in a group of healthy young male and female subjects were obtained. In future studies, these values need to be compared with those obtained from different age groups and with pathological conditions in order to understand any deviations from normal.
Conclusions
This study established a feasible and reproducible method to obtain relative stiffness of the anteromedial knee joint capsule using ultrasound elastography with an acoustic coupler. The relative stiffness of the knee capsule was found to increase with knee flexion from 0° to 120°, and capsular stiffness was lower in female than in male subjects. Understanding the elastic behaviour of the knee joint capsule at varying knee angles will be useful in assessing knee joint pathologies, as well as in knee rehabilitation.